South Mills, North Carolina (NC) income map, earnings map, and wages data

Data:
The per capita income in 2022 was $23,522, which means an increase of 20.6% compared to 2000 when it was $18,681.
Whole page based on the data from 2000 / 2022 when the population of South Mills, North Carolina was 454 / 641
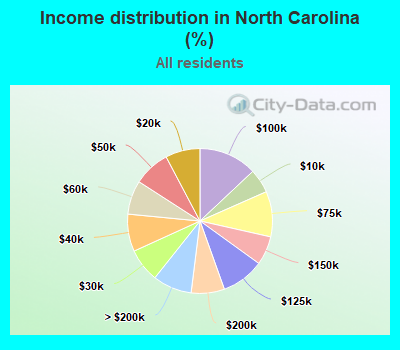
Income statistics for all residents
Number of households with income < $10k:| South Mills: | 0.0% (0) |
| North Carolina: | 5.4% (232,212) |
Number of households with income $10k - 20k:| South Mills: | 0.0% (0) |
| State: | 7.7% (331,976) |
Number of households with income $20k - 30k:| South Mills: | 10.2% (22) |
| North Carolina: | 7.5% (321,882) |
Number of households with income $30k - 40k:| South Mills: | 43.3% (93) |
| State: | 8.3% (358,489) |
Number of households with income $40k - 50k:| South Mills: | 0.0% (0) |
| State: | 8.2% (350,907) |
Number of households with income $50k - 60k:| South Mills: | 0.0% (0) |
| State: | 7.6% (326,126) |
Number of households with income $60k - 75k:| South Mills: | 17.2% (37) |
| North Carolina: | 10.1% (435,678) |
Number of households with income $75k - 100k:| South Mills: | 0.0% (0) |
| State: | 13.0% (558,943) |
Number of households with income $100k - 125k:| South Mills: | 7.4% (16) |
| North Carolina: | 9.6% (411,954) |
Number of households with income $125k - 150k:| South Mills: | 21.9% (47) |
| State: | 6.4% (276,370) |
Number of households with income $150k - 200k:| South Mills: | 0.0% (0) |
| North Carolina: | 7.4% (319,173) |
Number of households with income > $200k:| South Mills: | 0.0% (0) |
| State: | 8.7% (375,556) |
Aggregate household income in South Mills in 2022: $14,955,024
Median per capita income in South Mills in 2022:| South Mills: | $23,522 |
| North Carolina: | $38,701 |
Change in median per capita income between 2000 and 2022:| South Mills, North Carolina: | +25.9% |
| State: | +90.6% |
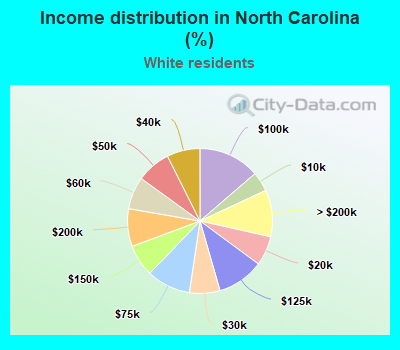
Income statistics for White residents
Number of households with income < $10k:| South Mills: | 0.0% (0) |
| North Carolina: | 4.4% (125,166) |
Number of households with income $10k - 20k:| South Mills: | 0.0% (0) |
| North Carolina: | 6.6% (187,893) |
Number of households with income $20k - 30k:| South Mills: | 11.2% (22) |
| North Carolina: | 6.8% (194,490) |
Number of households with income $30k - 40k:| South Mills: | 41.1% (81) |
| North Carolina: | 7.4% (210,508) |
Number of households with income $40k - 50k:| South Mills: | 0.0% (0) |
| North Carolina: | 7.6% (217,521) |
Number of households with income $50k - 60k:| South Mills: | 0.0% (0) |
| State: | 7.2% (206,197) |
Number of households with income $60k - 75k:| South Mills: | 17.8% (35) |
| North Carolina: | 9.8% (279,732) |
Number of households with income $75k - 100k:| South Mills: | 0.0% (0) |
| North Carolina: | 13.7% (390,042) |
Number of households with income $100k - 125k:| South Mills: | 7.6% (15) |
| North Carolina: | 10.4% (297,273) |
Number of households with income $125k - 150k:| South Mills: | 22.3% (44) |
| North Carolina: | 7.2% (203,852) |
Number of households with income $150k - 200k:| South Mills: | 0.0% (0) |
| State: | 8.4% (239,971) |
Number of households with income > $200k:| South Mills: | 0.0% (0) |
| State: | 10.4% (297,649) |
Aggregate household income in South Mills in 2022: $14,193,937
Median per capita income in South Mills in 2022:| South Mills: | $23,898 |
| State: | $44,946 |
Change in median per capita income between 2000 and 2022:| South Mills, North Carolina: | +25.4% |
| North Carolina: | +95.8% |
Income statistics for Black or African American residents
Aggregate household income in South Mills in 2022: $261,069,569
Median per capita income in South Mills in 2022:| South Mills: | $37,132 |
| North Carolina: | $28,411 |
Change in median per capita income between 2000 and 2022:| South Mills, North Carolina: | +107.4% |
| North Carolina: | +109.7% |