The median household income in Stilwell, OK in 2022 was $30,647, which was 94.7% less than the median annual income of $59,673 across the entire state of Oklahoma. Compared to the median income of $18,555 in 2000 this represents an increase of 39.5%. The per capita income in 2022 was $16,297, which means an increase of 38.4% compared to 2000 when it was $10,034.
Whole page based on the data from 2000 / 2022 when the population of Stilwell, Oklahoma was 3,276 / 3,778
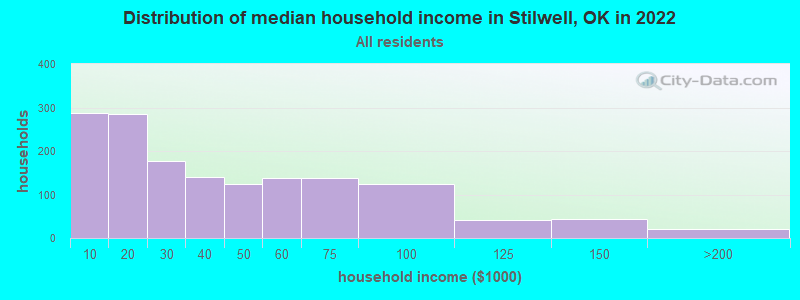
Income statistics for all residents
Median household income in Stilwell, OK in 2022:
Stilwell:
$30,648
Oklahoma:
$59,673
Change in median household income between 2000 and 2022:
Stilwell, Oklahoma:
+65.2%
State:
+78.7%
Number of households with income < $10k:
Stilwell:
18.9% (288)
State:
6.4% (100,950)
Number of households with income $10k - 20k:
Stilwell:
18.7% (285)
Oklahoma:
8.8% (137,709)
Number of households with income $20k - 30k:
Stilwell:
11.6% (176)
State:
9.1% (143,661)
Number of households with income $30k - 40k:
Stilwell:
9.2% (140)
Oklahoma:
9.0% (141,098)
Number of households with income $40k - 50k:
Stilwell:
8.2% (125)
State:
8.9% (140,217)
Number of households with income $50k - 60k:
Stilwell:
9.1% (139)
State:
8.1% (126,882)
Number of households with income $60k - 75k:
Stilwell:
9.1% (139)
State:
10.0% (157,916)
Number of households with income $75k - 100k:
Stilwell:
8.1% (123)
State:
12.4% (195,015)
Number of households with income $100k - 125k:
Stilwell:
2.7% (41)
Oklahoma:
9.0% (141,779)
Number of households with income $125k - 150k:
Stilwell:
2.9% (44)
State:
5.8% (91,594)
Number of households with income $150k - 200k:
Stilwell:
1.4% (21)
State:
6.3% (98,589)
Number of households with income > $200k:
Stilwell:
0.0% (0)
Oklahoma:
6.2% (97,770)
Aggregate household income in Stilwell in 2022: $60,110,034
Median family income in Stilwell in 2022:
Stilwell:
$35,459
State:
$75,476
Number of families with income < $10k:
Stilwell:
11.1% (107)
Oklahoma:
4.2% (42,724)
Number of families with income $10k - 20k:
Stilwell:
15.5% (149)
Oklahoma:
4.9% (49,571)
Number of families with income $20k - 30k:
Stilwell:
14.3% (138)
Oklahoma:
6.3% (64,367)
Number of families with income $30k - 40k:
Stilwell:
12.0% (115)
State:
7.5% (76,467)
Number of families with income $40k - 50k:
Stilwell:
14.3% (137)
State:
8.3% (84,578)
Number of families with income $50k - 60k:
Stilwell:
7.5% (72)
Oklahoma:
7.8% (79,642)
Number of families with income $60k - 75k:
Stilwell:
7.4% (71)
State:
10.6% (108,169)
Number of families with income $75k - 100k:
Stilwell:
8.9% (86)
State:
14.6% (148,857)
Number of families with income $100k - 125k:
Stilwell:
4.2% (40)
Oklahoma:
11.2% (113,480)
Number of families with income $125k - 150k:
Stilwell:
3.4% (33)
State:
7.6% (77,253)
Number of families with income $150k - 200k:
Stilwell:
1.3% (12)
Oklahoma:
8.4% (85,947)
Median non-family income in Stilwell in 2022:
Stilwell:
$14,091
Oklahoma:
$35,419
Change in median non-family income between 2000 and 2022:
Stilwell, Oklahoma:
+42.8%
State:
+83.2%
Median per capita income in Stilwell in 2022:
Stilwell:
$16,298
State:
$32,930
Change in median per capita income between 2000 and 2022:
Stilwell, Oklahoma:
+62.4%
Oklahoma:
+86.6%
Income statistics for White residents
Median household income in Stilwell, OK in 2022:
Stilwell:
$39,773
Oklahoma:
$63,444
Change in median household income between 2000 and 2022:
Stilwell, Oklahoma:
+128.2%
State:
+79.3%
Number of households with income < $10k:
Stilwell:
10.7% (67)
State:
5.5% (60,994)
Number of households with income $10k - 20k:
Stilwell:
14.9% (94)
State:
8.2% (91,263)
Number of households with income $20k - 30k:
Stilwell:
13.5% (85)
Oklahoma:
8.7% (96,988)
Number of households with income $30k - 40k:
Stilwell:
11.8% (74)
State:
8.4% (93,121)
Number of households with income $40k - 50k:
Stilwell:
8.7% (55)
State:
8.6% (95,446)
Number of households with income $50k - 60k:
Stilwell:
11.3% (71)
State:
7.9% (87,723)
Number of households with income $60k - 75k:
Stilwell:
12.9% (81)
State:
9.9% (109,955)
Number of households with income $75k - 100k:
Stilwell:
7.6% (48)
Oklahoma:
12.9% (143,880)
Number of households with income $100k - 125k:
Stilwell:
3.2% (20)
State:
9.7% (107,851)
Number of households with income $125k - 150k:
Stilwell:
3.5% (22)
State:
6.3% (69,802)
Number of households with income $150k - 200k:
Stilwell:
1.9% (12)
Oklahoma:
6.9% (76,863)
Number of households with income > $200k:
Stilwell:
0.0% (0)
State:
7.0% (78,099)
Aggregate household income in Stilwell in 2022: $28,353,388
Median family income in Stilwell in 2022:
Stilwell:
$44,989
State:
$82,251
Number of families with income < $10k:
Stilwell:
2.1% (8)
State:
3.4% (24,057)
Number of families with income $10k - 20k:
Stilwell:
17.3% (65)
State:
4.1% (29,440)
Number of families with income $20k - 30k:
Stilwell:
13.7% (51)
State:
5.7% (40,670)
Number of families with income $30k - 40k:
Stilwell:
16.9% (64)
State:
6.5% (46,540)
Number of families with income $40k - 50k:
Stilwell:
8.8% (33)
State:
7.7% (55,082)
Number of families with income $50k - 60k:
Stilwell:
3.3% (12)
State:
7.5% (53,408)
Number of families with income $60k - 75k:
Stilwell:
10.4% (39)
State:
10.4% (74,624)
Number of families with income $75k - 100k:
Stilwell:
13.3% (50)
State:
15.3% (109,679)
Number of families with income $100k - 125k:
Stilwell:
5.2% (20)
State:
12.0% (86,208)
Number of families with income $125k - 150k:
Stilwell:
5.9% (22)
State:
8.3% (59,328)
Number of families with income $150k - 200k:
Stilwell:
3.1% (12)
State:
9.4% (67,640)
Median non-family income in Stilwell in 2022:
Stilwell:
$18,780
State:
$36,941
Change in median non-family income between 2000 and 2022:
Stilwell, Oklahoma:
+115.4%
Oklahoma:
+83.5%
Median per capita income in Stilwell in 2022:
Stilwell:
$21,059
State:
$37,390
Change in median per capita income between 2000 and 2022:
Stilwell, Oklahoma:
+70.6%
State:
+92.4%
Income statistics for Black or African American residents
Number of households with income < $10k:
Stilwell:
100.0% (27)
Oklahoma:
12.9% (13,905)
Number of households with income $10k - 20k:
Stilwell:
0.0% (0)
Oklahoma:
12.7% (13,734)
Number of households with income $20k - 30k:
Stilwell:
0.0% (0)
State:
11.0% (11,826)
Number of households with income $30k - 40k:
Stilwell:
0.0% (0)
State:
11.4% (12,301)
Number of households with income $40k - 50k:
Stilwell:
0.0% (0)
State:
11.3% (12,200)
Number of households with income $50k - 60k:
Stilwell:
0.0% (0)
State:
6.4% (6,925)
Number of households with income $60k - 75k:
Stilwell:
0.0% (0)
State:
8.3% (8,947)
Number of households with income $75k - 100k:
Stilwell:
0.0% (0)
Oklahoma:
9.5% (10,253)
Number of households with income $100k - 125k:
Stilwell:
0.0% (0)
State:
5.5% (5,928)
Number of households with income $125k - 150k:
Stilwell:
0.0% (0)
Oklahoma:
3.6% (3,885)
Number of households with income $150k - 200k:
Stilwell:
0.0% (0)
State:
4.2% (4,529)
Number of households with income > $200k:
Stilwell:
0.0% (0)
Oklahoma:
3.3% (3,551)
Aggregate household income in Stilwell in 2022: $187,036
Median per capita income in Stilwell in 2022:
Stilwell:
$3,888
State:
$24,741
Change in median per capita income between 2000 and 2022:: -64.7%
Stilwell, Oklahoma:
-64.7%
State:
+98.7%
Income statistics for Hispanic or Latino residents
Median household income in Stilwell, OK in 2022:
Stilwell:
$41,688
State:
$52,856
Change in median household income between 2000 and 2022:
Stilwell, Oklahoma:
+49.6%
State:
+89.4%
Number of households with income < $10k:
Stilwell:
24.5% (23)
State:
6.0% (7,958)
Number of households with income $10k - 20k:
Stilwell:
0.0% (0)
State:
8.4% (11,153)
Number of households with income $20k - 30k:
Stilwell:
14.9% (14)
State:
9.7% (13,003)
Number of households with income $30k - 40k:
Stilwell:
0.0% (0)
State:
11.7% (15,624)
Number of households with income $40k - 50k:
Stilwell:
26.6% (25)
State:
11.0% (14,697)
Number of households with income $50k - 60k:
Stilwell:
0.0% (0)
State:
9.6% (12,832)
Number of households with income $60k - 75k:
Stilwell:
2.1% (2)
State:
12.2% (16,321)
Number of households with income $75k - 100k:
Stilwell:
8.5% (8)
State:
12.5% (16,668)
Number of households with income $100k - 125k:
Stilwell:
23.4% (22)
Oklahoma:
7.5% (9,988)
Number of households with income $125k - 150k:
Stilwell:
0.0% (0)
State:
4.5% (6,042)
Number of households with income $150k - 200k:
Stilwell:
0.0% (0)
Oklahoma:
3.8% (5,080)
Number of households with income > $200k:
Stilwell:
0.0% (0)
State:
3.0% (4,063)
Aggregate household income in Stilwell in 2022: $4,646,362
Median per capita income in Stilwell in 2022:
Stilwell:
$14,083
Oklahoma:
$19,473
Change in median per capita income between 2000 and 2022:
Stilwell, Oklahoma:
+97.7%
State:
+97.3%
Income statistics for American Indian and Alaska Native residents
Median household income in Stilwell, OK in 2022:
Stilwell:
$26,239
State:
$53,261
Change in median household income between 2000 and 2022:
Stilwell, Oklahoma:
+40.6%
State:
+94.7%
Number of households with income < $10k:
Stilwell:
24.6% (153)
Oklahoma:
8.0% (7,959)
Number of households with income $10k - 20k:
Stilwell:
21.7% (135)
State:
11.2% (11,175)
Number of households with income $20k - 30k:
Stilwell:
7.2% (45)
State:
9.7% (9,654)
Number of households with income $30k - 40k:
Stilwell:
7.5% (47)
State:
9.1% (9,092)
Number of households with income $40k - 50k:
Stilwell:
5.3% (33)
Oklahoma:
9.1% (9,020)
Number of households with income $50k - 60k:
Stilwell:
10.0% (62)
Oklahoma:
8.8% (8,714)
Number of households with income $60k - 75k:
Stilwell:
7.9% (49)
State:
10.7% (10,616)
Number of households with income $75k - 100k:
Stilwell:
9.5% (59)
State:
11.5% (11,402)
Number of households with income $100k - 125k:
Stilwell:
1.6% (10)
State:
8.8% (8,769)
Number of households with income $125k - 150k:
Stilwell:
3.4% (21)
State:
5.0% (4,965)
Number of households with income $150k - 200k:
Stilwell:
1.4% (9)
State:
4.5% (4,512)
Number of households with income > $200k:
Stilwell:
0.0% (0)
State:
3.6% (3,569)
Aggregate household income in Stilwell in 2022: $24,886,417
Median family income in Stilwell in 2022:
Stilwell:
$32,442
State:
$61,590
Number of families with income < $10k:
Stilwell:
24.4% (106)
Oklahoma:
7.2% (4,788)
Number of families with income $10k - 20k:
Stilwell:
12.2% (53)
State:
6.3% (4,189)
Number of families with income $20k - 30k:
Stilwell:
10.1% (44)
Oklahoma:
7.3% (4,840)
Number of families with income $30k - 40k:
Stilwell:
7.9% (34)
State:
8.6% (5,712)
Number of families with income $40k - 50k:
Stilwell:
16.1% (70)
State:
9.6% (6,398)
Number of families with income $50k - 60k:
Stilwell:
13.3% (58)
State:
9.9% (6,556)
Number of families with income $60k - 75k:
Stilwell:
6.1% (26)
State:
10.8% (7,198)
Number of families with income $75k - 100k:
Stilwell:
5.3% (23)
Oklahoma:
12.8% (8,500)
Number of families with income $100k - 125k:
Stilwell:
2.5% (11)
State:
10.6% (7,043)
Number of families with income $125k - 150k:
Stilwell:
2.3% (10)
State:
6.5% (4,331)
Median non-family income in Stilwell in 2022:
Stilwell:
$13,419
Oklahoma:
$30,288
Change in median non-family income between 2000 and 2022:: -4.8%
Stilwell, Oklahoma:
-4.8%
State:
+92.2%
Median per capita income in Stilwell in 2022:
Stilwell:
$14,961
Oklahoma:
$25,549
Change in median per capita income between 2000 and 2022:
Stilwell, Oklahoma:
+78.6%
Oklahoma:
+118.7%
Income statistics for Multirace residents
Median household income in Stilwell, OK in 2022:
Stilwell:
$22,436
State:
$53,626
Change in median household income between 2000 and 2022:
Stilwell, Oklahoma:
+5.1%
State:
+81.7%
Number of households with income < $10k:
Stilwell:
7.2% (14)
State:
6.8% (11,975)
Number of households with income $10k - 20k:
Stilwell:
36.4% (71)
State:
8.9% (15,797)
Number of households with income $20k - 30k:
Stilwell:
29.2% (57)
State:
10.2% (18,071)
Number of households with income $30k - 40k:
Stilwell:
7.7% (15)
Oklahoma:
11.0% (19,477)
Number of households with income $40k - 50k:
Stilwell:
13.3% (26)
State:
9.3% (16,501)
Number of households with income $50k - 60k:
Stilwell:
6.2% (12)
State:
8.9% (15,635)
Number of households with income $60k - 75k:
Stilwell:
0.0% (0)
Oklahoma:
10.9% (19,250)
Number of households with income $75k - 100k:
Stilwell:
0.0% (0)
State:
11.5% (20,279)
Number of households with income $100k - 125k:
Stilwell:
0.0% (0)
Oklahoma:
8.0% (14,067)
Number of households with income $125k - 150k:
Stilwell:
0.0% (0)
Oklahoma:
4.9% (8,612)
Number of households with income $150k - 200k:
Stilwell:
0.0% (0)
Oklahoma:
5.0% (8,897)
Number of households with income > $200k:
Stilwell:
0.0% (0)
State:
4.5% (7,970)
Aggregate household income in Stilwell in 2022: $4,902,077
Median family income in Stilwell in 2022:
Stilwell:
$25,041
State:
$62,946
Number of families with income $10k - 20k:
Stilwell:
27.1% (37)
Oklahoma:
6.9% (8,220)
Number of families with income $20k - 30k:
Stilwell:
38.4% (52)
State:
7.7% (9,202)
Number of families with income $30k - 40k:
Stilwell:
6.2% (8)
State:
10.8% (12,890)
Number of families with income $40k - 50k:
Stilwell:
20.3% (27)
Oklahoma:
9.6% (11,468)
Number of families with income $50k - 60k:
Stilwell:
8.1% (11)
State:
7.7% (9,220)
Median non-family income in Stilwell in 2022:
Stilwell:
$13,383
State:
$34,773
Change in median non-family income between 2000 and 2022:: -35.0%
Stilwell, Oklahoma:
-35.0%
State:
+103.1%
Median per capita income in Stilwell in 2022:
Stilwell:
$11,372
State:
$23,085
Change in median per capita income between 2000 and 2022:
Stilwell, Oklahoma:
+43.5%
State:
+93.8%
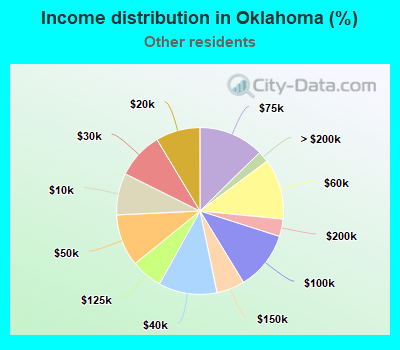
Income statistics for other residents
Number of households with income < $10k:
Stilwell:
45.0% (27)
State:
8.1% (3,420)
Number of households with income $10k - 20k:
Stilwell:
0.0% (0)
State:
8.6% (3,635)
Number of households with income $20k - 30k:
Stilwell:
0.0% (0)
State:
9.0% (3,808)
Number of households with income $30k - 40k:
Stilwell:
0.0% (0)
Oklahoma:
11.4% (4,791)
Number of households with income $40k - 50k:
Stilwell:
18.3% (11)
Oklahoma:
10.1% (4,256)
Number of households with income $50k - 60k:
Stilwell:
0.0% (0)
State:
11.7% (4,946)
Number of households with income $60k - 75k:
Stilwell:
5.0% (3)
State:
12.7% (5,342)
Number of households with income $75k - 100k:
Stilwell:
13.3% (8)
State:
11.4% (4,792)
Number of households with income $100k - 125k:
Stilwell:
18.3% (11)
State:
6.1% (2,568)
Number of households with income $125k - 150k:
Stilwell:
0.0% (0)
State:
5.4% (2,298)
Number of households with income $150k - 200k:
Stilwell:
0.0% (0)
State:
3.4% (1,427)
Number of households with income > $200k:
Stilwell:
0.0% (0)
State:
2.2% (918)
Aggregate household income in Stilwell in 2022: $2,755,439
Median family income in Stilwell in 2022:
Stilwell:
$79,390
State:
$55,625
Number of families with income $30k - 40k:
Stilwell:
8.0% (3)
State:
11.1% (3,618)
Number of families with income $40k - 50k:
Stilwell:
38.1% (13)
State:
11.6% (3,768)
Number of families with income $75k - 100k:
Stilwell:
24.0% (8)
State:
11.5% (3,726)
Number of families with income $100k - 125k:
Stilwell:
29.9% (10)
State:
6.3% (2,046)
Median per capita income in Stilwell in 2022:
Stilwell:
$18,418
State:
$21,007
Change in median per capita income between 2000 and 2022:
Stilwell, Oklahoma:
+69.8%
State:
+119.2%
Discuss Stilwell, Oklahoma (OK) on our hugely popular Oklahoma forum.