The median household income in Stinson Beach, CA in 2022 was $71,363, which was 28.3% less than the median annual income of $91,551 across the entire state of California. Compared to the median income of $87,679 in 2000 this represents a decrease of 22.9%. The per capita income in 2022 was $62,264, which means a constant level compared to 2000 when it was $62,452.
Whole page based on the data from 2000 / 2022 when the population of Stinson Beach, California was 751 / 365
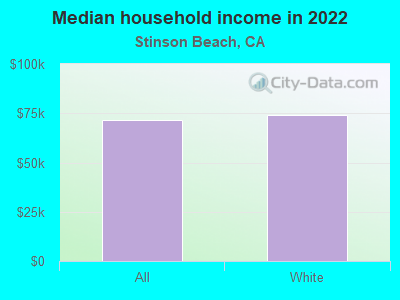
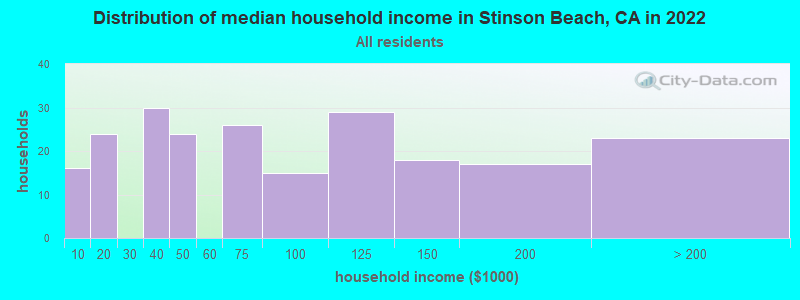
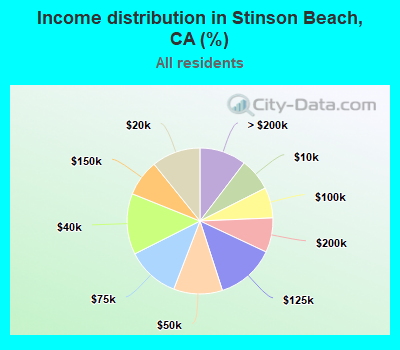
Income statistics for all residents
Median household income in Stinson Beach, CA in 2022:
Stinson Beach:
$71,364
State:
$91,551
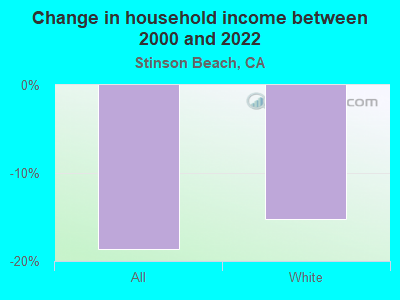
Change in median household income between 2000 and 2022:: -18.6%
Stinson Beach, California:
-18.6%
State:
+92.8%
Number of households with income < $10k:
Stinson Beach:
7.2% (16)
State:
4.8% (654,370)
Number of households with income $10k - 20k:
Stinson Beach:
10.8% (24)
State:
5.8% (789,493)
Number of households with income $20k - 30k:
Stinson Beach:
0.0% (0)
California:
5.7% (778,318)
Number of households with income $30k - 40k:
Stinson Beach:
13.5% (30)
State:
5.8% (783,170)
Number of households with income $40k - 50k:
Stinson Beach:
10.8% (24)
State:
5.8% (781,352)
Number of households with income $50k - 60k:
Stinson Beach:
0.0% (0)
State:
5.6% (760,175)
Number of households with income $60k - 75k:
Stinson Beach:
11.7% (26)
State:
8.2% (1,104,699)
Number of households with income $75k - 100k:
Stinson Beach:
6.8% (15)
California:
12.0% (1,627,633)
Number of households with income $100k - 125k:
Stinson Beach:
13.1% (29)
California:
10.0% (1,358,619)
Number of households with income $125k - 150k:
Stinson Beach:
8.1% (18)
State:
7.6% (1,027,455)
Number of households with income $150k - 200k:
Stinson Beach:
7.7% (17)
State:
10.6% (1,439,811)
Number of households with income > $200k:
Stinson Beach:
10.4% (23)
State:
18.0% (2,445,491)
Aggregate household income in Stinson Beach in 2022: $22,604,284
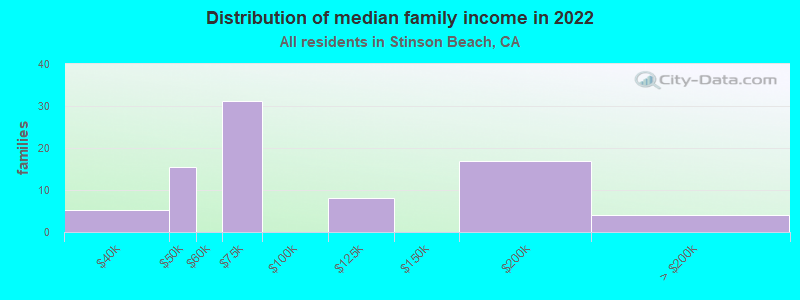
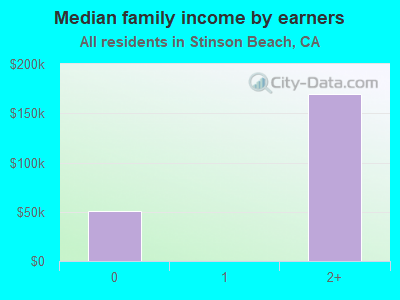
Median family income in Stinson Beach in 2022:
Stinson Beach:
$75,784
California:
$104,823
Number of families with income $30k - 40k:
Stinson Beach:
6.6% (5)
State:
5.2% (478,213)
Number of families with income $40k - 50k:
Stinson Beach:
19.0% (15)
State:
5.6% (511,647)
Number of families with income $60k - 75k:
Stinson Beach:
38.4% (31)
State:
8.0% (731,094)
Number of families with income $100k - 125k:
Stinson Beach:
10.1% (8)
California:
10.5% (959,600)
Number of families with income $150k - 200k:
Stinson Beach:
21.0% (17)
State:
11.9% (1,087,239)
Number of families with income > $200k:
Stinson Beach:
4.9% (4)
California:
21.5% (1,963,769)
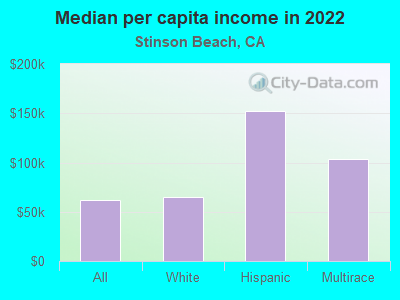
Median per capita income in Stinson Beach in 2022:
Stinson Beach:
$62,265
State:
$46,661
Change in median per capita income between 2000 and 2022:: -0.3%
Stinson Beach, California:
-0.3%
State:
+105.5%
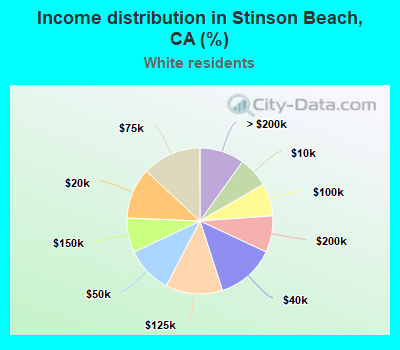
Income statistics for White residents
Median household income in Stinson Beach, CA in 2022:
Stinson Beach:
$74,098
State:
$100,917
Change in median household income between 2000 and 2022:: -15.2%
Stinson Beach, California:
-15.2%
State:
+96.8%
Number of households with income < $10k:
Stinson Beach:
6.8% (15)
California:
4.4% (284,109)
Number of households with income $10k - 20k:
Stinson Beach:
11.3% (25)
State:
5.3% (340,330)
Number of households with income $20k - 30k:
Stinson Beach:
0.0% (0)
California:
5.3% (343,145)
Number of households with income $30k - 40k:
Stinson Beach:
13.1% (29)
State:
5.1% (330,146)
Number of households with income $40k - 50k:
Stinson Beach:
10.4% (23)
California:
5.2% (335,310)
Number of households with income $50k - 60k:
Stinson Beach:
0.0% (0)
California:
5.1% (326,299)
Number of households with income $60k - 75k:
Stinson Beach:
13.1% (29)
State:
7.6% (487,640)
Number of households with income $75k - 100k:
Stinson Beach:
7.2% (16)
State:
11.5% (736,578)
Number of households with income $100k - 125k:
Stinson Beach:
12.6% (28)
State:
10.1% (648,782)
Number of households with income $125k - 150k:
Stinson Beach:
7.7% (17)
State:
7.8% (499,671)
Number of households with income $150k - 200k:
Stinson Beach:
8.1% (18)
California:
11.4% (729,603)
Number of households with income > $200k:
Stinson Beach:
9.9% (22)
State:
21.2% (1,364,246)
Aggregate household income in Stinson Beach in 2022: $22,291,532
Median family income in Stinson Beach in 2022:
Stinson Beach:
$77,896
State:
$125,379
Number of families with income $30k - 40k:
Stinson Beach:
4.7% (4)
State:
3.9% (152,947)
Number of families with income $40k - 50k:
Stinson Beach:
19.0% (16)
California:
4.3% (169,197)
Number of families with income $60k - 75k:
Stinson Beach:
43.0% (37)
California:
7.0% (274,752)
Number of families with income $100k - 125k:
Stinson Beach:
9.1% (8)
State:
10.7% (423,630)
Number of families with income $150k - 200k:
Stinson Beach:
19.8% (17)
State:
13.5% (532,693)
Number of families with income > $200k:
Stinson Beach:
4.5% (4)
State:
27.6% (1,086,948)
Median per capita income in Stinson Beach in 2022:
Stinson Beach:
$65,338
State:
$61,706
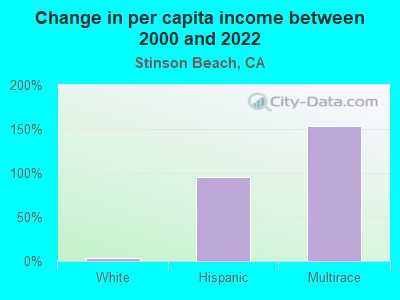
Change in median per capita income between 2000 and 2022:
Stinson Beach, California:
+3.0%
California:
+122.7%
Income statistics for Hispanic or Latino residents
Number of households with income < $10k:
Stinson Beach:
0.0% (0)
State:
4.3% (183,294)
Number of households with income $10k - 20k:
Stinson Beach:
100.0% (30)
California:
6.0% (253,903)
Number of households with income $20k - 30k:
Stinson Beach:
0.0% (0)
State:
6.8% (286,386)
Number of households with income $30k - 40k:
Stinson Beach:
0.0% (0)
State:
7.4% (313,728)
Number of households with income $40k - 50k:
Stinson Beach:
0.0% (0)
State:
7.4% (313,199)
Number of households with income $50k - 60k:
Stinson Beach:
0.0% (0)
State:
7.2% (305,366)
Number of households with income $60k - 75k:
Stinson Beach:
0.0% (0)
State:
10.3% (434,937)
Number of households with income $75k - 100k:
Stinson Beach:
0.0% (0)
California:
14.4% (607,302)
Number of households with income $100k - 125k:
Stinson Beach:
0.0% (0)
State:
10.6% (447,424)
Number of households with income $125k - 150k:
Stinson Beach:
0.0% (0)
State:
7.5% (316,022)
Number of households with income $150k - 200k:
Stinson Beach:
0.0% (0)
State:
9.2% (386,269)
Number of households with income > $200k:
Stinson Beach:
0.0% (0)
State:
8.8% (372,651)
Aggregate household income in Stinson Beach in 2022: $4,023,337
Median per capita income in Stinson Beach in 2022:
Stinson Beach:
$152,445
State:
$27,240
Change in median per capita income between 2000 and 2022:
Stinson Beach, California:
+96.5%
California:
+133.3%
Income statistics for Multirace residents
Median per capita income in Stinson Beach in 2022:
Stinson Beach:
$103,109
State:
$32,124
Discuss Stinson Beach, California (CA) on our hugely popular California forum.