The median household income in Sturbridge, MA in 2022 was $120,216, which was 21.4% greater than the median annual income of $94,488 across the entire state of Massachusetts. Compared to the median income of $56,806 in 2000 this represents an increase of 52.7%. The per capita income in 2022 was $55,994, which means an increase of 56.1% compared to 2000 when it was $24,596.
Whole page based on the data from 2000 / 2022 when the population of Sturbridge, Massachusetts was 2,047 / 2,232
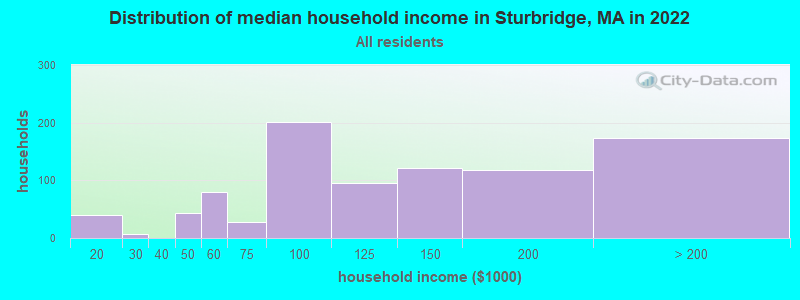
Income statistics for all residents
Median household income in Sturbridge, MA in 2022:
Sturbridge:
$120,217
State:
$94,488
Change in median household income between 2000 and 2022:
Sturbridge, Massachusetts:
+111.6%
State:
+87.1%
Number of households with income < $10k:
Sturbridge:
0.0% (0)
Massachusetts:
5.2% (146,170)
Number of households with income $10k - 20k:
Sturbridge:
4.4% (40)
State:
6.4% (180,001)
Number of households with income $20k - 30k:
Sturbridge:
0.8% (7)
State:
5.6% (156,667)
Number of households with income $30k - 40k:
Sturbridge:
0.0% (0)
State:
5.6% (157,168)
Number of households with income $40k - 50k:
Sturbridge:
4.8% (44)
State:
5.4% (151,455)
Number of households with income $50k - 60k:
Sturbridge:
8.8% (80)
State:
5.1% (142,726)
Number of households with income $60k - 75k:
Sturbridge:
3.1% (28)
Massachusetts:
7.6% (212,203)
Number of households with income $75k - 100k:
Sturbridge:
22.1% (201)
Massachusetts:
11.3% (317,064)
Number of households with income $100k - 125k:
Sturbridge:
10.5% (96)
State:
9.7% (270,603)
Number of households with income $125k - 150k:
Sturbridge:
13.4% (122)
Massachusetts:
8.0% (223,140)
Number of households with income $150k - 200k:
Sturbridge:
13.0% (118)
State:
11.0% (308,695)
Number of households with income > $200k:
Sturbridge:
19.1% (174)
State:
19.0% (531,884)
Aggregate household income in Sturbridge in 2022: $130,309,870
Median family income in Sturbridge in 2022:
Sturbridge:
$132,913
Massachusetts:
$120,263
Number of families with income $10k - 20k:
Sturbridge:
1.7% (11)
State:
2.9% (50,542)
Number of families with income $40k - 50k:
Sturbridge:
2.5% (16)
State:
4.5% (77,656)
Number of families with income $50k - 60k:
Sturbridge:
3.9% (26)
State:
4.5% (77,928)
Number of families with income $60k - 75k:
Sturbridge:
2.6% (17)
State:
7.0% (120,295)
Number of families with income $75k - 100k:
Sturbridge:
26.7% (177)
State:
11.1% (192,172)
Number of families with income $100k - 125k:
Sturbridge:
12.6% (83)
State:
10.6% (182,105)
Number of families with income $125k - 150k:
Sturbridge:
9.2% (61)
State:
9.3% (159,566)
Number of families with income $150k - 200k:
Sturbridge:
14.5% (96)
State:
13.4% (231,410)
Number of families with income > $200k:
Sturbridge:
26.3% (174)
State:
25.4% (438,378)
Median non-family income in Sturbridge in 2022:
Sturbridge:
$52,268
Massachusetts:
$55,979
Change in median non-family income between 2000 and 2022:
Sturbridge, Massachusetts:
+58.1%
Massachusetts:
+88.0%
Median per capita income in Sturbridge in 2022:
Sturbridge:
$55,994
Massachusetts:
$54,025
Change in median per capita income between 2000 and 2022:
Sturbridge, Massachusetts:
+127.7%
Massachusetts:
+108.2%
Income statistics for White residents
Median household income in Sturbridge, MA in 2022:
Sturbridge:
$123,196
State:
$101,391
Change in median household income between 2000 and 2022:
Sturbridge, Massachusetts:
+120.1%
Massachusetts:
+93.3%
Number of households with income < $10k:
Sturbridge:
0.0% (0)
State:
4.4% (91,120)
Number of households with income $10k - 20k:
Sturbridge:
4.5% (38)
Massachusetts:
5.9% (122,055)
Number of households with income $20k - 30k:
Sturbridge:
0.8% (7)
Massachusetts:
5.1% (105,311)
Number of households with income $30k - 40k:
Sturbridge:
0.0% (0)
State:
5.3% (110,239)
Number of households with income $40k - 50k:
Sturbridge:
5.1% (43)
State:
5.0% (104,636)
Number of households with income $50k - 60k:
Sturbridge:
8.6% (72)
State:
4.8% (99,486)
Number of households with income $60k - 75k:
Sturbridge:
3.2% (27)
State:
7.5% (155,124)
Number of households with income $75k - 100k:
Sturbridge:
22.8% (191)
State:
11.4% (236,252)
Number of households with income $100k - 125k:
Sturbridge:
10.4% (87)
State:
9.9% (204,731)
Number of households with income $125k - 150k:
Sturbridge:
14.1% (118)
State:
8.5% (175,324)
Number of households with income $150k - 200k:
Sturbridge:
12.6% (106)
State:
11.7% (242,980)
Number of households with income > $200k:
Sturbridge:
17.9% (150)
State:
20.5% (425,966)
Aggregate household income in Sturbridge in 2022: $118,763,636
Median family income in Sturbridge in 2022:
Sturbridge:
$124,104
State:
$133,153
Number of families with income $10k - 20k:
Sturbridge:
1.6% (9)
State:
2.1% (26,403)
Number of families with income $40k - 50k:
Sturbridge:
2.7% (16)
State:
3.8% (46,908)
Number of families with income $50k - 60k:
Sturbridge:
3.5% (21)
Massachusetts:
3.8% (46,476)
Number of families with income $60k - 75k:
Sturbridge:
2.8% (17)
State:
6.4% (79,040)
Number of families with income $75k - 100k:
Sturbridge:
28.1% (167)
Massachusetts:
11.1% (137,395)
Number of families with income $100k - 125k:
Sturbridge:
12.4% (74)
State:
11.1% (136,771)
Number of families with income $125k - 150k:
Sturbridge:
9.8% (58)
Massachusetts:
10.0% (123,709)
Number of families with income $150k - 200k:
Sturbridge:
14.1% (84)
Massachusetts:
14.7% (181,602)
Number of families with income > $200k:
Sturbridge:
25.2% (150)
State:
28.5% (351,887)
Median non-family income in Sturbridge in 2022:
Sturbridge:
$53,567
State:
$59,323
Change in median non-family income between 2000 and 2022:
Sturbridge, Massachusetts:
+62.0%
State:
+94.3%
Median per capita income in Sturbridge in 2022:
Sturbridge:
$58,087
State:
$60,804
Change in median per capita income between 2000 and 2022:
Sturbridge, Massachusetts:
+136.8%
State:
+118.7%
Income statistics for Black or African American residents
Number of households with income < $10k:
Sturbridge:
0.0% (0)
State:
9.1% (15,797)
Number of households with income $10k - 20k:
Sturbridge:
0.0% (0)
State:
9.4% (16,267)
Number of households with income $20k - 30k:
Sturbridge:
0.0% (0)
State:
7.8% (13,520)
Number of households with income $30k - 40k:
Sturbridge:
0.0% (0)
Massachusetts:
8.3% (14,412)
Number of households with income $40k - 50k:
Sturbridge:
0.0% (0)
Massachusetts:
7.9% (13,790)
Number of households with income $50k - 60k:
Sturbridge:
0.0% (0)
Massachusetts:
5.8% (10,041)
Number of households with income $60k - 75k:
Sturbridge:
0.0% (0)
State:
8.5% (14,822)
Number of households with income $75k - 100k:
Sturbridge:
0.0% (0)
State:
11.0% (19,122)
Number of households with income $100k - 125k:
Sturbridge:
53.3% (8)
State:
8.4% (14,575)
Number of households with income $125k - 150k:
Sturbridge:
0.0% (0)
State:
6.0% (10,429)
Number of households with income $150k - 200k:
Sturbridge:
46.7% (7)
Massachusetts:
7.2% (12,539)
Number of households with income > $200k:
Sturbridge:
0.0% (0)
State:
10.5% (18,185)
Median per capita income in Sturbridge in 2022:
Sturbridge:
$72,831
State:
$33,524
Income statistics for Hispanic or Latino residents
Number of households with income < $10k:
Sturbridge:
0.0% (0)
State:
8.8% (25,307)
Number of households with income $10k - 20k:
Sturbridge:
0.0% (0)
State:
10.0% (28,653)
Number of households with income $20k - 30k:
Sturbridge:
0.0% (0)
Massachusetts:
8.8% (25,189)
Number of households with income $30k - 40k:
Sturbridge:
0.0% (0)
State:
7.2% (20,822)
Number of households with income $40k - 50k:
Sturbridge:
0.0% (0)
State:
7.2% (20,817)
Number of households with income $50k - 60k:
Sturbridge:
0.0% (0)
Massachusetts:
6.5% (18,748)
Number of households with income $60k - 75k:
Sturbridge:
0.0% (0)
State:
8.8% (25,390)
Number of households with income $75k - 100k:
Sturbridge:
0.0% (0)
State:
12.0% (34,488)
Number of households with income $100k - 125k:
Sturbridge:
0.0% (0)
Massachusetts:
8.6% (24,599)
Number of households with income $125k - 150k:
Sturbridge:
0.0% (0)
State:
6.2% (17,743)
Number of households with income $150k - 200k:
Sturbridge:
0.0% (0)
State:
7.3% (21,017)
Number of households with income > $200k:
Sturbridge:
100.0% (16)
State:
8.6% (24,606)
Aggregate household income in Sturbridge in 2022: $17,627,461
Median per capita income in Sturbridge in 2022:
Sturbridge:
$64,901
State:
$28,993
Change in median per capita income between 2000 and 2022:: -0.2%
Sturbridge, Massachusetts:
-0.2%
State:
+142.4%
Income statistics for Multirace residents
Median per capita income in Sturbridge in 2022:
Sturbridge:
$2,706
State:
$34,029
Change in median per capita income between 2000 and 2022:: -93.0%
Sturbridge, Massachusetts:
-93.0%
State:
+132.1%
Discuss Sturbridge, Massachusetts (MA) on our hugely popular Massachusetts forum.