Thompson, Connecticut (CT) income map, earnings map, and wages data
The median household income in Thompson, CT in 2022 was $77,948, which was 13.4% less than the median annual income of $88,429 across the entire state of Connecticut. Compared to the median income of $46,065 in 2000 this represents an increase of 40.9%. The per capita income in 2022 was $38,420, which means an increase of 45.3% compared to 2000 when it was $21,003.
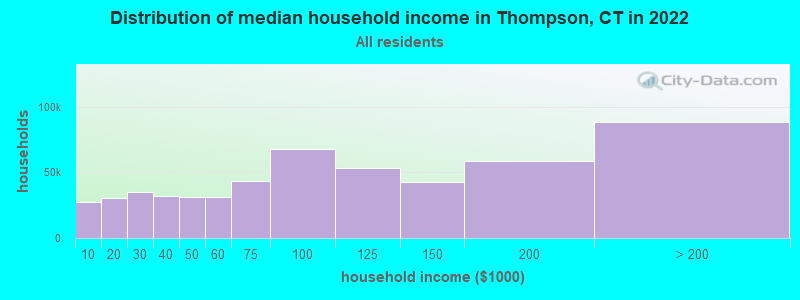
Income statistics for all residents
Median household income in Thompson, CT in 2022:| Thompson: | $77,948 |
| State: | $88,429 |
Change in median household income between 2000 and 2022:| Thompson, Connecticut: | +69.2% |
| State: | +64.0% |
Number of households with income < $10k:| Thompson: | 5.2% (31,750) |
| Connecticut: | 5.1% (72,746) |
Number of households with income $10k - 20k:| Thompson: | 5.8% (35,803) |
| Connecticut: | 5.7% (81,643) |
Number of households with income $20k - 30k:| Thompson: | 6.6% (40,526) |
| State: | 6.5% (92,844) |
Number of households with income $30k - 40k:| Thompson: | 5.9% (36,369) |
| Connecticut: | 5.9% (83,934) |
Number of households with income $40k - 50k:| Thompson: | 5.9% (36,136) |
| State: | 5.8% (83,025) |
Number of households with income $50k - 60k:| Thompson: | 5.8% (35,433) |
| State: | 5.7% (81,788) |
Number of households with income $60k - 75k:| Thompson: | 8.1% (49,646) |
| State: | 8.1% (115,651) |
Number of households with income $75k - 100k:| Thompson: | 12.6% (77,536) |
| Connecticut: | 12.6% (180,173) |
Number of households with income $100k - 125k:| Thompson: | 9.8% (60,361) |
| State: | 9.9% (141,231) |
Number of households with income $125k - 150k:| Thompson: | 7.8% (48,204) |
| State: | 7.9% (112,826) |
Number of households with income $150k - 200k:| Thompson: | 10.7% (65,940) |
| State: | 10.8% (154,641) |
Number of households with income > $200k:| Thompson: | 16.0% (98,510) |
| Connecticut: | 16.3% (233,133) |
Aggregate household income in Thompson in 2022: $7,861,607,028
Median family income in Thompson in 2022:| Thompson: | $94,815 |
| State: | $115,183 |
Median non-family income in Thompson in 2022:| Thompson: | $37,976 |
| State: | $50,964 |
Change in median non-family income between 2000 and 2022:| Thompson, Connecticut: | +71.5% |
| Connecticut: | +65.1% |
Median per capita income in Thompson in 2022:| Thompson: | $38,421 |
| State: | $51,581 |
Change in median per capita income between 2000 and 2022:| Thompson, Connecticut: | +82.9% |
| State: | +79.3% |
Income statistics for White residents
Median household income in Thompson, CT in 2022:| Thompson: | $77,709 |
| State: | $96,890 |
Change in median household income between 2000 and 2022:| Thompson, Connecticut: | +69.4% |
| State: | +68.5% |
Number of households with income < $10k:| Thompson: | 4.2% (16,997) |
| State: | 4.2% (42,265) |
Number of households with income $10k - 20k:| Thompson: | 4.9% (19,541) |
| State: | 4.8% (48,323) |
Number of households with income $20k - 30k:| Thompson: | 5.8% (23,239) |
| State: | 5.7% (57,716) |
Number of households with income $30k - 40k:| Thompson: | 5.4% (21,512) |
| State: | 5.3% (53,827) |
Number of households with income $40k - 50k:| Thompson: | 5.3% (21,422) |
| Connecticut: | 5.3% (53,301) |
Number of households with income $50k - 60k:| Thompson: | 5.6% (22,294) |
| State: | 5.5% (55,690) |
Number of households with income $60k - 75k:| Thompson: | 7.9% (31,860) |
| State: | 8.0% (80,329) |
Number of households with income $75k - 100k:| Thompson: | 12.7% (51,051) |
| Connecticut: | 12.7% (128,070) |
Number of households with income $100k - 125k:| Thompson: | 10.0% (40,087) |
| State: | 10.0% (101,210) |
Number of households with income $125k - 150k:| Thompson: | 8.0% (32,183) |
| State: | 8.0% (81,250) |
Number of households with income $150k - 200k:| Thompson: | 11.8% (47,322) |
| State: | 11.8% (119,527) |
Number of households with income > $200k:| Thompson: | 18.4% (74,081) |
| State: | 18.6% (187,875) |
Aggregate household income in Thompson in 2022: $5,837,409,859
Median family income in Thompson in 2022:| Thompson: | $97,113 |
| State: | $128,955 |
Number of families with income < $10k:| Thompson: | 3.2% (44) |
| State: | 1.9% (11,537) |
Number of families with income $10k - 20k:| Thompson: | 6.0% (83) |
| Connecticut: | 1.8% (11,289) |
Number of families with income $20k - 30k:| Thompson: | 6.9% (95) |
| Connecticut: | 3.0% (18,506) |
Number of families with income $30k - 40k:| Thompson: | 6.4% (89) |
| State: | 2.9% (18,160) |
Number of families with income $40k - 50k:| Thompson: | 9.0% (125) |
| State: | 3.9% (24,550) |
Number of families with income $50k - 60k:| Thompson: | 9.4% (131) |
| Connecticut: | 4.3% (26,723) |
Number of families with income $60k - 75k:| Thompson: | 11.5% (159) |
| Connecticut: | 7.1% (44,075) |
Number of families with income $75k - 100k:| Thompson: | 18.5% (256) |
| State: | 12.5% (77,679) |
Number of families with income $100k - 125k:| Thompson: | 9.8% (135) |
| State: | 11.1% (69,086) |
Number of families with income $125k - 150k:| Thompson: | 4.2% (57) |
| State: | 9.6% (59,616) |
Number of families with income $150k - 200k:| Thompson: | 10.2% (141) |
| State: | 15.7% (97,890) |
Number of families with income > $200k:| Thompson: | 4.8% (67) |
| State: | 26.3% (163,417) |
Median non-family income in Thompson in 2022:| Thompson: | $37,991 |
| State: | $54,067 |
Change in median non-family income between 2000 and 2022:| Thompson, Connecticut: | +73.7% |
| State: | +68.7% |
Median per capita income in Thompson in 2022:| Thompson: | $40,479 |
| State: | $59,916 |
Change in median per capita income between 2000 and 2022:| Thompson, Connecticut: | +92.1% |
| Connecticut: | +90.2% |
Income statistics for Black or African American residents
Median household income in Thompson, CT in 2022:| Thompson: | $94,534 |
| State: | $61,803 |
Change in median household income between 2000 and 2022:| Thompson, Connecticut: | +60.9% |
| State: | +76.1% |
Number of households with income < $10k:| Thompson: | 6.8% (15,889) |
| State: | 6.8% (9,494) |
Number of households with income $10k - 20k:| Thompson: | 7.9% (18,414) |
| Connecticut: | 7.9% (11,003) |
Number of households with income $20k - 30k:| Thompson: | 10.8% (25,179) |
| State: | 10.8% (15,045) |
Number of households with income $30k - 40k:| Thompson: | 8.2% (19,248) |
| State: | 8.2% (11,501) |
Number of households with income $40k - 50k:| Thompson: | 7.4% (17,432) |
| Connecticut: | 7.4% (10,416) |
Number of households with income $50k - 60k:| Thompson: | 7.5% (17,630) |
| Connecticut: | 7.5% (10,534) |
Number of households with income $60k - 75k:| Thompson: | 8.0% (18,818) |
| State: | 8.0% (11,244) |
Number of households with income $75k - 100k:| Thompson: | 9.6% (22,376) |
| Connecticut: | 9.6% (13,370) |
Number of households with income $100k - 125k:| Thompson: | 10.2% (23,839) |
| State: | 10.2% (14,244) |
Number of households with income $125k - 150k:| Thompson: | 8.0% (18,821) |
| Connecticut: | 8.0% (11,246) |
Number of households with income $150k - 200k:| Thompson: | 7.7% (17,953) |
| Connecticut: | 7.7% (10,727) |
Number of households with income > $200k:| Thompson: | 7.9% (18,554) |
| State: | 7.9% (11,086) |
Aggregate household income in Thompson in 2022: $3,573,898
Median family income in Thompson in 2022:| Thompson: | $128,557 |
| Connecticut: | $87,228 |
Median per capita income in Thompson in 2022:| Thompson: | $25,408 |
| State: | $36,289 |
Change in median per capita income between 2000 and 2022:| Thompson, Connecticut: | +115.2% |
| Connecticut: | +117.5% |
Income statistics for Asian residents
Median household income in Thompson, CT in 2022:| Thompson: | $73,005 |
| State: | $110,568 |
Change in median household income between 2000 and 2022:| Thompson, Connecticut: | +110.1% |
| Connecticut: | +79.5% |
Number of households with income < $10k:| Thompson: | 7.1% (2,395) |
| State: | 7.1% (4,245) |
Number of households with income $10k - 20k:| Thompson: | 3.5% (1,177) |
| Connecticut: | 3.5% (2,087) |
Number of households with income $20k - 30k:| Thompson: | 4.1% (1,390) |
| State: | 4.1% (2,464) |
Number of households with income $30k - 40k:| Thompson: | 4.1% (1,398) |
| State: | 4.1% (2,478) |
Number of households with income $40k - 50k:| Thompson: | 3.3% (1,119) |
| State: | 3.3% (1,983) |
Number of households with income $50k - 60k:| Thompson: | 3.9% (1,314) |
| State: | 3.9% (2,328) |
Number of households with income $60k - 75k:| Thompson: | 7.0% (2,386) |
| State: | 7.0% (4,228) |
Number of households with income $75k - 100k:| Thompson: | 11.5% (3,899) |
| Connecticut: | 11.5% (6,911) |
Number of households with income $100k - 125k:| Thompson: | 10.2% (3,457) |
| State: | 10.2% (6,127) |
Number of households with income $125k - 150k:| Thompson: | 8.5% (2,866) |
| State: | 8.5% (5,079) |
Number of households with income $150k - 200k:| Thompson: | 12.4% (4,195) |
| Connecticut: | 12.4% (7,434) |
Number of households with income > $200k:| Thompson: | 24.4% (8,272) |
| State: | 24.4% (14,661) |
Aggregate household income in Thompson in 2022: $3,631,990
Median family income in Thompson in 2022:| Thompson: | $264,560 |
| State: | $134,548 |
Number of families with income $125k - 150k:| Thompson: | 100.0% (13) |
| State: | 8.2% (3,588) |
Median non-family income in Thompson in 2022:| Thompson: | $83,898 |
| State: | $63,785 |
Change in median non-family income between 2000 and 2022:| Thompson, Connecticut: | +148.6% |
| State: | +77.9% |
Median per capita income in Thompson in 2022:| Thompson: | $81,648 |
| State: | $55,295 |
Change in median per capita income between 2000 and 2022:| Thompson, Connecticut: | +103.6% |
| Connecticut: | +97.8% |
Income statistics for Hispanic or Latino residents
Median household income in Thompson, CT in 2022:| Thompson: | $128,302 |
| State: | $60,275 |
Change in median household income between 2000 and 2022:| Thompson, Connecticut: | +67.8% |
| State: | +87.9% |
Number of households with income < $10k:| Thompson: | 8.7% (44,303) |
| State: | 8.7% (18,584) |
Number of households with income $10k - 20k:| Thompson: | 9.1% (45,855) |
| Connecticut: | 9.1% (19,235) |
Number of households with income $20k - 30k:| Thompson: | 8.9% (45,269) |
| State: | 8.9% (18,989) |
Number of households with income $30k - 40k:| Thompson: | 7.5% (38,064) |
| State: | 7.5% (15,967) |
Number of households with income $40k - 50k:| Thompson: | 8.7% (44,022) |
| Connecticut: | 8.7% (18,466) |
Number of households with income $50k - 60k:| Thompson: | 6.9% (35,058) |
| State: | 6.9% (14,706) |
Number of households with income $60k - 75k:| Thompson: | 8.9% (45,027) |
| State: | 8.9% (18,888) |
Number of households with income $75k - 100k:| Thompson: | 13.5% (68,344) |
| Connecticut: | 13.5% (28,669) |
Number of households with income $100k - 125k:| Thompson: | 8.2% (41,561) |
| State: | 8.2% (17,434) |
Number of households with income $125k - 150k:| Thompson: | 6.5% (32,784) |
| Connecticut: | 6.5% (13,752) |
Number of households with income $150k - 200k:| Thompson: | 6.6% (33,647) |
| State: | 6.6% (14,114) |
Number of households with income > $200k:| Thompson: | 6.4% (32,493) |
| Connecticut: | 6.4% (13,630) |
Aggregate household income in Thompson in 2022: $18,489,930
Median family income in Thompson in 2022:| Thompson: | $134,050 |
| Connecticut: | $68,336 |
Number of families with income < $10k:| Thompson: | 4.5% (22) |
| State: | 5.2% (7,456) |
Number of families with income $10k - 20k:| Thompson: | 12.8% (63) |
| State: | 6.0% (8,616) |
Number of families with income $20k - 30k:| Thompson: | 15.1% (75) |
| State: | 8.9% (12,680) |
Number of families with income $30k - 40k:| Thompson: | 10.4% (51) |
| Connecticut: | 8.5% (12,090) |
Number of families with income $40k - 50k:| Thompson: | 12.6% (62) |
| State: | 8.8% (12,624) |
Number of families with income $50k - 60k:| Thompson: | 12.4% (61) |
| State: | 8.4% (11,924) |
Number of families with income $60k - 75k:| Thompson: | 8.7% (43) |
| Connecticut: | 8.9% (12,677) |
Number of families with income $75k - 100k:| Thompson: | 13.4% (66) |
| State: | 14.3% (20,457) |
Number of families with income $100k - 125k:| Thompson: | 4.4% (22) |
| State: | 8.2% (11,720) |
Number of families with income $125k - 150k:| Thompson: | 2.2% (11) |
| Connecticut: | 8.2% (11,729) |
Number of families with income $150k - 200k:| Thompson: | 2.7% (13) |
| Connecticut: | 7.1% (10,096) |
Number of families with income > $200k:| Thompson: | 0.8% (4) |
| State: | 7.4% (10,622) |
Median non-family income in Thompson in 2022:| Thompson: | $23,909 |
| State: | $36,714 |
Change in median non-family income between 2000 and 2022:| Thompson, Connecticut: | +73.9% |
| Connecticut: | +90.0% |
Median per capita income in Thompson in 2022:| Thompson: | $43,746 |
| Connecticut: | $28,507 |
Change in median per capita income between 2000 and 2022:| Thompson, Connecticut: | +80.3% |
| Connecticut: | +117.2% |
Income statistics for American Indian and Alaska Native residents
Median household income in Thompson, CT in 2022:| Thompson: | $38,092 |
| Connecticut: | $41,848 |
Change in median household income between 2000 and 2022:| Thompson, Connecticut: | +12.9% |
| Connecticut: | +12.9% |
Number of households with income < $10k:| Thompson: | 8.4% (95,970) |
| State: | 10.2% (340) |
Number of households with income $10k - 20k:| Thompson: | 9.4% (107,100) |
| State: | 8.5% (283) |
Number of households with income $20k - 30k:| Thompson: | 8.5% (96,874) |
| State: | 9.4% (314) |
Number of households with income $30k - 40k:| Thompson: | 9.1% (103,788) |
| Connecticut: | 10.1% (337) |
Number of households with income $40k - 50k:| Thompson: | 8.3% (95,201) |
| State: | 13.4% (447) |
Number of households with income $50k - 60k:| Thompson: | 7.8% (89,767) |
| State: | 3.1% (104) |
Number of households with income $60k - 75k:| Thompson: | 9.8% (111,890) |
| Connecticut: | 5.6% (188) |
Number of households with income $75k - 100k:| Thompson: | 12.6% (144,433) |
| Connecticut: | 13.4% (447) |
Number of households with income $100k - 125k:| Thompson: | 9.4% (108,007) |
| State: | 9.5% (317) |
Number of households with income $125k - 150k:| Thompson: | 5.6% (64,663) |
| Connecticut: | 3.9% (131) |
Number of households with income $150k - 200k:| Thompson: | 6.0% (68,167) |
| Connecticut: | 6.3% (212) |
Number of households with income > $200k:| Thompson: | 5.2% (59,003) |
| State: | 6.8% (228) |
Aggregate household income in Thompson in 2022: $210,234
Median non-family income in Thompson in 2022:| Thompson: | $75,965 |
| State: | $40,310 |
Change in median non-family income between 2000 and 2022:| Thompson, Connecticut: | +125.1% |
| State: | +125.1% |
Median per capita income in Thompson in 2022:| Thompson: | $24,301 |
| Connecticut: | $25,355 |
Change in median per capita income between 2000 and 2022:| Thompson, Connecticut: | +45.9% |
| State: | +39.4% |
Income statistics for Multirace residents
Median household income in Thompson, CT in 2022:| Thompson: | $113,151 |
| State: | $77,277 |
Change in median household income between 2000 and 2022:| Thompson, Connecticut: | +119.4% |
| State: | +113.6% |
Number of households with income < $10k:| Thompson: | 6.0% (10,626) |
| State: | 6.0% (7,457) |
Number of households with income $10k - 20k:| Thompson: | 8.1% (14,447) |
| State: | 8.1% (10,139) |
Number of households with income $20k - 30k:| Thompson: | 7.0% (12,400) |
| State: | 7.0% (8,702) |
Number of households with income $30k - 40k:| Thompson: | 6.9% (12,178) |
| Connecticut: | 6.9% (8,546) |
Number of households with income $40k - 50k:| Thompson: | 7.0% (12,415) |
| State: | 7.0% (8,712) |
Number of households with income $50k - 60k:| Thompson: | 5.9% (10,446) |
| Connecticut: | 5.9% (7,331) |
Number of households with income $60k - 75k:| Thompson: | 8.5% (15,153) |
| State: | 8.5% (10,634) |
Number of households with income $75k - 100k:| Thompson: | 14.1% (25,079) |
| State: | 14.1% (17,600) |
Number of households with income $100k - 125k:| Thompson: | 9.9% (17,645) |
| State: | 9.9% (12,383) |
Number of households with income $125k - 150k:| Thompson: | 7.2% (12,712) |
| State: | 7.2% (8,921) |
Number of households with income $150k - 200k:| Thompson: | 8.8% (15,563) |
| State: | 8.8% (10,922) |
Number of households with income > $200k:| Thompson: | 10.6% (18,876) |
| Connecticut: | 10.6% (13,247) |
Aggregate household income in Thompson in 2022: $21,415,023
Median family income in Thompson in 2022:| Thompson: | $100,536 |
| Connecticut: | $84,255 |
Number of families with income < $10k:| Thompson: | 5.2% (9) |
| State: | 3.6% (3,027) |
Number of families with income $40k - 50k:| Thompson: | 17.6% (32) |
| Connecticut: | 6.9% (5,792) |
Number of families with income $75k - 100k:| Thompson: | 29.4% (53) |
| Connecticut: | 14.5% (12,236) |
Number of families with income $125k - 150k:| Thompson: | 47.8% (86) |
| Connecticut: | 8.9% (7,503) |
Median per capita income in Thompson in 2022:| Thompson: | $20,660 |
| State: | $32,794 |
Change in median per capita income between 2000 and 2022:| Thompson, Connecticut: | +95.5% |
| Connecticut: | +117.2% |
Income statistics for other residents
Number of households with income < $10k:| Thompson: | 8.4% (8) |
| State: | 9.0% (8,596) |
Number of households with income $10k - 20k:| Thompson: | 10.5% (10) |
| State: | 10.2% (9,773) |
Number of households with income $20k - 30k:| Thompson: | 8.4% (8) |
| Connecticut: | 9.1% (8,691) |
Number of households with income $30k - 40k:| Thompson: | 8.4% (8) |
| Connecticut: | 7.8% (7,447) |
Number of households with income $40k - 50k:| Thompson: | 8.4% (8) |
| State: | 8.2% (7,860) |
Number of households with income $50k - 60k:| Thompson: | 6.3% (6) |
| Connecticut: | 6.0% (5,757) |
Number of households with income $60k - 75k:| Thompson: | 9.5% (9) |
| State: | 9.3% (8,942) |
Number of households with income $75k - 100k:| Thompson: | 13.7% (13) |
| State: | 14.3% (13,700) |
Number of households with income $100k - 125k:| Thompson: | 7.4% (7) |
| State: | 7.2% (6,906) |
Number of households with income $125k - 150k:| Thompson: | 6.3% (6) |
| State: | 6.5% (6,215) |
Number of households with income $150k - 200k:| Thompson: | 6.3% (6) |
| State: | 6.1% (5,865) |
Number of households with income > $200k:| Thompson: | 6.3% (6) |
| State: | 6.3% (6,065) |
Aggregate household income in Thompson in 2022: $12,953,632
Median family income in Thompson in 2022:| Thompson: | $354,886 |
| Connecticut: | $67,610 |
Number of families with income $40k - 50k:| Thompson: | 4.9% (8) |
| State: | 9.1% (6,039) |
Number of families with income $150k - 200k:| Thompson: | 95.1% (150) |
| Connecticut: | 6.6% (4,339) |
Median per capita income in Thompson in 2022:| Thompson: | $161,639 |
| Connecticut: | $29,353 |