Thornton, New Hampshire (NH) income map, earnings map, and wages data
The median household income in Thornton, NH in 2022 was $75,041, which was 19.9% less than the median annual income of $89,992 across the entire state of New Hampshire. Compared to the median income of $38,380 in 2000 this represents an increase of 48.9%. The per capita income in 2022 was $42,018, which means an increase of 56.0% compared to 2000 when it was $18,478.
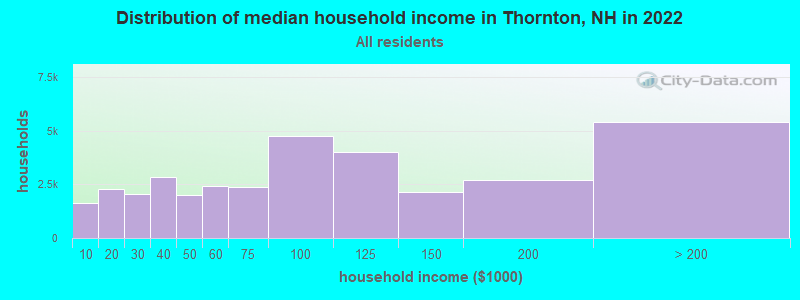
Income statistics for all residents
Median household income in Thornton, NH in 2022:| Thornton: | $75,041 |
| New Hampshire: | $89,992 |
Change in median household income between 2000 and 2022:| Thornton, New Hampshire: | +95.5% |
| State: | +81.9% |
Number of households with income < $10k:| Thornton: | 4.8% (1,649) |
| State: | 3.1% (17,541) |
Number of households with income $10k - 20k:| Thornton: | 6.5% (2,262) |
| New Hampshire: | 5.4% (29,916) |
Number of households with income $20k - 30k:| Thornton: | 5.9% (2,057) |
| New Hampshire: | 5.5% (30,783) |
Number of households with income $30k - 40k:| Thornton: | 8.3% (2,856) |
| State: | 5.9% (32,868) |
Number of households with income $40k - 50k:| Thornton: | 5.8% (1,998) |
| State: | 5.9% (32,728) |
Number of households with income $50k - 60k:| Thornton: | 6.9% (2,403) |
| State: | 6.9% (38,422) |
Number of households with income $60k - 75k:| Thornton: | 6.9% (2,396) |
| New Hampshire: | 9.1% (50,552) |
Number of households with income $75k - 100k:| Thornton: | 13.6% (4,724) |
| State: | 13.1% (73,145) |
Number of households with income $100k - 125k:| Thornton: | 11.6% (4,023) |
| State: | 10.5% (58,593) |
Number of households with income $125k - 150k:| Thornton: | 6.2% (2,159) |
| New Hampshire: | 8.1% (44,878) |
Number of households with income $150k - 200k:| Thornton: | 7.8% (2,691) |
| State: | 11.5% (64,340) |
Number of households with income > $200k:| Thornton: | 15.6% (5,397) |
| State: | 15.0% (83,454) |
Aggregate household income in Thornton in 2022: $89,774,888
Median family income in Thornton in 2022:| Thornton: | $91,269 |
| State: | $112,950 |
Median non-family income in Thornton in 2022:| Thornton: | $51,626 |
| State: | $52,292 |
Change in median non-family income between 2000 and 2022:| Thornton, New Hampshire: | +96.3% |
| New Hampshire: | +80.7% |
Median per capita income in Thornton in 2022:| Thornton: | $42,019 |
| New Hampshire: | $49,281 |
Change in median per capita income between 2000 and 2022:| Thornton, New Hampshire: | +127.4% |
| State: | +106.7% |
Income statistics for White residents
Median household income in Thornton, NH in 2022:| Thornton: | $73,968 |
| State: | $90,839 |
Change in median household income between 2000 and 2022:| Thornton, New Hampshire: | +91.6% |
| State: | +82.8% |
Number of households with income < $10k:| Thornton: | 4.3% (1,340) |
| State: | 3.1% (15,499) |
Number of households with income $10k - 20k:| Thornton: | 6.7% (2,088) |
| New Hampshire: | 5.6% (27,915) |
Number of households with income $20k - 30k:| Thornton: | 6.6% (2,062) |
| New Hampshire: | 5.4% (27,382) |
Number of households with income $30k - 40k:| Thornton: | 8.8% (2,752) |
| State: | 5.9% (29,681) |
Number of households with income $40k - 50k:| Thornton: | 5.7% (1,782) |
| New Hampshire: | 5.7% (28,456) |
Number of households with income $50k - 60k:| Thornton: | 6.9% (2,155) |
| State: | 6.9% (34,641) |
Number of households with income $60k - 75k:| Thornton: | 7.4% (2,322) |
| New Hampshire: | 9.0% (45,144) |
Number of households with income $75k - 100k:| Thornton: | 12.7% (3,976) |
| New Hampshire: | 13.0% (65,259) |
Number of households with income $100k - 125k:| Thornton: | 12.1% (3,782) |
| State: | 10.7% (53,931) |
Number of households with income $125k - 150k:| Thornton: | 6.5% (2,028) |
| New Hampshire: | 8.1% (40,466) |
Number of households with income $150k - 200k:| Thornton: | 7.6% (2,367) |
| New Hampshire: | 11.9% (59,781) |
Number of households with income > $200k:| Thornton: | 14.9% (4,665) |
| New Hampshire: | 14.8% (74,387) |
Aggregate household income in Thornton in 2022: $80,582,251
Median family income in Thornton in 2022:| Thornton: | $89,836 |
| New Hampshire: | $115,125 |
Number of families with income < $10k:| Thornton: | 1.4% (6) |
| New Hampshire: | 1.5% (4,767) |
Number of families with income $10k - 20k:| Thornton: | 7.0% (28) |
| New Hampshire: | 2.1% (6,602) |
Number of families with income $20k - 30k:| Thornton: | 9.6% (37) |
| State: | 2.7% (8,511) |
Number of families with income $30k - 40k:| Thornton: | 10.8% (42) |
| State: | 4.0% (12,696) |
Number of families with income $40k - 50k:| Thornton: | 9.8% (39) |
| State: | 4.3% (13,626) |
Number of families with income $50k - 60k:| Thornton: | 6.2% (24) |
| State: | 5.6% (17,792) |
Number of families with income $60k - 75k:| Thornton: | 13.6% (53) |
| State: | 8.4% (26,945) |
Number of families with income $75k - 100k:| Thornton: | 12.7% (50) |
| State: | 13.8% (44,284) |
Number of families with income $100k - 125k:| Thornton: | 12.8% (50) |
| State: | 12.5% (39,959) |
Number of families with income $125k - 150k:| Thornton: | 4.8% (19) |
| New Hampshire: | 10.3% (33,038) |
Number of families with income $150k - 200k:| Thornton: | 11.2% (44) |
| State: | 15.4% (49,456) |
Median non-family income in Thornton in 2022:| Thornton: | $48,370 |
| State: | $51,861 |
Change in median non-family income between 2000 and 2022:| Thornton, New Hampshire: | +82.6% |
| State: | +79.2% |
Median per capita income in Thornton in 2022:| Thornton: | $42,253 |
| State: | $50,469 |
Change in median per capita income between 2000 and 2022:| Thornton, New Hampshire: | +127.5% |
| State: | +109.2% |
Income statistics for Black or African American residents
Number of households with income < $10k:| Thornton: | 10.1% (1,476,626) |
| State: | 3.4% (202) |
Number of households with income $10k - 20k:| Thornton: | 11.4% (1,674,559) |
| State: | 7.8% (463) |
Number of households with income $20k - 30k:| Thornton: | 9.4% (1,377,757) |
| State: | 6.5% (384) |
Number of households with income $30k - 40k:| Thornton: | 9.5% (1,388,003) |
| New Hampshire: | 9.2% (544) |
Number of households with income $40k - 50k:| Thornton: | 8.5% (1,244,150) |
| State: | 6.7% (394) |
Number of households with income $50k - 60k:| Thornton: | 7.5% (1,099,145) |
| State: | 7.9% (469) |
Number of households with income $60k - 75k:| Thornton: | 9.5% (1,391,342) |
| New Hampshire: | 11.9% (705) |
Number of households with income $75k - 100k:| Thornton: | 11.3% (1,658,513) |
| State: | 12.9% (761) |
Number of households with income $100k - 125k:| Thornton: | 7.6% (1,120,533) |
| New Hampshire: | 11.7% (694) |
Number of households with income $125k - 150k:| Thornton: | 4.9% (713,574) |
| State: | 7.8% (459) |
Number of households with income $150k - 200k:| Thornton: | 5.4% (792,696) |
| New Hampshire: | 7.7% (456) |
Number of households with income > $200k:| Thornton: | 5.1% (742,835) |
| State: | 6.4% (377) |
Median per capita income in Thornton in 2022:| Thornton: | $23,287 |
| State: | $31,675 |
Change in median per capita income between 2000 and 2022:| Thornton, New Hampshire: | +72.5% |
| State: | +85.9% |
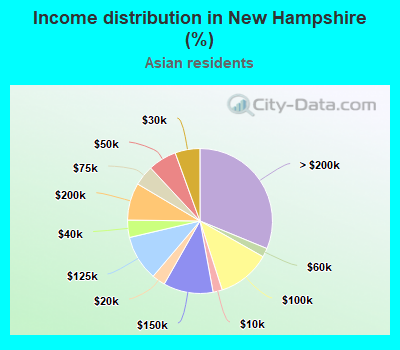
Income statistics for Asian residents
Median household income in Thornton, NH in 2022:| Thornton: | $88,246 |
| New Hampshire: | $126,236 |
Number of households with income < $10k:| Thornton: | 2.1% (102) |
| State: | 2.1% (271) |
Number of households with income $10k - 20k:| Thornton: | 3.0% (148) |
| State: | 3.0% (393) |
Number of households with income $20k - 30k:| Thornton: | 5.5% (275) |
| State: | 5.5% (729) |
Number of households with income $30k - 40k:| Thornton: | 3.9% (192) |
| New Hampshire: | 3.9% (510) |
Number of households with income $40k - 50k:| Thornton: | 6.4% (317) |
| State: | 6.4% (842) |
Number of households with income $50k - 60k:| Thornton: | 2.0% (98) |
| State: | 2.0% (261) |
Number of households with income $60k - 75k:| Thornton: | 4.5% (225) |
| State: | 4.5% (597) |
Number of households with income $75k - 100k:| Thornton: | 11.8% (588) |
| New Hampshire: | 11.8% (1,559) |
Number of households with income $100k - 125k:| Thornton: | 10.1% (503) |
| State: | 10.1% (1,334) |
Number of households with income $125k - 150k:| Thornton: | 11.1% (552) |
| State: | 11.1% (1,463) |
Number of households with income $150k - 200k:| Thornton: | 8.3% (413) |
| State: | 8.3% (1,095) |
Number of households with income > $200k:| Thornton: | 31.2% (1,550) |
| New Hampshire: | 31.2% (4,111) |
Aggregate household income in Thornton in 2022: $3,602,503
Median family income in Thornton in 2022:| Thornton: | $107,447 |
| State: | $138,456 |
Median non-family income in Thornton in 2022:| Thornton: | $59,544 |
| State: | $95,336 |
Median per capita income in Thornton in 2022:| Thornton: | $60,676 |
| State: | $64,014 |
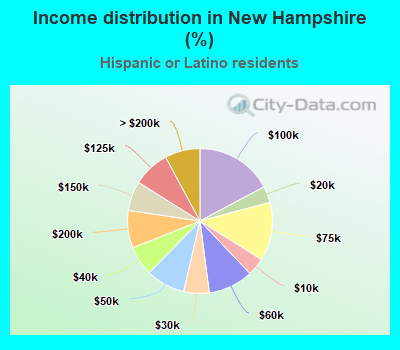
Income statistics for Hispanic or Latino residents
Median household income in Thornton, NH in 2022:| Thornton: | $198,591 |
| State: | $73,813 |
Number of households with income < $10k:| Thornton: | 4.0% (1,312) |
| New Hampshire: | 4.0% (695) |
Number of households with income $10k - 20k:| Thornton: | 3.7% (1,206) |
| New Hampshire: | 3.7% (639) |
Number of households with income $20k - 30k:| Thornton: | 5.7% (1,884) |
| New Hampshire: | 5.7% (998) |
Number of households with income $30k - 40k:| Thornton: | 6.6% (2,173) |
| State: | 6.6% (1,151) |
Number of households with income $40k - 50k:| Thornton: | 8.7% (2,871) |
| New Hampshire: | 8.7% (1,521) |
Number of households with income $50k - 60k:| Thornton: | 10.0% (3,306) |
| State: | 10.0% (1,751) |
Number of households with income $60k - 75k:| Thornton: | 13.1% (4,312) |
| New Hampshire: | 13.1% (2,284) |
Number of households with income $75k - 100k:| Thornton: | 17.2% (5,671) |
| New Hampshire: | 17.2% (3,004) |
Number of households with income $100k - 125k:| Thornton: | 8.2% (2,700) |
| New Hampshire: | 8.2% (1,430) |
Number of households with income $125k - 150k:| Thornton: | 6.6% (2,179) |
| State: | 6.6% (1,154) |
Number of households with income $150k - 200k:| Thornton: | 8.4% (2,760) |
| New Hampshire: | 8.4% (1,462) |
Number of households with income > $200k:| Thornton: | 7.9% (2,588) |
| State: | 7.9% (1,371) |
Aggregate household income in Thornton in 2022: $969,243
Median non-family income in Thornton in 2022:| Thornton: | $399,936 |
| New Hampshire: | $69,407 |
Median per capita income in Thornton in 2022:| Thornton: | $59,314 |
| State: | $32,911 |
Change in median per capita income between 2000 and 2022:| Thornton, New Hampshire: | +122.1% |
| New Hampshire: | +127.3% |
Income statistics for American Indian and Alaska Native residents
Number of households with income < $10k:| Thornton: | 8.4% (128,224) |
| New Hampshire: | 0.7% (6) |
Number of households with income $10k - 20k:| Thornton: | 9.4% (143,094) |
| State: | 9.7% (81) |
Number of households with income $20k - 30k:| Thornton: | 8.5% (129,431) |
| New Hampshire: | 8.7% (73) |
Number of households with income $30k - 40k:| Thornton: | 9.1% (138,669) |
| State: | 13.3% (111) |
Number of households with income $40k - 50k:| Thornton: | 8.3% (127,197) |
| State: | 9.4% (79) |
Number of households with income $50k - 60k:| Thornton: | 7.8% (119,936) |
| New Hampshire: | 3.7% (31) |
Number of households with income $60k - 75k:| Thornton: | 9.8% (149,495) |
| State: | 16.9% (141) |
Number of households with income $75k - 100k:| Thornton: | 12.6% (192,974) |
| State: | 3.9% (33) |
Number of households with income $100k - 125k:| Thornton: | 9.4% (144,306) |
| State: | 2.8% (23) |
Number of households with income $125k - 150k:| Thornton: | 5.6% (86,395) |
| New Hampshire: | 6.8% (57) |
Number of households with income $150k - 200k:| Thornton: | 6.0% (91,077) |
| State: | 22.6% (189) |
Number of households with income > $200k:| Thornton: | 5.2% (78,832) |
| New Hampshire: | 1.4% (12) |
Median per capita income in Thornton in 2022:| Thornton: | $85,921 |
| State: | $75,805 |
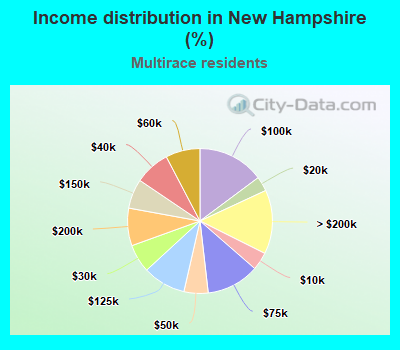
Income statistics for Multirace residents
Median household income in Thornton, NH in 2022:| Thornton: | $89,823 |
| State: | $81,037 |
Number of households with income < $10k:| Thornton: | 4.0% (413) |
| New Hampshire: | 4.0% (1,057) |
Number of households with income $10k - 20k:| Thornton: | 3.3% (334) |
| State: | 3.3% (864) |
Number of households with income $20k - 30k:| Thornton: | 6.3% (648) |
| State: | 6.3% (1,664) |
Number of households with income $30k - 40k:| Thornton: | 7.9% (805) |
| New Hampshire: | 7.9% (2,072) |
Number of households with income $40k - 50k:| Thornton: | 5.4% (557) |
| State: | 5.4% (1,422) |
Number of households with income $50k - 60k:| Thornton: | 7.7% (785) |
| New Hampshire: | 7.7% (2,024) |
Number of households with income $60k - 75k:| Thornton: | 11.8% (1,207) |
| State: | 11.8% (3,109) |
Number of households with income $75k - 100k:| Thornton: | 14.8% (1,521) |
| State: | 14.8% (3,906) |
Number of households with income $100k - 125k:| Thornton: | 9.7% (996) |
| New Hampshire: | 9.6% (2,523) |
Number of households with income $125k - 150k:| Thornton: | 6.5% (671) |
| New Hampshire: | 6.6% (1,734) |
Number of households with income $150k - 200k:| Thornton: | 8.4% (860) |
| State: | 8.4% (2,213) |
Number of households with income > $200k:| Thornton: | 14.2% (1,457) |
| New Hampshire: | 14.3% (3,765) |
Aggregate household income in Thornton in 2022: $4,537,578
Median family income in Thornton in 2022:| Thornton: | $106,458 |
| State: | $87,413 |
Number of families with income $20k - 30k:| Thornton: | 43.7% (14) |
| State: | 4.6% (869) |
Number of families with income $40k - 50k:| Thornton: | 21.9% (7) |
| State: | 5.1% (979) |
Number of families with income $50k - 60k:| Thornton: | 34.3% (11) |
| New Hampshire: | 7.4% (1,409) |
Median non-family income in Thornton in 2022:| Thornton: | $108,659 |
| State: | $60,494 |
Median per capita income in Thornton in 2022:| Thornton: | $25,995 |
| State: | $34,906 |
Change in median per capita income between 2000 and 2022:| Thornton, New Hampshire: | +136.3% |
| State: | +135.6% |
Income statistics for other residents
Number of households with income < $10k:| Thornton: | 0.0% (0) |
| New Hampshire: | 3.4% (271) |
Number of households with income $10k - 20k:| Thornton: | 0.0% (0) |
| State: | 4.6% (361) |
Number of households with income $20k - 30k:| Thornton: | 0.0% (0) |
| State: | 5.8% (454) |
Number of households with income $30k - 40k:| Thornton: | 0.0% (0) |
| New Hampshire: | 2.2% (172) |
Number of households with income $40k - 50k:| Thornton: | 23.1% (3) |
| State: | 18.5% (1,456) |
Number of households with income $50k - 60k:| Thornton: | 7.7% (1) |
| State: | 5.9% (461) |
Number of households with income $60k - 75k:| Thornton: | 7.7% (1) |
| State: | 7.2% (568) |
Number of households with income $75k - 100k:| Thornton: | 23.1% (3) |
| State: | 24.0% (1,890) |
Number of households with income $100k - 125k:| Thornton: | 7.7% (1) |
| State: | 4.5% (352) |
Number of households with income $125k - 150k:| Thornton: | 7.7% (1) |
| State: | 5.5% (429) |
Number of households with income $150k - 200k:| Thornton: | 15.4% (2) |
| State: | 11.6% (909) |
Number of households with income > $200k:| Thornton: | 7.7% (1) |
| State: | 6.9% (543) |
Aggregate household income in Thornton in 2022: $1,622,997
Median per capita income in Thornton in 2022:| Thornton: | $74,641 |
| New Hampshire: | $34,008 |