Tiger Valley, Tennessee (TN) income map, earnings map, and wages data
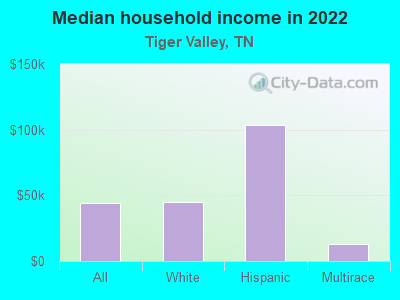
The median household income in Tiger Valley, TN in 2022 was $44,253, which was 47.5% less than the median annual income of $65,254 across the entire state of Tennessee. Compared to the median income of $24,705 in 2000 this represents an increase of 44.2%. The per capita income in 2022 was $23,702, which means an increase of 47.0% compared to 2000 when it was $12,567.
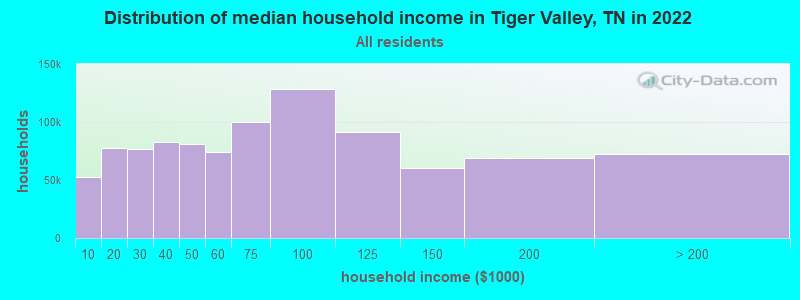
Income statistics for all residents
Median household income in Tiger Valley, TN in 2022:| Tiger Valley: | $44,254 |
| State: | $65,254 |
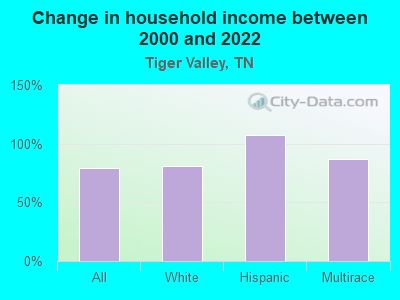
Change in median household income between 2000 and 2022:| Tiger Valley, Tennessee: | +79.1% |
| Tennessee: | +79.5% |
Number of households with income < $10k:| Tiger Valley: | 5.4% (52,513) |
| State: | 5.4% (154,793) |
Number of households with income $10k - 20k:| Tiger Valley: | 8.0% (77,664) |
| State: | 8.0% (228,599) |
Number of households with income $20k - 30k:| Tiger Valley: | 7.9% (76,377) |
| State: | 7.9% (224,908) |
Number of households with income $30k - 40k:| Tiger Valley: | 8.6% (82,904) |
| Tennessee: | 8.6% (244,297) |
Number of households with income $40k - 50k:| Tiger Valley: | 8.4% (81,078) |
| Tennessee: | 8.4% (238,949) |
Number of households with income $50k - 60k:| Tiger Valley: | 7.7% (74,129) |
| State: | 7.7% (218,438) |
Number of households with income $60k - 75k:| Tiger Valley: | 10.3% (99,844) |
| Tennessee: | 10.3% (294,172) |
Number of households with income $75k - 100k:| Tiger Valley: | 13.3% (128,052) |
| State: | 13.3% (377,310) |
Number of households with income $100k - 125k:| Tiger Valley: | 9.5% (91,385) |
| State: | 9.5% (269,124) |
Number of households with income $125k - 150k:| Tiger Valley: | 6.3% (60,483) |
| Tennessee: | 6.3% (178,328) |
Number of households with income $150k - 200k:| Tiger Valley: | 7.2% (69,170) |
| Tennessee: | 7.2% (204,030) |
Number of households with income > $200k:| Tiger Valley: | 7.5% (72,320) |
| State: | 7.5% (213,736) |
Aggregate household income in Tiger Valley in 2022: $4,407,405,220
Median family income in Tiger Valley in 2022:| Tiger Valley: | $56,563 |
| Tennessee: | $80,910 |
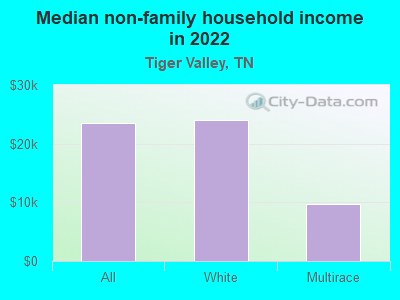
Median non-family income in Tiger Valley in 2022:| Tiger Valley: | $23,514 |
| Tennessee: | $40,285 |
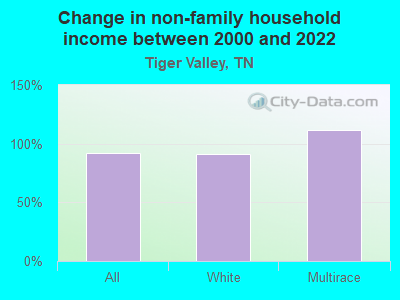
Change in median non-family income between 2000 and 2022:| Tiger Valley, Tennessee: | +91.6% |
| State: | +91.5% |
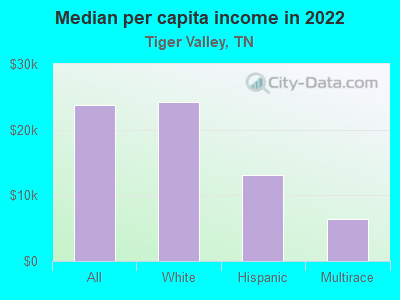
Median per capita income in Tiger Valley in 2022:| Tiger Valley: | $23,703 |
| Tennessee: | $36,704 |
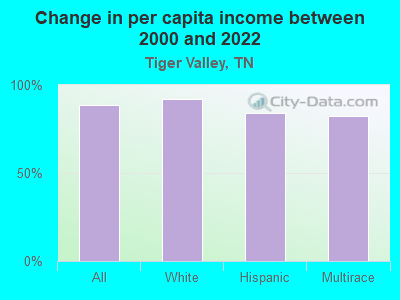
Change in median per capita income between 2000 and 2022:| Tiger Valley, Tennessee: | +88.6% |
| State: | +89.3% |
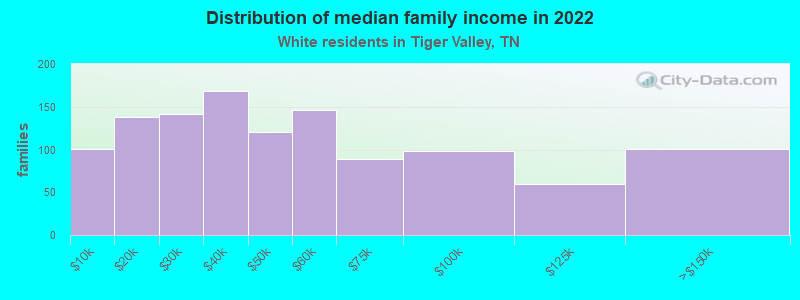
Income statistics for White residents
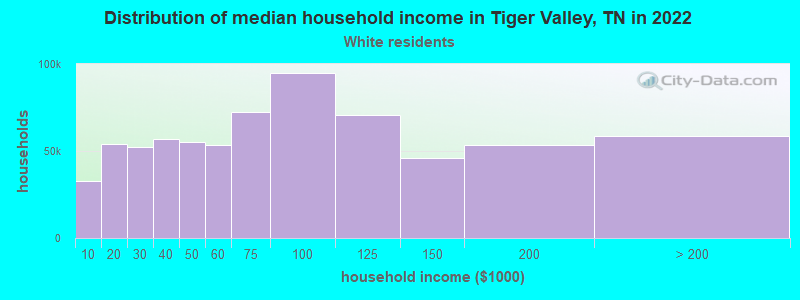
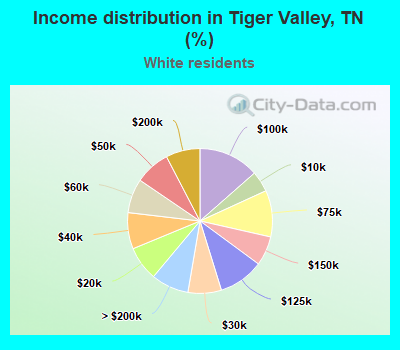
Median household income in Tiger Valley, TN in 2022:| Tiger Valley: | $44,882 |
| Tennessee: | $69,826 |
Change in median household income between 2000 and 2022:| Tiger Valley, Tennessee: | +80.8% |
| Tennessee: | +82.9% |
Number of households with income < $10k:| Tiger Valley: | 4.7% (32,652) |
| Tennessee: | 4.6% (100,279) |
Number of households with income $10k - 20k:| Tiger Valley: | 7.7% (53,823) |
| State: | 7.6% (165,031) |
Number of households with income $20k - 30k:| Tiger Valley: | 7.5% (52,238) |
| State: | 7.4% (160,229) |
Number of households with income $30k - 40k:| Tiger Valley: | 8.1% (56,679) |
| Tennessee: | 8.1% (174,784) |
Number of households with income $40k - 50k:| Tiger Valley: | 7.9% (55,077) |
| Tennessee: | 7.8% (169,622) |
Number of households with income $50k - 60k:| Tiger Valley: | 7.7% (53,610) |
| Tennessee: | 7.6% (165,508) |
Number of households with income $60k - 75k:| Tiger Valley: | 10.4% (72,636) |
| State: | 10.3% (223,937) |
Number of households with income $75k - 100k:| Tiger Valley: | 13.5% (94,709) |
| Tennessee: | 13.5% (292,688) |
Number of households with income $100k - 125k:| Tiger Valley: | 10.1% (70,945) |
| State: | 10.1% (219,251) |
Number of households with income $125k - 150k:| Tiger Valley: | 6.6% (45,971) |
| Tennessee: | 6.6% (142,574) |
Number of households with income $150k - 200k:| Tiger Valley: | 7.6% (53,413) |
| State: | 7.7% (166,039) |
Number of households with income > $200k:| Tiger Valley: | 8.4% (58,860) |
| State: | 8.5% (184,546) |
Aggregate household income in Tiger Valley in 2022: $3,526,992,213
Median family income in Tiger Valley in 2022:| Tiger Valley: | $56,794 |
| State: | $86,015 |
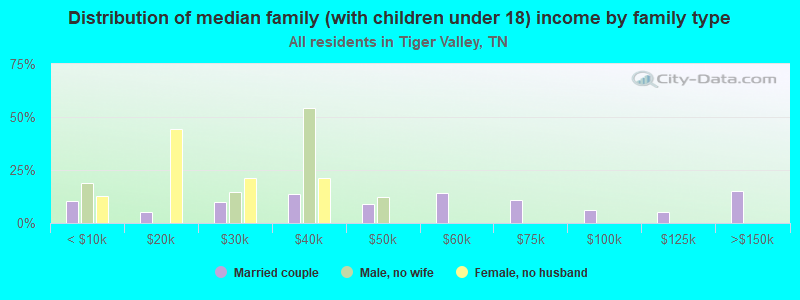
Number of families with income < $10k:| Tiger Valley: | 8.7% (101) |
| State: | 3.1% (43,751) |
Number of families with income $10k - 20k:| Tiger Valley: | 11.9% (138) |
| State: | 3.5% (49,925) |
Number of families with income $20k - 30k:| Tiger Valley: | 12.2% (142) |
| Tennessee: | 5.0% (70,431) |
Number of families with income $30k - 40k:| Tiger Valley: | 14.5% (169) |
| State: | 6.6% (93,498) |
Number of families with income $40k - 50k:| Tiger Valley: | 10.3% (120) |
| State: | 6.8% (96,726) |
Number of families with income $50k - 60k:| Tiger Valley: | 12.6% (146) |
| Tennessee: | 7.2% (101,879) |
Number of families with income $60k - 75k:| Tiger Valley: | 7.6% (89) |
| Tennessee: | 10.7% (151,997) |
Number of families with income $75k - 100k:| Tiger Valley: | 8.4% (98) |
| State: | 15.4% (218,373) |
Number of families with income $100k - 125k:| Tiger Valley: | 5.2% (60) |
| Tennessee: | 12.6% (178,761) |
Number of families with income $125k - 150k:| Tiger Valley: | 8.6% (101) |
| State: | 8.2% (116,575) |
Median non-family income in Tiger Valley in 2022:| Tiger Valley: | $23,958 |
| Tennessee: | $41,178 |
Change in median non-family income between 2000 and 2022:| Tiger Valley, Tennessee: | +91.1% |
| State: | +91.1% |
Median per capita income in Tiger Valley in 2022:| Tiger Valley: | $24,243 |
| State: | $40,126 |
Change in median per capita income between 2000 and 2022:| Tiger Valley, Tennessee: | +91.8% |
| State: | +92.6% |
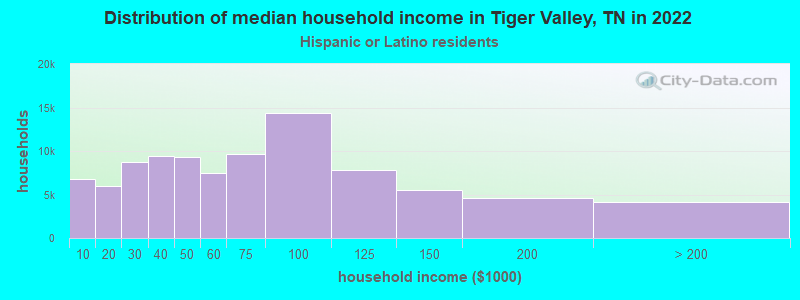
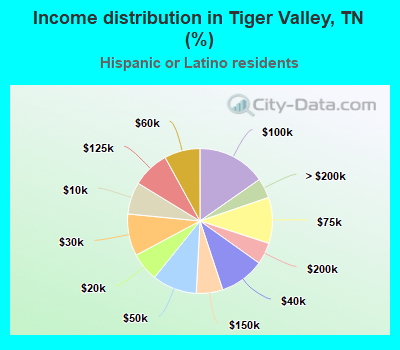
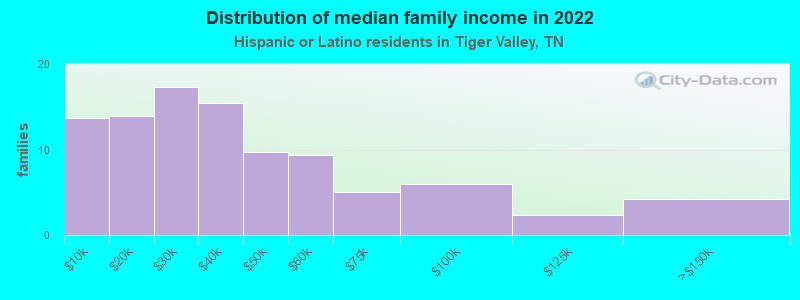
Income statistics for Hispanic or Latino residents
Median household income in Tiger Valley, TN in 2022:| Tiger Valley: | $103,920 |
| Tennessee: | $58,385 |
Change in median household income between 2000 and 2022:| Tiger Valley, Tennessee: | +107.1% |
| State: | +82.3% |
Number of households with income < $10k:| Tiger Valley: | 7.2% (6,726) |
| Tennessee: | 7.2% (8,567) |
Number of households with income $10k - 20k:| Tiger Valley: | 6.4% (6,002) |
| State: | 6.4% (7,670) |
Number of households with income $20k - 30k:| Tiger Valley: | 9.4% (8,781) |
| Tennessee: | 9.4% (11,247) |
Number of households with income $30k - 40k:| Tiger Valley: | 10.1% (9,435) |
| State: | 10.1% (12,072) |
Number of households with income $40k - 50k:| Tiger Valley: | 10.0% (9,353) |
| Tennessee: | 10.0% (11,947) |
Number of households with income $50k - 60k:| Tiger Valley: | 8.0% (7,488) |
| State: | 8.0% (9,569) |
Number of households with income $60k - 75k:| Tiger Valley: | 10.3% (9,626) |
| Tennessee: | 10.3% (12,315) |
Number of households with income $75k - 100k:| Tiger Valley: | 15.3% (14,348) |
| Tennessee: | 15.3% (18,285) |
Number of households with income $100k - 125k:| Tiger Valley: | 8.3% (7,779) |
| Tennessee: | 8.3% (9,886) |
Number of households with income $125k - 150k:| Tiger Valley: | 5.9% (5,545) |
| Tennessee: | 5.9% (7,066) |
Number of households with income $150k - 200k:| Tiger Valley: | 4.9% (4,559) |
| Tennessee: | 4.9% (5,822) |
Number of households with income > $200k:| Tiger Valley: | 4.5% (4,180) |
| State: | 4.5% (5,337) |
Aggregate household income in Tiger Valley in 2022: $2,943,892
Median family income in Tiger Valley in 2022:| Tiger Valley: | $112,048 |
| Tennessee: | $64,014 |
Number of families with income < $10k:| Tiger Valley: | 14.1% (14) |
| Tennessee: | 6.5% (5,773) |
Number of families with income $10k - 20k:| Tiger Valley: | 14.3% (14) |
| Tennessee: | 5.4% (4,773) |
Number of families with income $20k - 30k:| Tiger Valley: | 17.9% (17) |
| Tennessee: | 9.2% (8,233) |
Number of families with income $30k - 40k:| Tiger Valley: | 15.9% (15) |
| State: | 9.6% (8,514) |
Number of families with income $40k - 50k:| Tiger Valley: | 10.0% (10) |
| State: | 8.8% (7,850) |
Number of families with income $50k - 60k:| Tiger Valley: | 9.7% (9) |
| State: | 7.9% (7,017) |
Number of families with income $60k - 75k:| Tiger Valley: | 5.2% (5) |
| Tennessee: | 10.8% (9,605) |
Number of families with income $75k - 100k:| Tiger Valley: | 6.1% (6) |
| Tennessee: | 16.6% (14,820) |
Number of families with income $100k - 125k:| Tiger Valley: | 2.4% (2) |
| Tennessee: | 8.4% (7,480) |
Number of families with income $125k - 150k:| Tiger Valley: | 4.4% (4) |
| State: | 6.3% (5,594) |
Median per capita income in Tiger Valley in 2022:| Tiger Valley: | $13,094 |
| Tennessee: | $21,276 |
Change in median per capita income between 2000 and 2022:| Tiger Valley, Tennessee: | +84.4% |
| State: | +76.0% |
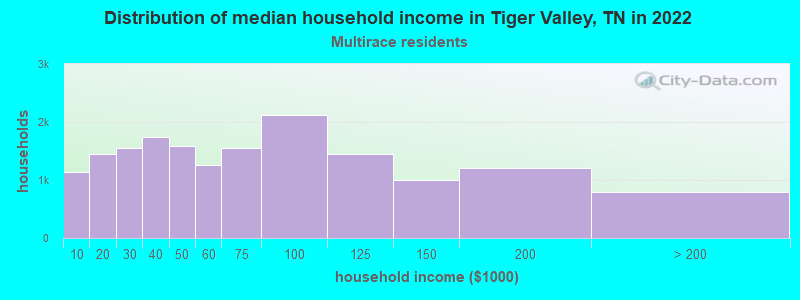
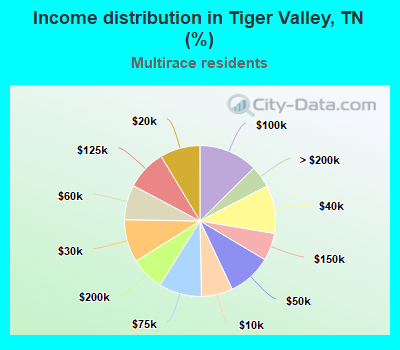
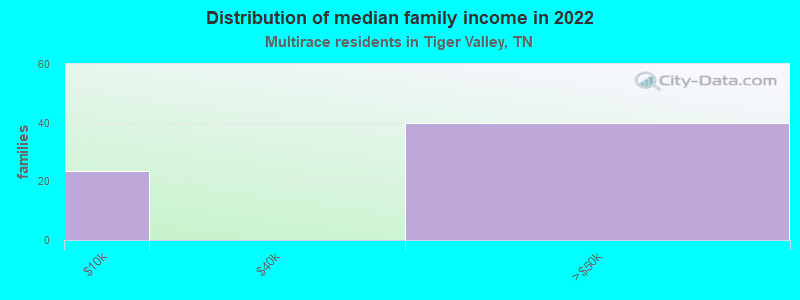
Income statistics for Multirace residents
Median household income in Tiger Valley, TN in 2022:| Tiger Valley: | $13,218 |
| Tennessee: | $57,741 |
Change in median household income between 2000 and 2022:| Tiger Valley, Tennessee: | +86.6% |
| State: | +87.1% |
Number of households with income < $10k:| Tiger Valley: | 6.7% (1,133) |
| State: | 6.7% (9,867) |
Number of households with income $10k - 20k:| Tiger Valley: | 8.6% (1,448) |
| State: | 8.6% (12,639) |
Number of households with income $20k - 30k:| Tiger Valley: | 9.2% (1,550) |
| State: | 9.2% (13,555) |
Number of households with income $30k - 40k:| Tiger Valley: | 10.3% (1,736) |
| State: | 10.3% (15,117) |
Number of households with income $40k - 50k:| Tiger Valley: | 9.4% (1,584) |
| State: | 9.4% (13,829) |
Number of households with income $50k - 60k:| Tiger Valley: | 7.5% (1,258) |
| Tennessee: | 7.5% (10,969) |
Number of households with income $60k - 75k:| Tiger Valley: | 9.2% (1,550) |
| Tennessee: | 9.2% (13,568) |
Number of households with income $75k - 100k:| Tiger Valley: | 12.6% (2,127) |
| Tennessee: | 12.6% (18,516) |
Number of households with income $100k - 125k:| Tiger Valley: | 8.6% (1,454) |
| Tennessee: | 8.6% (12,656) |
Number of households with income $125k - 150k:| Tiger Valley: | 5.9% (995) |
| State: | 5.9% (8,674) |
Number of households with income $150k - 200k:| Tiger Valley: | 7.2% (1,210) |
| State: | 7.2% (10,611) |
Number of households with income > $200k:| Tiger Valley: | 4.7% (796) |
| State: | 4.8% (6,986) |
Aggregate household income in Tiger Valley in 2022: $4,773,708
Median family income in Tiger Valley in 2022:| Tiger Valley: | $50,566 |
| Tennessee: | $70,058 |
Number of families with income < $10k:| Tiger Valley: | 37.2% (24) |
| Tennessee: | 5.6% (5,426) |
Number of families with income $40k - 50k:| Tiger Valley: | 62.8% (40) |
| Tennessee: | 8.2% (7,919) |
Median non-family income in Tiger Valley in 2022:| Tiger Valley: | $9,704 |
| State: | $39,395 |
Change in median non-family income between 2000 and 2022:| Tiger Valley, Tennessee: | +111.7% |
| State: | +99.1% |
Median per capita income in Tiger Valley in 2022:| Tiger Valley: | $6,384 |
| Tennessee: | $24,436 |
Change in median per capita income between 2000 and 2022:| Tiger Valley, Tennessee: | +82.5% |
| State: | +84.3% |