The median household income in Trappe, MD in 2022 was $62,843, which was 51.2% less than the median annual income of $94,991 across the entire state of Maryland. Compared to the median income of $40,625 in 2000 this represents an increase of 35.4%. The per capita income in 2022 was $31,768, which means an increase of 45.1% compared to 2000 when it was $17,451.
Whole page based on the data from 2000 / 2022 when the population of Trappe, Maryland was 1,146 / 1,019
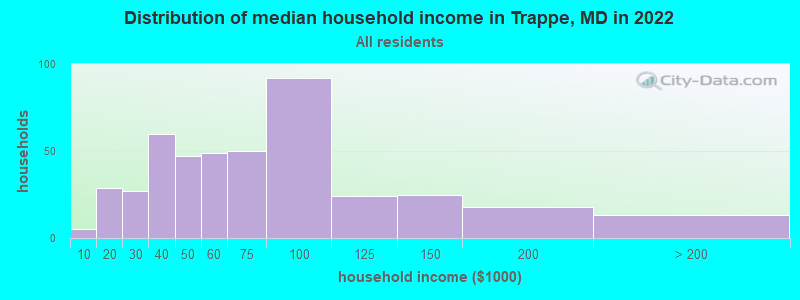
Income statistics for all residents
Median household income in Trappe, MD in 2022:
Trappe:
$62,843
Maryland:
$94,991
Change in median household income between 2000 and 2022:
Trappe, Maryland:
+54.7%
State:
+79.7%
Number of households with income < $10k:
Trappe:
1.1% (5)
State:
4.8% (114,450)
Number of households with income $10k - 20k:
Trappe:
6.6% (29)
Maryland:
5.0% (117,883)
Number of households with income $20k - 30k:
Trappe:
6.2% (27)
State:
5.2% (123,350)
Number of households with income $30k - 40k:
Trappe:
13.7% (60)
State:
5.6% (134,104)
Number of households with income $40k - 50k:
Trappe:
10.7% (47)
Maryland:
5.6% (132,932)
Number of households with income $50k - 60k:
Trappe:
11.2% (49)
State:
5.6% (132,707)
Number of households with income $60k - 75k:
Trappe:
11.4% (50)
State:
7.9% (188,335)
Number of households with income $75k - 100k:
Trappe:
21.0% (92)
State:
12.5% (297,873)
Number of households with income $100k - 125k:
Trappe:
5.5% (24)
State:
10.5% (250,497)
Number of households with income $125k - 150k:
Trappe:
5.7% (25)
State:
8.1% (193,208)
Number of households with income $150k - 200k:
Trappe:
4.1% (18)
State:
11.6% (274,905)
Number of households with income > $200k:
Trappe:
3.0% (13)
State:
17.5% (415,740)
Aggregate household income in Trappe in 2022: $31,584,993
Median family income in Trappe in 2022:
Trappe:
$76,312
State:
$117,294
Number of families with income $10k - 20k:
Trappe:
5.8% (15)
State:
2.6% (40,126)
Number of families with income $20k - 30k:
Trappe:
8.5% (22)
Maryland:
3.4% (52,891)
Number of families with income $30k - 40k:
Trappe:
1.9% (5)
State:
4.5% (70,252)
Number of families with income $40k - 50k:
Trappe:
8.7% (23)
Maryland:
4.8% (74,112)
Number of families with income $50k - 60k:
Trappe:
10.5% (28)
State:
5.0% (77,590)
Number of families with income $60k - 75k:
Trappe:
15.3% (40)
State:
7.1% (109,924)
Number of families with income $75k - 100k:
Trappe:
22.6% (59)
State:
12.0% (185,255)
Number of families with income $100k - 125k:
Trappe:
9.1% (24)
State:
11.2% (173,203)
Number of families with income $125k - 150k:
Trappe:
6.7% (18)
State:
9.3% (143,453)
Number of families with income $150k - 200k:
Trappe:
6.7% (18)
Maryland:
14.2% (218,861)
Number of families with income > $200k:
Trappe:
4.2% (11)
Maryland:
23.2% (359,182)
Median non-family income in Trappe in 2022:
Trappe:
$42,659
State:
$57,179
Change in median non-family income between 2000 and 2022:
Trappe, Maryland:
+65.1%
State:
+75.1%
Median per capita income in Trappe in 2022:
Trappe:
$31,768
State:
$49,236
Change in median per capita income between 2000 and 2022:
Trappe, Maryland:
+82.0%
State:
+92.2%
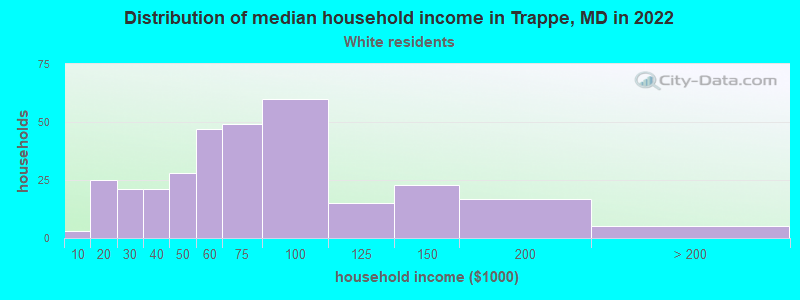
Income statistics for White residents
Median household income in Trappe, MD in 2022:
Trappe:
$65,717
State:
$107,160
Change in median household income between 2000 and 2022:
Trappe, Maryland:
+50.7%
Maryland:
+85.3%
Number of households with income < $10k:
Trappe:
1.0% (3)
State:
3.7% (47,387)
Number of households with income $10k - 20k:
Trappe:
8.0% (25)
State:
4.1% (52,102)
Number of households with income $20k - 30k:
Trappe:
6.7% (21)
Maryland:
4.6% (58,758)
Number of households with income $30k - 40k:
Trappe:
6.7% (21)
State:
4.7% (59,745)
Number of households with income $40k - 50k:
Trappe:
8.9% (28)
Maryland:
5.0% (62,576)
Number of households with income $50k - 60k:
Trappe:
15.0% (47)
Maryland:
5.1% (64,484)
Number of households with income $60k - 75k:
Trappe:
15.6% (49)
Maryland:
7.7% (97,019)
Number of households with income $75k - 100k:
Trappe:
19.1% (60)
Maryland:
11.8% (149,205)
Number of households with income $100k - 125k:
Trappe:
4.8% (15)
State:
10.6% (134,231)
Number of households with income $125k - 150k:
Trappe:
7.3% (23)
State:
8.8% (111,081)
Number of households with income $150k - 200k:
Trappe:
5.4% (17)
State:
12.9% (162,966)
Number of households with income > $200k:
Trappe:
1.6% (5)
State:
20.9% (264,377)
Aggregate household income in Trappe in 2022: $23,348,498
Median family income in Trappe in 2022:
Trappe:
$71,363
Maryland:
$134,708
Number of families with income $10k - 20k:
Trappe:
7.6% (16)
Maryland:
2.0% (16,048)
Number of families with income $20k - 30k:
Trappe:
6.3% (13)
Maryland:
2.2% (18,018)
Number of families with income $30k - 40k:
Trappe:
2.0% (4)
State:
3.3% (26,886)
Number of families with income $40k - 50k:
Trappe:
6.0% (12)
State:
3.6% (29,194)
Number of families with income $50k - 60k:
Trappe:
12.7% (26)
State:
4.1% (33,120)
Number of families with income $60k - 75k:
Trappe:
19.0% (39)
State:
6.6% (53,501)
Number of families with income $75k - 100k:
Trappe:
21.8% (44)
Maryland:
11.3% (91,779)
Number of families with income $100k - 125k:
Trappe:
7.4% (15)
Maryland:
11.3% (91,483)
Number of families with income $125k - 150k:
Trappe:
7.4% (15)
State:
9.9% (80,832)
Number of families with income $150k - 200k:
Trappe:
8.4% (17)
State:
16.0% (130,295)
Number of families with income > $200k:
Trappe:
1.4% (3)
Maryland:
28.1% (228,324)
Median non-family income in Trappe in 2022:
Trappe:
$52,486
State:
$61,991
Change in median non-family income between 2000 and 2022:
Trappe, Maryland:
+121.0%
Maryland:
+76.8%
Median per capita income in Trappe in 2022:
Trappe:
$33,092
Maryland:
$59,750
Change in median per capita income between 2000 and 2022:
Trappe, Maryland:
+82.9%
Maryland:
+104.5%
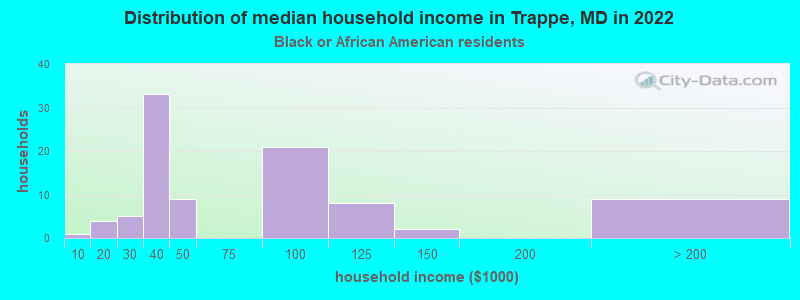
Income statistics for Black or African American residents
Number of households with income < $10k:
Trappe:
1.1% (1)
Maryland:
7.0% (50,093)
Number of households with income $10k - 20k:
Trappe:
4.3% (4)
State:
7.2% (51,849)
Number of households with income $20k - 30k:
Trappe:
5.4% (5)
State:
5.8% (41,510)
Number of households with income $30k - 40k:
Trappe:
35.9% (33)
Maryland:
6.9% (49,466)
Number of households with income $40k - 50k:
Trappe:
9.8% (9)
State:
6.6% (47,557)
Number of households with income $50k - 60k:
Trappe:
0.0% (0)
State:
6.2% (44,818)
Number of households with income $60k - 75k:
Trappe:
0.0% (0)
Maryland:
8.6% (61,728)
Number of households with income $75k - 100k:
Trappe:
22.8% (21)
State:
13.2% (95,107)
Number of households with income $100k - 125k:
Trappe:
8.7% (8)
Maryland:
10.2% (73,579)
Number of households with income $125k - 150k:
Trappe:
2.2% (2)
State:
7.2% (51,970)
Number of households with income $150k - 200k:
Trappe:
0.0% (0)
State:
9.4% (67,623)
Number of households with income > $200k:
Trappe:
9.8% (9)
State:
11.7% (83,862)
Aggregate household income in Trappe in 2022: $6,410,880
Median family income in Trappe in 2022:
Trappe:
$104,888
State:
$96,241
Number of families with income $20k - 30k:
Trappe:
15.6% (5)
Maryland:
4.3% (18,629)
Number of families with income $40k - 50k:
Trappe:
3.6% (1)
State:
6.2% (27,138)
Number of families with income $75k - 100k:
Trappe:
21.4% (7)
State:
12.8% (55,976)
Number of families with income $100k - 125k:
Trappe:
25.7% (8)
Maryland:
11.4% (49,778)
Number of families with income $125k - 150k:
Trappe:
6.3% (2)
State:
8.8% (38,547)
Number of families with income > $200k:
Trappe:
27.4% (9)
Maryland:
16.5% (71,997)
Median non-family income in Trappe in 2022:
Trappe:
$35,044
Maryland:
$49,944
Change in median non-family income between 2000 and 2022:
Trappe, Maryland:
+27.4%
Maryland:
+71.8%
Median per capita income in Trappe in 2022:
Trappe:
$36,893
State:
$40,756
Change in median per capita income between 2000 and 2022:
Trappe, Maryland:
+113.1%
State:
+113.5%
Income statistics for Asian residents
Median per capita income in Trappe in 2022:
Trappe:
$27,541
Maryland:
$53,546
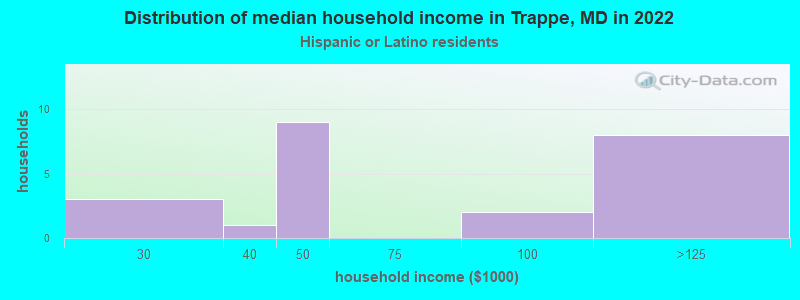
Income statistics for Hispanic or Latino residents
Number of households with income < $10k:
Trappe:
0.0% (0)
State:
3.7% (6,871)
Number of households with income $10k - 20k:
Trappe:
0.0% (0)
State:
2.9% (5,465)
Number of households with income $20k - 30k:
Trappe:
13.0% (3)
Maryland:
5.9% (11,012)
Number of households with income $30k - 40k:
Trappe:
4.3% (1)
State:
7.9% (14,668)
Number of households with income $40k - 50k:
Trappe:
39.1% (9)
Maryland:
7.6% (14,074)
Number of households with income $50k - 60k:
Trappe:
0.0% (0)
Maryland:
7.6% (14,166)
Number of households with income $60k - 75k:
Trappe:
0.0% (0)
Maryland:
9.9% (18,486)
Number of households with income $75k - 100k:
Trappe:
8.7% (2)
State:
16.1% (30,032)
Number of households with income $100k - 125k:
Trappe:
34.8% (8)
State:
9.4% (17,432)
Number of households with income $125k - 150k:
Trappe:
0.0% (0)
State:
7.5% (13,963)
Number of households with income $150k - 200k:
Trappe:
0.0% (0)
State:
10.1% (18,750)
Number of households with income > $200k:
Trappe:
0.0% (0)
State:
11.4% (21,133)
Aggregate household income in Trappe in 2022: $1,532,369
Median per capita income in Trappe in 2022:
Trappe:
$13,353
Maryland:
$29,024
Change in median per capita income between 2000 and 2022:
Trappe, Maryland:
+73.0%
Maryland:
+79.2%
Income statistics for American Indian and Alaska Native residents
Median per capita income in Trappe in 2022:
Trappe:
$55,918
State:
$35,089
Change in median per capita income between 2000 and 2022:
Trappe, Maryland:
+45.6%
State:
+56.2%
Income statistics for Multirace residents
Aggregate household income in Trappe in 2022: $1,175,228
Median per capita income in Trappe in 2022:
Trappe:
$9,414
Maryland:
$35,630
Income statistics for other residents
Aggregate household income in Trappe in 2022: $384,147
Median per capita income in Trappe in 2022:
Trappe:
$12,571
Maryland:
$24,415
Change in median per capita income between 2000 and 2022:
Trappe, Maryland:
+86.2%
State:
+73.6%
Discuss Trappe, Maryland (MD) on our hugely popular Maryland forum.