Wilmore, Pennsylvania (PA) income map, earnings map, and wages data

Data:
The per capita income in 2022 was $22,236, which means an increase of 45.7% compared to 2000 when it was $12,075.
Whole page based on the data from 2000 / 2022 when the population of Wilmore, Pennsylvania was 252 / 385
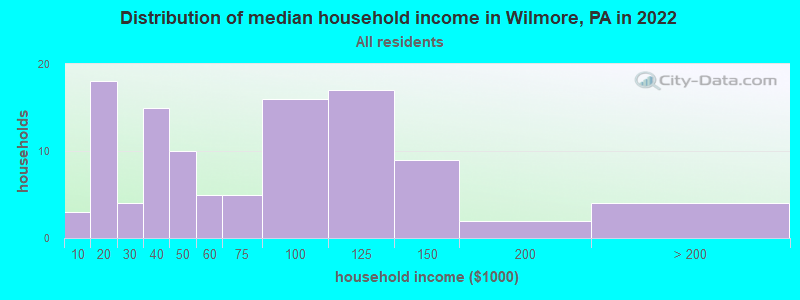
Income statistics for all residents
Number of households with income < $10k:| Wilmore: | 2.8% (3) |
| Pennsylvania: | 5.5% (291,562) |
Number of households with income $10k - 20k:| Wilmore: | 16.7% (18) |
| Pennsylvania: | 7.3% (384,726) |
Number of households with income $20k - 30k:| Wilmore: | 3.7% (4) |
| State: | 7.4% (389,464) |
Number of households with income $30k - 40k:| Wilmore: | 13.9% (15) |
| State: | 7.6% (402,138) |
Number of households with income $40k - 50k:| Wilmore: | 9.3% (10) |
| Pennsylvania: | 7.3% (387,945) |
Number of households with income $50k - 60k:| Wilmore: | 4.6% (5) |
| Pennsylvania: | 7.0% (372,468) |
Number of households with income $60k - 75k:| Wilmore: | 4.6% (5) |
| State: | 9.9% (524,786) |
Number of households with income $75k - 100k:| Wilmore: | 14.8% (16) |
| Pennsylvania: | 12.6% (666,253) |
Number of households with income $100k - 125k:| Wilmore: | 15.7% (17) |
| State: | 9.9% (526,402) |
Number of households with income $125k - 150k:| Wilmore: | 8.3% (9) |
| State: | 6.9% (362,702) |
Number of households with income $150k - 200k:| Wilmore: | 1.9% (2) |
| State: | 8.3% (440,827) |
Number of households with income > $200k:| Wilmore: | 3.7% (4) |
| Pennsylvania: | 10.3% (544,792) |
Aggregate household income in Wilmore in 2022: $7,957,113
Median family income in Wilmore in 2022:| Wilmore: | $58,380 |
| State: | $93,029 |
Number of families with income < $10k:| Wilmore: | 3.9% (3) |
| Pennsylvania: | 3.1% (101,868) |
Number of families with income $10k - 20k:| Wilmore: | 14.9% (12) |
| State: | 3.5% (115,881) |
Number of families with income $20k - 30k:| Wilmore: | 1.2% (1) |
| State: | 4.8% (156,521) |
Number of families with income $30k - 40k:| Wilmore: | 14.1% (12) |
| Pennsylvania: | 5.8% (191,305) |
Number of families with income $40k - 50k:| Wilmore: | 2.3% (2) |
| Pennsylvania: | 6.4% (211,380) |
Number of families with income $50k - 60k:| Wilmore: | 10.7% (9) |
| State: | 6.4% (209,910) |
Number of families with income $60k - 75k:| Wilmore: | 12.0% (10) |
| Pennsylvania: | 9.7% (318,991) |
Number of families with income $75k - 100k:| Wilmore: | 16.8% (14) |
| State: | 14.0% (461,021) |
Number of families with income $100k - 125k:| Wilmore: | 5.1% (4) |
| State: | 12.2% (400,961) |
Number of families with income $125k - 150k:| Wilmore: | 11.4% (9) |
| State: | 8.8% (288,471) |
Number of families with income $150k - 200k:| Wilmore: | 2.2% (2) |
| State: | 11.2% (367,642) |
Number of families with income > $200k:| Wilmore: | 5.5% (5) |
| State: | 14.3% (470,863) |
Median non-family income in Wilmore in 2022:| Wilmore: | $40,094 |
| State: | $42,203 |
Median per capita income in Wilmore in 2022:| Wilmore: | $22,236 |
| State: | $41,489 |
Change in median per capita income between 2000 and 2022:| Wilmore, Pennsylvania: | +84.2% |
| Pennsylvania: | +98.7% |
Income statistics for White residents
Number of households with income < $10k:| Wilmore: | 1.9% (2) |
| State: | 4.3% (179,792) |
Number of households with income $10k - 20k:| Wilmore: | 17.8% (19) |
| State: | 6.5% (268,738) |
Number of households with income $20k - 30k:| Wilmore: | 2.8% (3) |
| State: | 7.0% (288,138) |
Number of households with income $30k - 40k:| Wilmore: | 14.0% (15) |
| State: | 7.2% (300,208) |
Number of households with income $40k - 50k:| Wilmore: | 9.3% (10) |
| Pennsylvania: | 7.2% (298,756) |
Number of households with income $50k - 60k:| Wilmore: | 4.7% (5) |
| State: | 6.8% (283,251) |
Number of households with income $60k - 75k:| Wilmore: | 5.6% (6) |
| State: | 9.9% (408,159) |
Number of households with income $75k - 100k:| Wilmore: | 14.0% (15) |
| State: | 13.2% (547,809) |
Number of households with income $100k - 125k:| Wilmore: | 15.9% (17) |
| State: | 10.5% (436,652) |
Number of households with income $125k - 150k:| Wilmore: | 8.4% (9) |
| State: | 7.3% (304,132) |
Number of households with income $150k - 200k:| Wilmore: | 1.9% (2) |
| State: | 9.0% (374,658) |
Number of households with income > $200k:| Wilmore: | 3.7% (4) |
| State: | 10.9% (452,618) |
Aggregate household income in Wilmore in 2022: $7,853,436
Median family income in Wilmore in 2022:| Wilmore: | $59,046 |
| Pennsylvania: | $99,396 |
Number of families with income < $10k:| Wilmore: | 3.7% (3) |
| State: | 2.2% (56,136) |
Number of families with income $10k - 20k:| Wilmore: | 15.7% (13) |
| State: | 2.7% (69,032) |
Number of families with income $30k - 40k:| Wilmore: | 15.0% (12) |
| State: | 5.2% (134,367) |
Number of families with income $40k - 50k:| Wilmore: | 2.4% (2) |
| State: | 6.0% (154,327) |
Number of families with income $50k - 60k:| Wilmore: | 10.3% (9) |
| Pennsylvania: | 6.1% (157,983) |
Number of families with income $60k - 75k:| Wilmore: | 12.4% (10) |
| State: | 9.6% (249,292) |
Number of families with income $75k - 100k:| Wilmore: | 16.7% (14) |
| State: | 14.7% (379,316) |
Number of families with income $100k - 125k:| Wilmore: | 5.1% (4) |
| State: | 12.9% (333,626) |
Number of families with income $125k - 150k:| Wilmore: | 11.0% (9) |
| Pennsylvania: | 9.4% (243,915) |
Number of families with income $150k - 200k:| Wilmore: | 2.2% (2) |
| Pennsylvania: | 12.2% (314,926) |
Number of families with income > $200k:| Wilmore: | 5.5% (5) |
| Pennsylvania: | 15.1% (390,885) |
Median non-family income in Wilmore in 2022:| Wilmore: | $41,590 |
| State: | $44,251 |
Median per capita income in Wilmore in 2022:| Wilmore: | $22,569 |
| Pennsylvania: | $45,306 |
Change in median per capita income between 2000 and 2022:| Wilmore, Pennsylvania: | +84.0% |
| State: | +105.4% |