Woodbourne-Hyde Park, Ohio (OH) income map, earnings map, and wages data
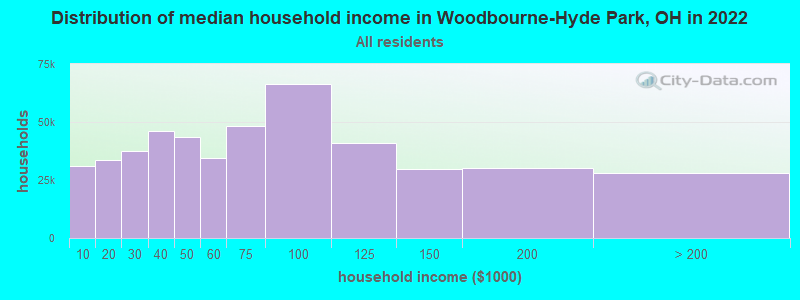
The median household income in Woodbourne-Hyde Park, OH in 2022 was $125,032, which was 47.4% greater than the median annual income of $65,720 across the entire state of Ohio. Compared to the median income of $80,041 in 2000 this represents an increase of 36.0%. The per capita income in 2022 was $64,252, which means an increase of 40.8% compared to 2000 when it was $38,052.
Income statistics for all residents
Median household income in Woodbourne-Hyde Park, OH in 2022:| Woodbourne-Hyde Park: | $125,033 |
| Ohio: | $65,720 |
Change in median household income between 2000 and 2022:| Woodbourne-Hyde Park, Ohio: | +56.2% |
| State: | +60.5% |
Number of households with income < $10k:| Woodbourne-Hyde Park: | 6.6% (31,077) |
| Ohio: | 5.9% (286,511) |
Number of households with income $10k - 20k:| Woodbourne-Hyde Park: | 7.2% (33,823) |
| Ohio: | 8.0% (392,234) |
Number of households with income $20k - 30k:| Woodbourne-Hyde Park: | 7.9% (37,307) |
| Ohio: | 7.8% (380,130) |
Number of households with income $30k - 40k:| Woodbourne-Hyde Park: | 9.8% (46,195) |
| State: | 8.3% (405,713) |
Number of households with income $40k - 50k:| Woodbourne-Hyde Park: | 9.2% (43,403) |
| State: | 8.0% (388,158) |
Number of households with income $50k - 60k:| Woodbourne-Hyde Park: | 7.3% (34,360) |
| State: | 7.7% (378,045) |
Number of households with income $60k - 75k:| Woodbourne-Hyde Park: | 10.2% (48,097) |
| State: | 10.0% (488,380) |
Number of households with income $75k - 100k:| Woodbourne-Hyde Park: | 14.2% (66,457) |
| State: | 13.2% (643,774) |
Number of households with income $100k - 125k:| Woodbourne-Hyde Park: | 8.7% (40,913) |
| State: | 9.6% (467,137) |
Number of households with income $125k - 150k:| Woodbourne-Hyde Park: | 6.4% (29,895) |
| State: | 6.4% (314,382) |
Number of households with income $150k - 200k:| Woodbourne-Hyde Park: | 6.4% (30,088) |
| State: | 7.4% (359,847) |
Number of households with income > $200k:| Woodbourne-Hyde Park: | 5.9% (27,884) |
| State: | 7.7% (373,895) |
Aggregate household income in Woodbourne-Hyde Park in 2022: $2,756,545,153
Median family income in Woodbourne-Hyde Park in 2022:| Woodbourne-Hyde Park: | $143,815 |
| State: | $86,001 |
Median non-family income in Woodbourne-Hyde Park in 2022:| Woodbourne-Hyde Park: | $59,740 |
| State: | $40,164 |
Change in median non-family income between 2000 and 2022:| Woodbourne-Hyde Park, Ohio: | +61.2% |
| Ohio: | +67.3% |
Median per capita income in Woodbourne-Hyde Park in 2022:| Woodbourne-Hyde Park: | $64,252 |
| Ohio: | $37,932 |
Change in median per capita income between 2000 and 2022:| Woodbourne-Hyde Park, Ohio: | +68.9% |
| Ohio: | +80.6% |
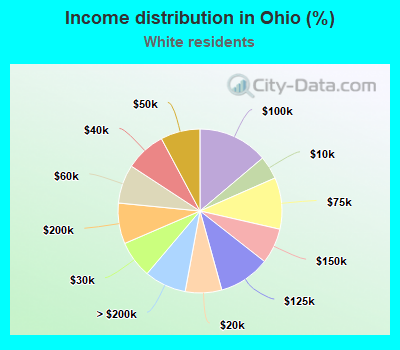
Income statistics for White residents
Median household income in Woodbourne-Hyde Park, OH in 2022:| Woodbourne-Hyde Park: | $127,651 |
| State: | $70,749 |
Change in median household income between 2000 and 2022:| Woodbourne-Hyde Park, Ohio: | +60.5% |
| State: | +65.2% |
Number of households with income < $10k:| Woodbourne-Hyde Park: | 4.7% (14,707) |
| State: | 4.6% (178,598) |
Number of households with income $10k - 20k:| Woodbourne-Hyde Park: | 5.7% (17,715) |
| State: | 7.2% (279,908) |
Number of households with income $20k - 30k:| Woodbourne-Hyde Park: | 7.9% (24,502) |
| State: | 7.3% (285,935) |
Number of households with income $30k - 40k:| Woodbourne-Hyde Park: | 9.3% (28,864) |
| State: | 8.0% (310,871) |
Number of households with income $40k - 50k:| Woodbourne-Hyde Park: | 7.8% (24,245) |
| Ohio: | 7.8% (303,221) |
Number of households with income $50k - 60k:| Woodbourne-Hyde Park: | 7.4% (23,083) |
| Ohio: | 7.7% (297,864) |
Number of households with income $60k - 75k:| Woodbourne-Hyde Park: | 11.5% (35,558) |
| State: | 10.2% (395,379) |
Number of households with income $75k - 100k:| Woodbourne-Hyde Park: | 15.3% (47,512) |
| Ohio: | 13.8% (538,093) |
Number of households with income $100k - 125k:| Woodbourne-Hyde Park: | 9.3% (28,743) |
| State: | 10.1% (394,658) |
Number of households with income $125k - 150k:| Woodbourne-Hyde Park: | 6.8% (21,060) |
| State: | 7.0% (272,471) |
Number of households with income $150k - 200k:| Woodbourne-Hyde Park: | 7.7% (24,015) |
| State: | 8.0% (312,939) |
Number of households with income > $200k:| Woodbourne-Hyde Park: | 6.4% (19,895) |
| Ohio: | 8.3% (321,654) |
Aggregate household income in Woodbourne-Hyde Park in 2022: $2,033,363,970
Median family income in Woodbourne-Hyde Park in 2022:| Woodbourne-Hyde Park: | $147,559 |
| Ohio: | $91,556 |
Number of families with income < $10k:| Woodbourne-Hyde Park: | 0.2% (5) |
| State: | 2.6% (62,772) |
Number of families with income $10k - 20k:| Woodbourne-Hyde Park: | 0.4% (12) |
| State: | 3.3% (78,470) |
Number of families with income $20k - 30k:| Woodbourne-Hyde Park: | 0.8% (26) |
| Ohio: | 4.3% (102,470) |
Number of families with income $30k - 40k:| Woodbourne-Hyde Park: | 1.4% (48) |
| State: | 5.8% (139,122) |
Number of families with income $40k - 50k:| Woodbourne-Hyde Park: | 2.2% (74) |
| Ohio: | 6.4% (152,812) |
Number of families with income $50k - 60k:| Woodbourne-Hyde Park: | 3.4% (115) |
| State: | 7.0% (167,384) |
Number of families with income $60k - 75k:| Woodbourne-Hyde Park: | 5.5% (186) |
| State: | 10.2% (245,177) |
Number of families with income $75k - 100k:| Woodbourne-Hyde Park: | 13.4% (451) |
| State: | 15.6% (375,564) |
Number of families with income $100k - 125k:| Woodbourne-Hyde Park: | 16.5% (555) |
| State: | 12.6% (303,754) |
Number of families with income $125k - 150k:| Woodbourne-Hyde Park: | 11.4% (384) |
| Ohio: | 9.3% (224,334) |
Number of families with income $150k - 200k:| Woodbourne-Hyde Park: | 19.8% (669) |
| State: | 11.2% (268,546) |
Number of families with income > $200k:| Woodbourne-Hyde Park: | 25.1% (847) |
| State: | 11.8% (282,391) |
Median non-family income in Woodbourne-Hyde Park in 2022:| Woodbourne-Hyde Park: | $61,907 |
| State: | $42,037 |
Change in median non-family income between 2000 and 2022:| Woodbourne-Hyde Park, Ohio: | +65.6% |
| State: | +68.0% |
Median per capita income in Woodbourne-Hyde Park in 2022:| Woodbourne-Hyde Park: | $65,619 |
| State: | $40,927 |
Change in median per capita income between 2000 and 2022:| Woodbourne-Hyde Park, Ohio: | +71.4% |
| State: | +85.3% |
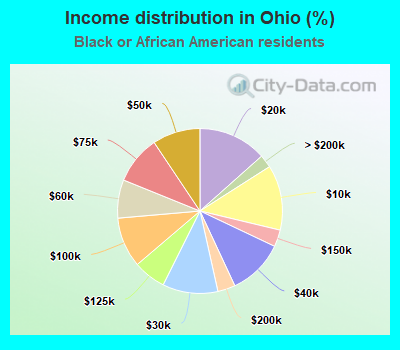
Income statistics for Black or African American residents
Median household income in Woodbourne-Hyde Park, OH in 2022:| Woodbourne-Hyde Park: | $76,300 |
| State: | $42,072 |
Change in median household income between 2000 and 2022:| Woodbourne-Hyde Park, Ohio: | +63.3% |
| State: | +58.1% |
Number of households with income < $10k:| Woodbourne-Hyde Park: | 13.8% (11,296) |
| State: | 12.8% (74,069) |
Number of households with income $10k - 20k:| Woodbourne-Hyde Park: | 11.1% (9,127) |
| Ohio: | 13.4% (77,994) |
Number of households with income $20k - 30k:| Woodbourne-Hyde Park: | 8.3% (6,846) |
| State: | 10.9% (63,098) |
Number of households with income $30k - 40k:| Woodbourne-Hyde Park: | 12.0% (9,808) |
| Ohio: | 11.0% (63,974) |
Number of households with income $40k - 50k:| Woodbourne-Hyde Park: | 11.9% (9,793) |
| State: | 9.4% (54,498) |
Number of households with income $50k - 60k:| Woodbourne-Hyde Park: | 7.0% (5,768) |
| State: | 7.5% (43,648) |
Number of households with income $60k - 75k:| Woodbourne-Hyde Park: | 6.6% (5,392) |
| State: | 9.5% (55,058) |
Number of households with income $75k - 100k:| Woodbourne-Hyde Park: | 10.7% (8,789) |
| Ohio: | 9.8% (57,169) |
Number of households with income $100k - 125k:| Woodbourne-Hyde Park: | 7.8% (6,360) |
| State: | 6.4% (37,172) |
Number of households with income $125k - 150k:| Woodbourne-Hyde Park: | 5.0% (4,078) |
| Ohio: | 3.3% (19,208) |
Number of households with income $150k - 200k:| Woodbourne-Hyde Park: | 3.0% (2,463) |
| Ohio: | 3.5% (20,047) |
Number of households with income > $200k:| Woodbourne-Hyde Park: | 2.8% (2,306) |
| State: | 2.6% (14,827) |
Aggregate household income in Woodbourne-Hyde Park in 2022: $6,399,013
Median family income in Woodbourne-Hyde Park in 2022:| Woodbourne-Hyde Park: | $80,944 |
| Ohio: | $52,966 |
Number of families with income $20k - 30k:| Woodbourne-Hyde Park: | 5.8% (4) |
| Ohio: | 9.1% (28,854) |
Number of families with income $30k - 40k:| Woodbourne-Hyde Park: | 5.6% (4) |
| State: | 9.9% (31,079) |
Number of families with income $40k - 50k:| Woodbourne-Hyde Park: | 25.1% (18) |
| State: | 9.8% (30,812) |
Number of families with income $75k - 100k:| Woodbourne-Hyde Park: | 24.1% (17) |
| State: | 12.1% (38,133) |
Number of families with income > $200k:| Woodbourne-Hyde Park: | 39.5% (28) |
| Ohio: | 4.1% (12,833) |
Median per capita income in Woodbourne-Hyde Park in 2022:| Woodbourne-Hyde Park: | $51,236 |
| Ohio: | $25,457 |
Change in median per capita income between 2000 and 2022:| Woodbourne-Hyde Park, Ohio: | +80.3% |
| State: | +75.6% |
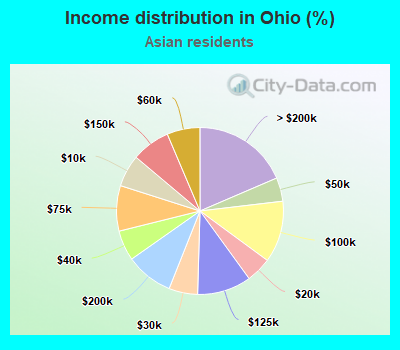
Income statistics for Asian residents
Median household income in Woodbourne-Hyde Park, OH in 2022:| Woodbourne-Hyde Park: | $225,857 |
| State: | $90,445 |
Change in median household income between 2000 and 2022:| Woodbourne-Hyde Park, Ohio: | +31.3% |
| State: | +83.6% |
Number of households with income < $10k:| Woodbourne-Hyde Park: | 6.2% (21,588) |
| Ohio: | 6.2% (6,183) |
Number of households with income $10k - 20k:| Woodbourne-Hyde Park: | 4.9% (17,098) |
| Ohio: | 4.9% (4,897) |
Number of households with income $20k - 30k:| Woodbourne-Hyde Park: | 5.6% (19,374) |
| State: | 5.6% (5,549) |
Number of households with income $30k - 40k:| Woodbourne-Hyde Park: | 5.9% (20,446) |
| Ohio: | 5.9% (5,856) |
Number of households with income $40k - 50k:| Woodbourne-Hyde Park: | 4.6% (15,980) |
| State: | 4.6% (4,577) |
Number of households with income $50k - 60k:| Woodbourne-Hyde Park: | 6.4% (22,202) |
| Ohio: | 6.4% (6,359) |
Number of households with income $60k - 75k:| Woodbourne-Hyde Park: | 8.8% (30,585) |
| State: | 8.8% (8,760) |
Number of households with income $75k - 100k:| Woodbourne-Hyde Park: | 11.9% (41,524) |
| Ohio: | 11.9% (11,893) |
Number of households with income $100k - 125k:| Woodbourne-Hyde Park: | 10.5% (36,399) |
| Ohio: | 10.5% (10,425) |
Number of households with income $125k - 150k:| Woodbourne-Hyde Park: | 7.5% (26,039) |
| State: | 7.5% (7,458) |
Number of households with income $150k - 200k:| Woodbourne-Hyde Park: | 9.2% (32,003) |
| State: | 9.2% (9,166) |
Number of households with income > $200k:| Woodbourne-Hyde Park: | 18.6% (64,508) |
| State: | 18.6% (18,476) |
Aggregate household income in Woodbourne-Hyde Park in 2022: $17,910,738
Median family income in Woodbourne-Hyde Park in 2022:| Woodbourne-Hyde Park: | $240,419 |
| Ohio: | $108,430 |
Number of families with income $50k - 60k:| Woodbourne-Hyde Park: | 5.5% (10) |
| State: | 6.3% (4,624) |
Number of families with income $100k - 125k:| Woodbourne-Hyde Park: | 13.2% (25) |
| State: | 12.0% (8,738) |
Number of families with income $150k - 200k:| Woodbourne-Hyde Park: | 25.2% (48) |
| State: | 11.0% (8,027) |
Number of families with income > $200k:| Woodbourne-Hyde Park: | 56.2% (107) |
| State: | 22.0% (16,119) |
Median per capita income in Woodbourne-Hyde Park in 2022:| Woodbourne-Hyde Park: | $66,991 |
| State: | $45,984 |
Change in median per capita income between 2000 and 2022:| Woodbourne-Hyde Park, Ohio: | +54.6% |
| State: | +84.6% |
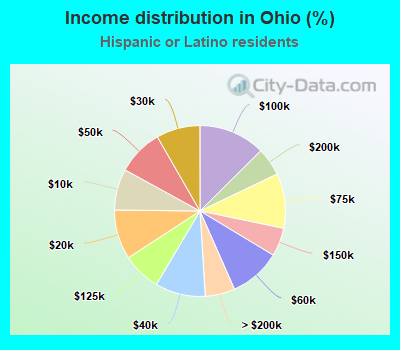
Income statistics for Hispanic or Latino residents
Median household income in Woodbourne-Hyde Park, OH in 2022:| Woodbourne-Hyde Park: | $65,325 |
| Ohio: | $55,580 |
Change in median household income between 2000 and 2022:| Woodbourne-Hyde Park, Ohio: | +55.2% |
| State: | +67.7% |
Number of households with income < $10k:| Woodbourne-Hyde Park: | 7.8% (8,062) |
| Ohio: | 7.8% (12,549) |
Number of households with income $10k - 20k:| Woodbourne-Hyde Park: | 9.5% (9,768) |
| State: | 9.4% (15,109) |
Number of households with income $20k - 30k:| Woodbourne-Hyde Park: | 8.2% (8,474) |
| State: | 8.3% (13,358) |
Number of households with income $30k - 40k:| Woodbourne-Hyde Park: | 9.5% (9,776) |
| Ohio: | 9.5% (15,327) |
Number of households with income $40k - 50k:| Woodbourne-Hyde Park: | 8.6% (8,875) |
| Ohio: | 8.7% (14,026) |
Number of households with income $50k - 60k:| Woodbourne-Hyde Park: | 9.8% (10,080) |
| Ohio: | 9.8% (15,711) |
Number of households with income $60k - 75k:| Woodbourne-Hyde Park: | 10.4% (10,647) |
| State: | 10.4% (16,676) |
Number of households with income $75k - 100k:| Woodbourne-Hyde Park: | 12.6% (12,959) |
| State: | 12.6% (20,252) |
Number of households with income $100k - 125k:| Woodbourne-Hyde Park: | 7.2% (7,423) |
| Ohio: | 7.3% (11,728) |
Number of households with income $125k - 150k:| Woodbourne-Hyde Park: | 5.3% (5,495) |
| State: | 5.4% (8,663) |
Number of households with income $150k - 200k:| Woodbourne-Hyde Park: | 5.3% (5,417) |
| State: | 5.3% (8,578) |
Number of households with income > $200k:| Woodbourne-Hyde Park: | 5.6% (5,783) |
| State: | 5.6% (9,027) |
Aggregate household income in Woodbourne-Hyde Park in 2022: $8,476,296
Median family income in Woodbourne-Hyde Park in 2022:| Woodbourne-Hyde Park: | $56,476 |
| State: | $62,957 |
Number of families with income < $10k:| Woodbourne-Hyde Park: | 0.3% (0) |
| State: | 7.9% (8,240) |
Number of families with income $10k - 20k:| Woodbourne-Hyde Park: | 1.0% (1) |
| Ohio: | 5.9% (6,156) |
Number of families with income $20k - 30k:| Woodbourne-Hyde Park: | 1.7% (2) |
| State: | 7.5% (7,821) |
Number of families with income $30k - 40k:| Woodbourne-Hyde Park: | 2.4% (3) |
| State: | 8.6% (8,995) |
Number of families with income $40k - 50k:| Woodbourne-Hyde Park: | 3.2% (3) |
| State: | 7.6% (7,936) |
Number of families with income $50k - 60k:| Woodbourne-Hyde Park: | 6.0% (7) |
| Ohio: | 9.9% (10,415) |
Number of families with income $60k - 75k:| Woodbourne-Hyde Park: | 7.1% (8) |
| Ohio: | 10.4% (10,887) |
Number of families with income $75k - 100k:| Woodbourne-Hyde Park: | 13.3% (14) |
| Ohio: | 13.6% (14,290) |
Number of families with income $100k - 125k:| Woodbourne-Hyde Park: | 16.1% (17) |
| State: | 8.8% (9,232) |
Number of families with income $125k - 150k:| Woodbourne-Hyde Park: | 12.3% (13) |
| State: | 6.2% (6,453) |
Number of families with income $150k - 200k:| Woodbourne-Hyde Park: | 15.7% (17) |
| State: | 6.7% (6,992) |
Number of families with income > $200k:| Woodbourne-Hyde Park: | 20.7% (22) |
| State: | 7.1% (7,481) |
Median per capita income in Woodbourne-Hyde Park in 2022:| Woodbourne-Hyde Park: | $59,457 |
| State: | $25,336 |
Change in median per capita income between 2000 and 2022:| Woodbourne-Hyde Park, Ohio: | +123.3% |
| State: | +87.1% |
Income statistics for American Indian and Alaska Native residents
Number of households with income < $10k:| Woodbourne-Hyde Park: | 10.5% (1,816) |
| State: | 10.5% (915) |
Number of households with income $10k - 20k:| Woodbourne-Hyde Park: | 16.8% (2,902) |
| State: | 16.8% (1,462) |
Number of households with income $20k - 30k:| Woodbourne-Hyde Park: | 12.6% (2,165) |
| State: | 12.6% (1,091) |
Number of households with income $30k - 40k:| Woodbourne-Hyde Park: | 13.3% (2,285) |
| State: | 13.3% (1,151) |
Number of households with income $40k - 50k:| Woodbourne-Hyde Park: | 9.8% (1,682) |
| State: | 9.8% (847) |
Number of households with income $50k - 60k:| Woodbourne-Hyde Park: | 5.3% (907) |
| State: | 5.3% (457) |
Number of households with income $60k - 75k:| Woodbourne-Hyde Park: | 7.2% (1,233) |
| State: | 7.2% (621) |
Number of households with income $75k - 100k:| Woodbourne-Hyde Park: | 10.8% (1,854) |
| State: | 10.8% (934) |
Number of households with income $100k - 125k:| Woodbourne-Hyde Park: | 6.8% (1,171) |
| Ohio: | 6.8% (590) |
Number of households with income $125k - 150k:| Woodbourne-Hyde Park: | 2.7% (468) |
| State: | 2.7% (236) |
Number of households with income $150k - 200k:| Woodbourne-Hyde Park: | 1.0% (171) |
| State: | 1.0% (86) |
Number of households with income > $200k:| Woodbourne-Hyde Park: | 3.4% (584) |
| Ohio: | 3.4% (294) |
Median per capita income in Woodbourne-Hyde Park in 2022:| Woodbourne-Hyde Park: | $19,261 |
| State: | $26,384 |
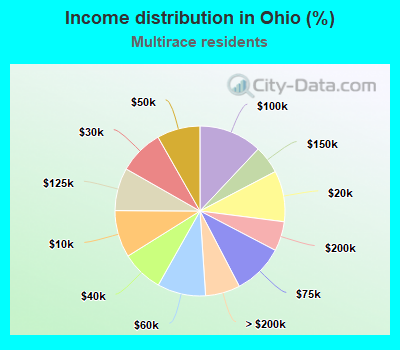
Income statistics for Multirace residents
Median household income in Woodbourne-Hyde Park, OH in 2022:| Woodbourne-Hyde Park: | $107,199 |
| Ohio: | $56,864 |
Change in median household income between 2000 and 2022:| Woodbourne-Hyde Park, Ohio: | +47.9% |
| State: | +83.2% |
Number of households with income < $10k:| Woodbourne-Hyde Park: | 4.3% (1,095) |
| State: | 9.0% (20,905) |
Number of households with income $10k - 20k:| Woodbourne-Hyde Park: | 9.9% (2,512) |
| State: | 9.7% (22,576) |
Number of households with income $20k - 30k:| Woodbourne-Hyde Park: | 7.6% (1,924) |
| State: | 8.5% (19,857) |
Number of households with income $30k - 40k:| Woodbourne-Hyde Park: | 11.5% (2,925) |
| State: | 7.9% (18,445) |
Number of households with income $40k - 50k:| Woodbourne-Hyde Park: | 18.8% (4,776) |
| State: | 8.2% (19,093) |
Number of households with income $50k - 60k:| Woodbourne-Hyde Park: | 3.7% (930) |
| Ohio: | 9.2% (21,428) |
Number of households with income $60k - 75k:| Woodbourne-Hyde Park: | 9.0% (2,288) |
| State: | 9.7% (22,502) |
Number of households with income $75k - 100k:| Woodbourne-Hyde Park: | 12.5% (3,163) |
| Ohio: | 12.0% (27,921) |
Number of households with income $100k - 125k:| Woodbourne-Hyde Park: | 5.9% (1,506) |
| State: | 8.2% (18,963) |
Number of households with income $125k - 150k:| Woodbourne-Hyde Park: | 4.1% (1,049) |
| State: | 5.3% (12,373) |
Number of households with income $150k - 200k:| Woodbourne-Hyde Park: | 2.8% (706) |
| State: | 5.6% (13,097) |
Number of households with income > $200k:| Woodbourne-Hyde Park: | 9.8% (2,496) |
| State: | 6.6% (15,364) |
Aggregate household income in Woodbourne-Hyde Park in 2022: $12,311,961
Median family income in Woodbourne-Hyde Park in 2022:| Woodbourne-Hyde Park: | $149,142 |
| Ohio: | $69,154 |
Number of families with income $50k - 60k:| Woodbourne-Hyde Park: | 2.3% (4) |
| State: | 8.2% (11,709) |
Number of families with income $75k - 100k:| Woodbourne-Hyde Park: | 97.7% (187) |
| Ohio: | 14.0% (20,063) |
Median non-family income in Woodbourne-Hyde Park in 2022:| Woodbourne-Hyde Park: | $34,513 |
| State: | $37,743 |
Change in median non-family income between 2000 and 2022:| Woodbourne-Hyde Park, Ohio: | +84.1% |
| State: | +82.6% |
Median per capita income in Woodbourne-Hyde Park in 2022:| Woodbourne-Hyde Park: | $52,513 |
| State: | $25,822 |
Change in median per capita income between 2000 and 2022:| Woodbourne-Hyde Park, Ohio: | +80.4% |
| State: | +120.8% |
Income statistics for other residents
Number of households with income < $10k:| Woodbourne-Hyde Park: | 9.1% (1,545) |
| State: | 9.0% (5,770) |
Number of households with income $10k - 20k:| Woodbourne-Hyde Park: | 8.3% (1,414) |
| State: | 8.2% (5,259) |
Number of households with income $20k - 30k:| Woodbourne-Hyde Park: | 7.2% (1,229) |
| State: | 7.2% (4,600) |
Number of households with income $30k - 40k:| Woodbourne-Hyde Park: | 8.4% (1,433) |
| Ohio: | 8.4% (5,383) |
Number of households with income $40k - 50k:| Woodbourne-Hyde Park: | 8.8% (1,499) |
| Ohio: | 8.8% (5,616) |
Number of households with income $50k - 60k:| Woodbourne-Hyde Park: | 12.8% (2,182) |
| Ohio: | 12.8% (8,181) |
Number of households with income $60k - 75k:| Woodbourne-Hyde Park: | 9.4% (1,593) |
| State: | 9.4% (5,970) |
Number of households with income $75k - 100k:| Woodbourne-Hyde Park: | 11.8% (1,999) |
| State: | 11.7% (7,463) |
Number of households with income $100k - 125k:| Woodbourne-Hyde Park: | 8.3% (1,407) |
| Ohio: | 8.3% (5,329) |
Number of households with income $125k - 150k:| Woodbourne-Hyde Park: | 3.9% (671) |
| State: | 4.0% (2,570) |
Number of households with income $150k - 200k:| Woodbourne-Hyde Park: | 6.9% (1,168) |
| State: | 6.9% (4,405) |
Number of households with income > $200k:| Woodbourne-Hyde Park: | 5.1% (859) |
| Ohio: | 5.1% (3,280) |
Median per capita income in Woodbourne-Hyde Park in 2022:| Woodbourne-Hyde Park: | $19,763 |
| Ohio: | $26,283 |