Zavalla, Texas (TX) income map, earnings map, and wages data
Data:
The per capita income in 2022 was $29,773, which means an increase of 56.2% compared to 2000 when it was $13,049.
Whole page based on the data from 2000 / 2022 when the population of Zavalla, Texas was 647 / 609
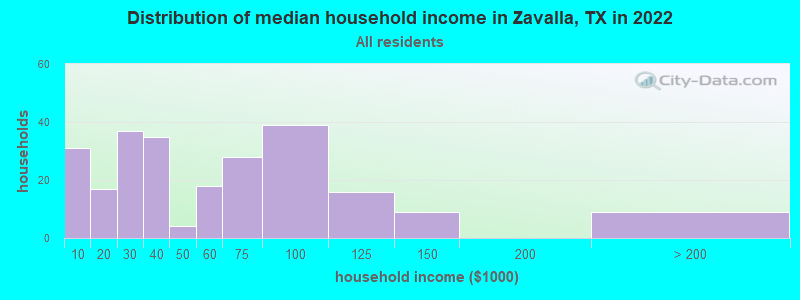
Income statistics for all residents
Number of households with income < $10k:| Zavalla: | 12.8% (31) |
| Texas: | 5.5% (611,011) |
Number of households with income $10k - 20k:| Zavalla: | 7.0% (17) |
| State: | 6.7% (743,157) |
Number of households with income $20k - 30k:| Zavalla: | 15.2% (37) |
| State: | 7.2% (803,381) |
Number of households with income $30k - 40k:| Zavalla: | 14.4% (35) |
| State: | 7.8% (866,080) |
Number of households with income $40k - 50k:| Zavalla: | 1.6% (4) |
| State: | 7.3% (810,440) |
Number of households with income $50k - 60k:| Zavalla: | 7.4% (18) |
| State: | 7.2% (799,783) |
Number of households with income $60k - 75k:| Zavalla: | 11.5% (28) |
| Texas: | 9.9% (1,095,384) |
Number of households with income $75k - 100k:| Zavalla: | 16.0% (39) |
| Texas: | 12.8% (1,419,057) |
Number of households with income $100k - 125k:| Zavalla: | 6.6% (16) |
| State: | 9.5% (1,054,577) |
Number of households with income $125k - 150k:| Zavalla: | 3.7% (9) |
| State: | 6.7% (741,518) |
Number of households with income $150k - 200k:| Zavalla: | 0.0% (0) |
| State: | 8.7% (961,776) |
Number of households with income > $200k:| Zavalla: | 3.7% (9) |
| State: | 10.7% (1,181,544) |
Aggregate household income in Zavalla in 2022: $18,052,249
Median family income in Zavalla in 2022:| Zavalla: | $36,670 |
| Texas: | $86,267 |
Number of families with income < $10k:| Zavalla: | 15.0% (22) |
| State: | 4.0% (297,884) |
Number of families with income $10k - 20k:| Zavalla: | 7.4% (11) |
| State: | 4.3% (324,514) |
Number of families with income $20k - 30k:| Zavalla: | 7.0% (10) |
| Texas: | 5.8% (430,949) |
Number of families with income $30k - 40k:| Zavalla: | 19.7% (29) |
| State: | 6.6% (493,535) |
Number of families with income $40k - 50k:| Zavalla: | 3.1% (5) |
| Texas: | 6.7% (499,663) |
Number of families with income $50k - 60k:| Zavalla: | 3.6% (5) |
| Texas: | 6.6% (492,203) |
Number of families with income $60k - 75k:| Zavalla: | 15.5% (23) |
| Texas: | 9.5% (710,229) |
Number of families with income $75k - 100k:| Zavalla: | 9.5% (14) |
| State: | 13.6% (1,015,480) |
Number of families with income $100k - 125k:| Zavalla: | 8.3% (12) |
| Texas: | 10.7% (797,961) |
Number of families with income $125k - 150k:| Zavalla: | 5.4% (8) |
| State: | 8.1% (602,985) |
Number of families with income > $200k:| Zavalla: | 5.4% (8) |
| Texas: | 13.5% (1,013,514) |
Median non-family income in Zavalla in 2022:| Zavalla: | $45,436 |
| State: | $45,999 |
Median per capita income in Zavalla in 2022:| Zavalla: | $29,773 |
| State: | $38,123 |
Change in median per capita income between 2000 and 2022:| Zavalla, Texas: | +128.2% |
| State: | +94.3% |
Income statistics for White residents
Median household income in Zavalla, TX in 2022:| Zavalla: | $52,676 |
| Texas: | $82,032 |
Change in median household income between 2000 and 2022:| Zavalla, Texas: | +131.1% |
| State: | +91.0% |
Number of households with income < $10k:| Zavalla: | 15.3% (31) |
| State: | 4.7% (273,716) |
Number of households with income $10k - 20k:| Zavalla: | 6.4% (13) |
| Texas: | 5.5% (322,702) |
Number of households with income $20k - 30k:| Zavalla: | 12.4% (25) |
| State: | 6.2% (363,947) |
Number of households with income $30k - 40k:| Zavalla: | 14.9% (30) |
| State: | 6.8% (399,275) |
Number of households with income $40k - 50k:| Zavalla: | 1.0% (2) |
| State: | 6.5% (383,417) |
Number of households with income $50k - 60k:| Zavalla: | 9.4% (19) |
| State: | 6.6% (388,535) |
Number of households with income $60k - 75k:| Zavalla: | 11.4% (23) |
| State: | 9.7% (566,295) |
Number of households with income $75k - 100k:| Zavalla: | 19.8% (40) |
| Texas: | 13.0% (760,276) |
Number of households with income $100k - 125k:| Zavalla: | 1.5% (3) |
| State: | 10.2% (597,596) |
Number of households with income $125k - 150k:| Zavalla: | 4.5% (9) |
| Texas: | 7.4% (436,830) |
Number of households with income $150k - 200k:| Zavalla: | 0.0% (0) |
| Texas: | 9.9% (583,067) |
Number of households with income > $200k:| Zavalla: | 3.5% (7) |
| Texas: | 13.5% (792,647) |
Aggregate household income in Zavalla in 2022: $14,639,143
Median family income in Zavalla in 2022:| Zavalla: | $41,044 |
| Texas: | $101,788 |
Number of families with income < $10k:| Zavalla: | 14.9% (17) |
| Texas: | 2.8% (108,142) |
Number of families with income $10k - 20k:| Zavalla: | 3.4% (4) |
| State: | 2.9% (113,421) |
Number of families with income $20k - 30k:| Zavalla: | 9.2% (10) |
| State: | 4.1% (157,688) |
Number of families with income $30k - 40k:| Zavalla: | 24.8% (28) |
| State: | 5.2% (198,847) |
Number of families with income $40k - 50k:| Zavalla: | 1.4% (2) |
| State: | 5.6% (216,490) |
Number of families with income $50k - 60k:| Zavalla: | 5.9% (7) |
| Texas: | 5.7% (220,689) |
Number of families with income $60k - 75k:| Zavalla: | 15.4% (17) |
| State: | 9.0% (346,106) |
Number of families with income $75k - 100k:| Zavalla: | 9.4% (10) |
| Texas: | 13.7% (527,363) |
Number of families with income $100k - 125k:| Zavalla: | 3.1% (3) |
| State: | 11.6% (448,411) |
Number of families with income $125k - 150k:| Zavalla: | 6.8% (8) |
| Texas: | 9.2% (355,798) |
Number of families with income > $200k:| Zavalla: | 5.7% (6) |
| State: | 17.6% (677,490) |
Median non-family income in Zavalla in 2022:| Zavalla: | $40,297 |
| State: | $50,587 |
Median per capita income in Zavalla in 2022:| Zavalla: | $29,336 |
| State: | $47,740 |
Change in median per capita income between 2000 and 2022:| Zavalla, Texas: | +124.0% |
| State: | +114.3% |
Income statistics for Hispanic or Latino residents
Aggregate household income in Zavalla in 2022: $4,749,676
Median per capita income in Zavalla in 2022:| Zavalla: | $8,243 |
| State: | $24,862 |
Income statistics for Multirace residents
Number of households with income < $10k:| Zavalla: | 12.1% (8) |
| Texas: | 5.5% (122,324) |
Number of households with income $10k - 20k:| Zavalla: | 21.2% (14) |
| State: | 8.2% (182,232) |
Number of households with income $20k - 30k:| Zavalla: | 37.9% (25) |
| Texas: | 8.5% (189,456) |
Number of households with income $30k - 40k:| Zavalla: | 0.0% (0) |
| State: | 8.9% (197,499) |
Number of households with income $40k - 50k:| Zavalla: | 0.0% (0) |
| Texas: | 8.7% (191,735) |
Number of households with income $50k - 60k:| Zavalla: | 0.0% (0) |
| State: | 8.0% (177,535) |
Number of households with income $60k - 75k:| Zavalla: | 0.0% (0) |
| Texas: | 10.5% (232,479) |
Number of households with income $75k - 100k:| Zavalla: | 0.0% (0) |
| State: | 13.1% (290,448) |
Number of households with income $100k - 125k:| Zavalla: | 28.8% (19) |
| Texas: | 8.6% (191,595) |
Number of households with income $125k - 150k:| Zavalla: | 0.0% (0) |
| Texas: | 6.0% (133,361) |
Number of households with income $150k - 200k:| Zavalla: | 0.0% (0) |
| Texas: | 7.2% (159,195) |
Number of households with income > $200k:| Zavalla: | 0.0% (0) |
| State: | 6.7% (148,064) |
Aggregate household income in Zavalla in 2022: $3,590,240
Median non-family income in Zavalla in 2022:| Zavalla: | $28,901 |
| State: | $40,634 |
Change in median non-family income between 2000 and 2022:| Zavalla, Texas: | +36.0% |
| State: | +77.2% |
Median per capita income in Zavalla in 2022:| Zavalla: | $31,144 |
| State: | $26,785 |