Norfolk, Virginia Neighborhood Map - Income, House Prices, Occupations, Boundaries
Settings
X

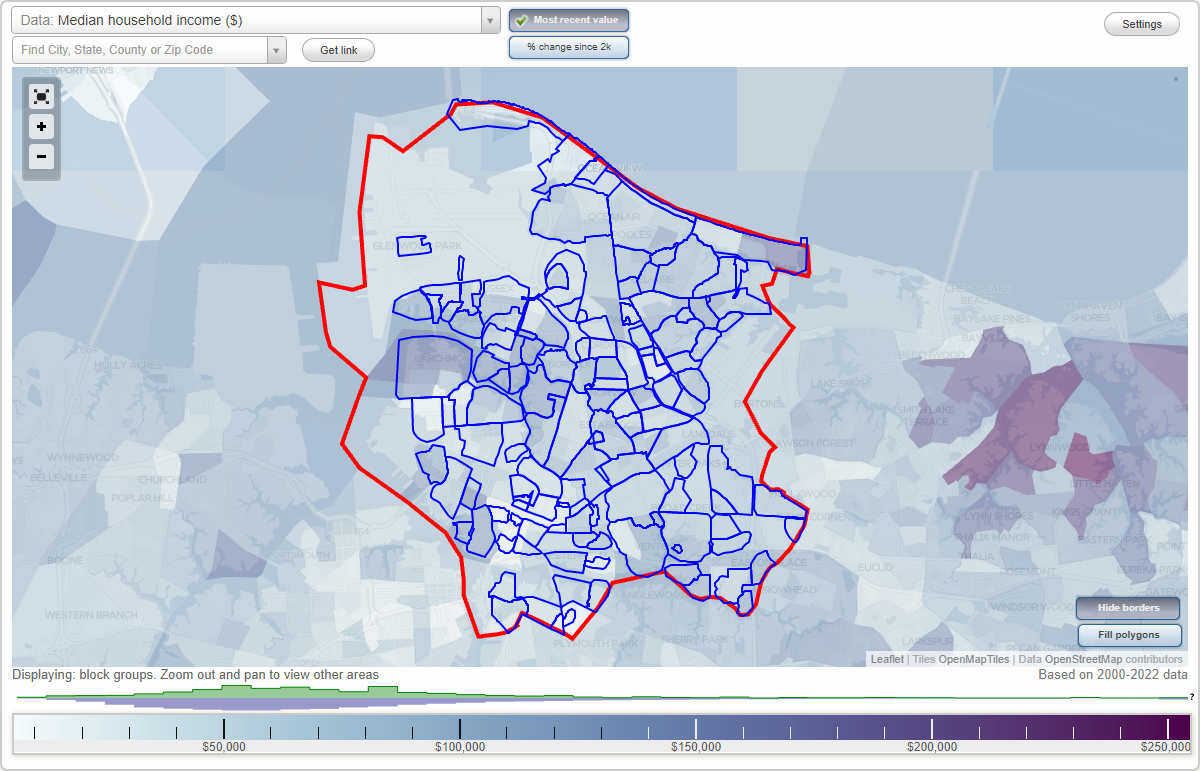
- City boundary
- Neighborhood boundaries
Business Search - 14 Million verified businesses
Neighborhoods:
Algonquin, Azalea Acres, Ballentine Place, Barberton, Bayview, Beacon Light, Bel Aire, Belvedere, Bolling Brook, Bowling Green, Brandon Place, Broad Creek, Broad Creek Shores, Bromley, Bruce's Park, Calvert Square, Camellia Gardens, Camellia Shores, Campostella, Campostella Heights, Central Brambleton, Chesapeake Gardens, Chesterfield Heights, Coleman Place, Colonial Place, Coronado-Inglenook, Cottage Heights, Cottage Line, Cottage Row Park, Cromwell Farms, Crown Point, Diggs Town, Dnc, East Belvedere, East Fairmont, East Lynne, East Ocean View, Easton Forest, Edgewater, Elizabeth Park, Elmhurst, Estabrook, Fairmont Park, First Oakmont North Townhouse Association, Ford Plant, Foxhall, Freemason Street Area Association, Ghent Neighborhood League, Ghent Square, Glengariff, Glenrock, Glenwood Park, Grandy Village, Greenhill Farms, Greenwood, Greenwood, Hardy Field, Hewitt Farms, Highland Park, Hunter's Square, Inglenook Park, Ingleside, Janaf, Lafayette, Lake Taylor, Lambert's Point, Larrymore Lawns, Lochhaven, Maple Hall, Meadowbrook, Meadowbrook Forest, Middle Towne Arch, Military Circle, Monticello Village, Newtown, Norfolk Crossing, Norfolk Garden, Norfolk Industrial Park, North Camellia Acres, North Meadow Brook, Northside, Norvella Heights, Norview, Oakdale Farms, Oakleaf Forest, Oakmont, Odu Village, Olde Huntersville, Park Crescent, Park Place, Partra, Pinewell, Pleasant Point, Poplar Halls, River Oaks, Riverfront, Riverpoint, Roberts Village, Roland Park, Roosevelt Gardens Area, Sandy Heights, Sewells Gardens, Shadywood East, Sherwood Forest, South Bayview, South Brambleton, Spartan Village, St. Andrews, Stonebridge, Suburban Acres, Talbot Park, Tanners Creek, The Gardens, Tidewater Gardens, Titustown, Villa Heights, Wards Corner, Wards Corner Business Association, Waston Place, Waters Edge, Waverly On Broad Creek, West Ghent, West Ocean View, Willoughby, Willowwood, Woodbine, Young TerraceAlgonquin neighborhood in Norfolk statistics: (Find on map)
Area: 0.248 square miles
Population: 381
Population density:
Median household income in 2021:
Median rent in in 2021:
Male vs Females
Median age
Average estimated value of detached houses in 2021 (63.1% of all units):
Most popular occupations of males: sales and office occupations (20.7%); management occupations (except farmers) (13.0%); computer and mathematical occupations (10.9%); healthcare practitioners and technical occupations (8.5%); education, training, and library occupations (8.0%); service occupations (7.7%); legal occupations (7.1%)
Most popular occupations of females: sales and office occupations (40.9%); business and financial operations occupations (11.9%); education, training, and library occupations (11.6%); management occupations (except farmers) (7.1%); service occupations (6.6%); healthcare practitioners and technical occupations (4.6%); arts, design, entertainment, sports, and media occupations (4.2%)
Roads and streets: N Shore Rd; Algonquin Rd; Holly Ln; Cohoon Rd; Chipping Rd; Gambols Ln; Woodway Ln; Diven St; Pinecroft Ln; Hedgewood Ln; Apple Tree Ln; Heron Ln; Barberry Ln; Camellia Ln; Flicker Pt; S Apple Tree Ln.
Other features: Crab Crk.
Algonquin neighborhood detailed profile
Area: 0.248 square miles
Population: 381
Population density:
| Algonquin: | 1,537 people per square mile |
| Norfolk: | 4,376 people per square mile |
Median household income in 2021:
| Algonquin: | $76,792 |
| Norfolk: | $58,591 |
Median rent in in 2021:
| Algonquin: | $1,007 |
| Norfolk: | $938 |
Male vs Females
| Males: | 201 |
| Females: | 179 |
Median age
| Males: | 35.5 years |
| Females: | 41.1 years |
Average estimated value of detached houses in 2021 (63.1% of all units):
| Algonquin: | $339,388 |
| Norfolk: | $306,640 |
Most popular occupations of males: sales and office occupations (20.7%); management occupations (except farmers) (13.0%); computer and mathematical occupations (10.9%); healthcare practitioners and technical occupations (8.5%); education, training, and library occupations (8.0%); service occupations (7.7%); legal occupations (7.1%)
Most popular occupations of females: sales and office occupations (40.9%); business and financial operations occupations (11.9%); education, training, and library occupations (11.6%); management occupations (except farmers) (7.1%); service occupations (6.6%); healthcare practitioners and technical occupations (4.6%); arts, design, entertainment, sports, and media occupations (4.2%)
Roads and streets: N Shore Rd; Algonquin Rd; Holly Ln; Cohoon Rd; Chipping Rd; Gambols Ln; Woodway Ln; Diven St; Pinecroft Ln; Hedgewood Ln; Apple Tree Ln; Heron Ln; Barberry Ln; Camellia Ln; Flicker Pt; S Apple Tree Ln.
Other features: Crab Crk.
Algonquin neighborhood detailed profile
Azalea Acres neighborhood in Norfolk statistics: (Find on map)
Area: 0.245 square miles
Population: 742
Population density:
Median household income in 2021:
Median rent in in 2021:
Male vs Females
Median age
Average estimated value of detached houses in 2021 (89.4% of all units):
Most popular occupations of males: construction, extraction, and maintenance occupations (22.7%); business and financial operations occupations (21.7%); material moving occupations (20.0%); service occupations (16.1%); transportation occupations (8.9%); architecture and engineering occupations (7.4%); sales and office occupations (7.4%)
Most popular occupations of females: service occupations (29.5%); sales and office occupations (19.0%); healthcare practitioners and technical occupations (15.0%); management occupations (except farmers) (14.4%); education, training, and library occupations (8.6%); transportation occupations (7.8%); business and financial operations occupations (3.0%)
Highways in this neighborhood: Azalea Garden Rd (State Rte 192).
Roads and streets: Gamage Dr; Terry Dr; Townley Ave; Kevin Dr; Andrea Dr; Burrell Ave; Leslie Ave; Kevin Ct; Malvern Dr; Hartwick Dr; Bradley Ave; Roper Dr; Don Dr; Budd Dr; Fletcher Dr; Finch Ave; Gamage Ct; Townley Ct; Don Ct; Modlin Ct; Budd Ct; Leslie Ct.
Other features: Lk Whitehurst.
Azalea Acres neighborhood detailed profile
Area: 0.245 square miles
Population: 742
Population density:
| Azalea Acres (Azalea Lakes): | 3,032 people per square mile |
| Norfolk: | 4,376 people per square mile |
Median household income in 2021:
| Azalea Acres (Azalea Lakes): | $53,145 |
| Norfolk: | $58,591 |
Median rent in in 2021:
| Azalea Acres (Azalea Lakes): | $821 |
| Norfolk: | $938 |
Male vs Females
| Males: | 361 |
| Females: | 380 |
Median age
| Males: | 34.6 years |
| Females: | 39.3 years |
Average estimated value of detached houses in 2021 (89.4% of all units):
| Azalea Acres (Azalea Lakes): | $208,416 |
| Norfolk: | $306,640 |
Most popular occupations of males: construction, extraction, and maintenance occupations (22.7%); business and financial operations occupations (21.7%); material moving occupations (20.0%); service occupations (16.1%); transportation occupations (8.9%); architecture and engineering occupations (7.4%); sales and office occupations (7.4%)
Most popular occupations of females: service occupations (29.5%); sales and office occupations (19.0%); healthcare practitioners and technical occupations (15.0%); management occupations (except farmers) (14.4%); education, training, and library occupations (8.6%); transportation occupations (7.8%); business and financial operations occupations (3.0%)
Highways in this neighborhood: Azalea Garden Rd (State Rte 192).
Roads and streets: Gamage Dr; Terry Dr; Townley Ave; Kevin Dr; Andrea Dr; Burrell Ave; Leslie Ave; Kevin Ct; Malvern Dr; Hartwick Dr; Bradley Ave; Roper Dr; Don Dr; Budd Dr; Fletcher Dr; Finch Ave; Gamage Ct; Townley Ct; Don Ct; Modlin Ct; Budd Ct; Leslie Ct.
Other features: Lk Whitehurst.
Azalea Acres neighborhood detailed profile
Ballentine Place neighborhood in Norfolk statistics: (Find on map)
Area: 0.527 square miles
Population: 2,916
Population density:
Median household income in 2021:
Median rent in in 2021:
Male vs Females
Median age
Housing prices:
Average estimated value of detached houses in 2021 (74.9% of all units):
Average estimated value of townhouses or other attached units in 2021 (15.0% of all units):
Average estimated '21 value of housing units in 5-or-more-unit structures (0.6% of all units):
Most popular occupations of males: sales and office occupations (25.1%); service occupations (21.0%); construction, extraction, and maintenance occupations (11.5%); healthcare practitioners and technical occupations (5.9%); production occupations (5.9%); transportation occupations (5.4%); computer and mathematical occupations (4.7%)
Most popular occupations of females: service occupations (33.8%); sales and office occupations (27.1%); management occupations (except farmers) (8.6%); education, training, and library occupations (8.6%); community and social services occupations (5.3%); healthcare practitioners and technical occupations (5.0%); business and financial operations occupations (4.9%)
Highways in this neighborhood: E Princess Anne Rd (State Rte 166).
Roads and streets: Cromwell Rd; Tait Ter; Grandy Ave; Ballentine Blvd; Vincent Ave; Keller Ave; Harrell Ave; Peterson St; Davis St; Ingleside Rd; Cape Henry Ave; Hanbury St; S Cape Henry Ave; Mc Lemore St; Dana St; Wyoming Ave; Mc Kann Ave; Nevada Ave; Arkansas Ave; Florida Ave; Tarrant St; Withers Ave; Karen Marie Ct; Tait Ct; Lafayette Blvd; Minnesota Ave.
Railroad features: Norfolk Southern Rlwy.
Ballentine Place neighborhood detailed profile
Area: 0.527 square miles
Population: 2,916
Population density:
| Ballentine Place: | 5,534 people per square mile |
| Norfolk: | 4,376 people per square mile |
Median household income in 2021:
| Ballentine Place: | $61,654 |
| Norfolk: | $58,591 |
Median rent in in 2021:
| Ballentine Place: | $925 |
| Norfolk: | $938 |
Male vs Females
| Males: | 1,563 |
| Females: | 1,353 |
Median age
| Males: | 35.6 years |
| Females: | 39.8 years |
Housing prices:
Average estimated value of detached houses in 2021 (74.9% of all units):
| Ballentine Place: | $170,239 |
| Norfolk: | $306,640 |
Average estimated value of townhouses or other attached units in 2021 (15.0% of all units):
| This neighborhood: | $207,067 |
| city: | $267,013 |
Average estimated '21 value of housing units in 5-or-more-unit structures (0.6% of all units):
| Ballentine Place: | $184,688 |
| Norfolk: | $260,910 |
Most popular occupations of males: sales and office occupations (25.1%); service occupations (21.0%); construction, extraction, and maintenance occupations (11.5%); healthcare practitioners and technical occupations (5.9%); production occupations (5.9%); transportation occupations (5.4%); computer and mathematical occupations (4.7%)
Most popular occupations of females: service occupations (33.8%); sales and office occupations (27.1%); management occupations (except farmers) (8.6%); education, training, and library occupations (8.6%); community and social services occupations (5.3%); healthcare practitioners and technical occupations (5.0%); business and financial operations occupations (4.9%)
Highways in this neighborhood: E Princess Anne Rd (State Rte 166).
Roads and streets: Cromwell Rd; Tait Ter; Grandy Ave; Ballentine Blvd; Vincent Ave; Keller Ave; Harrell Ave; Peterson St; Davis St; Ingleside Rd; Cape Henry Ave; Hanbury St; S Cape Henry Ave; Mc Lemore St; Dana St; Wyoming Ave; Mc Kann Ave; Nevada Ave; Arkansas Ave; Florida Ave; Tarrant St; Withers Ave; Karen Marie Ct; Tait Ct; Lafayette Blvd; Minnesota Ave.
Railroad features: Norfolk Southern Rlwy.
Ballentine Place neighborhood detailed profile
Barberton neighborhood in Norfolk statistics: (Find on map)
Area: 0.038 square miles
Population: 801
Population density:
Median household income in 2021:
Median rent in in 2021:
Male vs Females
Median age
Average estimated value of detached houses in 2021 (44.5% of all units):
Most popular occupations of males: management occupations (except farmers) (38.2%); material moving occupations (16.1%); computer and mathematical occupations (14.7%); construction, extraction, and maintenance occupations (12.9%); healthcare practitioners and technical occupations (5.5%); sales and office occupations (4.6%); service occupations (4.1%)
Most popular occupations of females: service occupations (36.1%); education, training, and library occupations (20.4%); sales and office occupations (20.4%); life, physical, and social science occupations (9.9%); management occupations (except farmers) (6.8%); production occupations (6.3%); material moving occupations (4.7%)
Highways in this neighborhood: State Rte 168 (Tidewater Dr).
Roads and streets: E Princess Anne Rd; Wide St; Dunn Pl; Howard Pl; Leander Dr.
Barberton neighborhood detailed profile
Area: 0.038 square miles
Population: 801
Population density:
| Barberton: | 21,291 people per square mile |
| Norfolk: | 4,376 people per square mile |
Median household income in 2021:
| Barberton: | $55,065 |
| Norfolk: | $58,591 |
Median rent in in 2021:
| Barberton: | $576 |
| Norfolk: | $938 |
Male vs Females
| Males: | 374 |
| Females: | 427 |
Median age
| Males: | 39.9 years |
| Females: | 58.0 years |
Average estimated value of detached houses in 2021 (44.5% of all units):
| Barberton: | $86,762 |
| Norfolk: | $306,640 |
Most popular occupations of males: management occupations (except farmers) (38.2%); material moving occupations (16.1%); computer and mathematical occupations (14.7%); construction, extraction, and maintenance occupations (12.9%); healthcare practitioners and technical occupations (5.5%); sales and office occupations (4.6%); service occupations (4.1%)
Most popular occupations of females: service occupations (36.1%); education, training, and library occupations (20.4%); sales and office occupations (20.4%); life, physical, and social science occupations (9.9%); management occupations (except farmers) (6.8%); production occupations (6.3%); material moving occupations (4.7%)
Highways in this neighborhood: State Rte 168 (Tidewater Dr).
Roads and streets: E Princess Anne Rd; Wide St; Dunn Pl; Howard Pl; Leander Dr.
Barberton neighborhood detailed profile
Bayview neighborhood in Norfolk statistics: (Find on map)
Area: 1.341 square miles
Population: 8,955
Population density:
Median household income in 2021:
Median rent in in 2021:
Male vs Females
Median age
Housing prices:
Average estimated value of detached houses in 2021 (57.8% of all units):
Average estimated value of townhouses or other attached units in 2021 (10.8% of all units):
Average estimated value of housing units in 2-unit structures in 2021 (16.0% of all units):
Average estimated '21 value of housing units in 3-to-4-unit structures (16.5% of all units):
Average estimated '21 value of housing units in 5-or-more-unit structures (4.0% of all units):
Most popular occupations of males: sales and office occupations (14.4%); service occupations (14.1%); construction, extraction, and maintenance occupations (11.8%); management occupations (except farmers) (9.1%); production occupations (8.3%); computer and mathematical occupations (6.7%); healthcare practitioners and technical occupations (4.8%)
Most popular occupations of females: sales and office occupations (34.8%); service occupations (16.7%); management occupations (except farmers) (8.5%); education, training, and library occupations (6.5%); computer and mathematical occupations (5.5%); transportation occupations (5.4%); healthcare practitioners and technical occupations (4.8%)
Roads and streets: E Bayview Blvd; Kingston Ave; Modoc Ave; Parkview Ave; Cape View Ave; Fishermans Rd; Sunset Dr; Virgilina Ave; Grove Ave; Devon St; Morwin St; Sturgis St; Croyden Rd; Jenifer St; Warwick Ave; Edgewood Ave; Willow Ter; Hullview Ave; Broadfield Rd; Beaumont St; N Beach View St; Hillside Ave; E Balview Ave; Garfield Dr; Portal Rd; Baychester Ave; Ramsey Rd; Ara St; Lynn River Rd; Inlet Rd; Alfred Ln; Atlans St; Pineview Ave; Sturgis Rd; Earl St; Lindale Ln; Quincy St; Calla Ave; Oak Park Ave; Brighton St; Plymouth St; Wayland St; London St; Carlton St; Beach View St; Esquire St; E Chester St; Radnor Rd; E Leicester Ave; Wilkie Rd; Kersey Ave; Chanelka Rd; Maplewood Ave; Willow Ct; Dune St; Inlet Point Rd; Primrose St; Benningfield Ct; Carlton Ct; Kearney Rd; Elm View Ave; Exeter Rd; Densmore Pl; Cape View Cres; Woodcock St; Woronoca Ave; Jane Way; Hammond Ct; Jana Ct; Toby Ln; Inwood Ave; Simpson Ct; Hastings St; Redwing Ave; Beaumont Ct; Alpine St; Whit Ave; Grove Ct; Creamer Rd; Pythian Ave; Taylors Ln; Alpine Ct; Short St; Inwood Ct; Ewing St; 1st Bay St; Marlina Ct; Poppy Ct.
Other features: Little Crk.
Bayview neighborhood detailed profile
Area: 1.341 square miles
Population: 8,955
Population density:
| Bayview: | 6,678 people per square mile |
| Norfolk: | 4,376 people per square mile |
Median household income in 2021:
| Bayview: | $62,040 |
| Norfolk: | $58,591 |
Median rent in in 2021:
| Bayview: | $969 |
| Norfolk: | $938 |
Male vs Females
| Males: | 4,473 |
| Females: | 4,481 |
Median age
| Males: | 35.6 years |
| Females: | 40.8 years |
Housing prices:
Average estimated value of detached houses in 2021 (57.8% of all units):
| Bayview: | $214,662 |
| Norfolk: | $306,640 |
Average estimated value of townhouses or other attached units in 2021 (10.8% of all units):
| This neighborhood: | $3,947,337 |
| city: | $267,013 |
Average estimated value of housing units in 2-unit structures in 2021 (16.0% of all units):
| This neighborhood: | $310,000 |
| Norfolk: | $250,782 |
Average estimated '21 value of housing units in 3-to-4-unit structures (16.5% of all units):
| Bayview: | $130,580 |
| city: | $117,518 |
Average estimated '21 value of housing units in 5-or-more-unit structures (4.0% of all units):
| Bayview: | $91,683 |
| Norfolk: | $260,910 |
Most popular occupations of males: sales and office occupations (14.4%); service occupations (14.1%); construction, extraction, and maintenance occupations (11.8%); management occupations (except farmers) (9.1%); production occupations (8.3%); computer and mathematical occupations (6.7%); healthcare practitioners and technical occupations (4.8%)
Most popular occupations of females: sales and office occupations (34.8%); service occupations (16.7%); management occupations (except farmers) (8.5%); education, training, and library occupations (6.5%); computer and mathematical occupations (5.5%); transportation occupations (5.4%); healthcare practitioners and technical occupations (4.8%)
Roads and streets: E Bayview Blvd; Kingston Ave; Modoc Ave; Parkview Ave; Cape View Ave; Fishermans Rd; Sunset Dr; Virgilina Ave; Grove Ave; Devon St; Morwin St; Sturgis St; Croyden Rd; Jenifer St; Warwick Ave; Edgewood Ave; Willow Ter; Hullview Ave; Broadfield Rd; Beaumont St; N Beach View St; Hillside Ave; E Balview Ave; Garfield Dr; Portal Rd; Baychester Ave; Ramsey Rd; Ara St; Lynn River Rd; Inlet Rd; Alfred Ln; Atlans St; Pineview Ave; Sturgis Rd; Earl St; Lindale Ln; Quincy St; Calla Ave; Oak Park Ave; Brighton St; Plymouth St; Wayland St; London St; Carlton St; Beach View St; Esquire St; E Chester St; Radnor Rd; E Leicester Ave; Wilkie Rd; Kersey Ave; Chanelka Rd; Maplewood Ave; Willow Ct; Dune St; Inlet Point Rd; Primrose St; Benningfield Ct; Carlton Ct; Kearney Rd; Elm View Ave; Exeter Rd; Densmore Pl; Cape View Cres; Woodcock St; Woronoca Ave; Jane Way; Hammond Ct; Jana Ct; Toby Ln; Inwood Ave; Simpson Ct; Hastings St; Redwing Ave; Beaumont Ct; Alpine St; Whit Ave; Grove Ct; Creamer Rd; Pythian Ave; Taylors Ln; Alpine Ct; Short St; Inwood Ct; Ewing St; 1st Bay St; Marlina Ct; Poppy Ct.
Other features: Little Crk.
Bayview neighborhood detailed profile
Beacon Light neighborhood in Norfolk statistics: (Find on map)
Area: 0.302 square miles
Population: 323
Population density:
Median household income in 2021:
Median rent in in 2021:
Male vs Females
Median age
Average estimated value of detached houses in 2021 (44.6% of all units):
Most popular occupations of males: management occupations (except farmers) (24.5%); material moving occupations (23.9%); production occupations (11.4%); arts, design, entertainment, sports, and media occupations (8.9%); business and financial operations occupations (7.4%); construction, extraction, and maintenance occupations (7.0%); sales and office occupations (6.1%)
Most popular occupations of females: material moving occupations (20.7%); service occupations (19.2%); sales and office occupations (17.0%); education, training, and library occupations (16.0%); management occupations (except farmers) (14.0%); production occupations (3.4%); healthcare practitioners and technical occupations (2.4%)
Highways in this neighborhood: State Rte 337 (Bainbridge Blvd).
Roads and streets: Obendorfer Rd.
Railroad features: Norfolk Southern Rlwy.
Roads and streets: Craig St; Louisa St; E Liberty St; Appomattox St; Walker Ave; Bainbridge Blvd; Mahone Ave; Culpepper St; Lancaster St; Rockingham St; Berkley Ave Exd; Middlesex St; Grayson St; Fauquier St; Obendorfer Rd; Fluvanna St; Buchanan St; Halifax St; S Main St; Lunenberg St; Whitehead St; Fairfield St; Barton St; Sherman Ln; Nelson St; Curtis St; Irving St; W Liberty St; Alleghany St; Cullepper St; Stafford St; E Berkley Ave; Liberty St.
Beacon Light neighborhood detailed profile
Area: 0.302 square miles
Population: 323
Population density:
| Beacon Light (Hardy Field): | 1,070 people per square mile |
| Norfolk: | 4,376 people per square mile |
Median household income in 2021:
| Beacon Light (Hardy Field): | $40,061 |
| Norfolk: | $58,591 |
Median rent in in 2021:
| Beacon Light (Hardy Field): | $811 |
| Norfolk: | $938 |
Male vs Females
| Males: | 190 |
| Females: | 132 |
Median age
| Males: | 27.0 years |
| Females: | 34.2 years |
Average estimated value of detached houses in 2021 (44.6% of all units):
| Beacon Light (Hardy Field): | $199,931 |
| Norfolk: | $306,640 |
Most popular occupations of males: management occupations (except farmers) (24.5%); material moving occupations (23.9%); production occupations (11.4%); arts, design, entertainment, sports, and media occupations (8.9%); business and financial operations occupations (7.4%); construction, extraction, and maintenance occupations (7.0%); sales and office occupations (6.1%)
Most popular occupations of females: material moving occupations (20.7%); service occupations (19.2%); sales and office occupations (17.0%); education, training, and library occupations (16.0%); management occupations (except farmers) (14.0%); production occupations (3.4%); healthcare practitioners and technical occupations (2.4%)
Highways in this neighborhood: State Rte 337 (Bainbridge Blvd).
Roads and streets: Obendorfer Rd.
Railroad features: Norfolk Southern Rlwy.
Roads and streets: Craig St; Louisa St; E Liberty St; Appomattox St; Walker Ave; Bainbridge Blvd; Mahone Ave; Culpepper St; Lancaster St; Rockingham St; Berkley Ave Exd; Middlesex St; Grayson St; Fauquier St; Obendorfer Rd; Fluvanna St; Buchanan St; Halifax St; S Main St; Lunenberg St; Whitehead St; Fairfield St; Barton St; Sherman Ln; Nelson St; Curtis St; Irving St; W Liberty St; Alleghany St; Cullepper St; Stafford St; E Berkley Ave; Liberty St.
Beacon Light neighborhood detailed profile
Bel Aire neighborhood in Norfolk statistics: (Find on map)
Area: 0.133 square miles
Population: 621
Population density:
Median household income in 2021:
Median rent in in 2021:
Male vs Females
Median age
Housing prices:
Average estimated value of detached houses in 2021 (85.8% of all units):
Average estimated value of mobile home in 2021 (7.9% of all units):
Most popular occupations of males: sales and office occupations (35.4%); business and financial operations occupations (23.3%); transportation occupations (10.7%); service occupations (8.7%); computer and mathematical occupations (6.0%); management occupations (except farmers) (5.6%); material moving occupations (3.1%)
Most popular occupations of females: management occupations (except farmers) (18.8%); healthcare practitioners and technical occupations (18.1%); education, training, and library occupations (16.1%); sales and office occupations (15.0%); community and social services occupations (13.2%); service occupations (12.0%); architecture and engineering occupations (3.9%)
Highways in this neighborhood: State Rte 170 (E Little Creek Rd).
Roads and streets: Bi County Rd; Carlton St; Elk Ave; Lion Ave; Eagle Ave; Pythian Ave; Templar Blvd; Moose Ave; Mason Ave.
Bel Aire neighborhood detailed profile
Area: 0.133 square miles
Population: 621
Population density:
| Bel Aire (South Bayview): | 4,671 people per square mile |
| Norfolk: | 4,376 people per square mile |
Median household income in 2021:
| Bel Aire (South Bayview): | $58,203 |
| Norfolk: | $58,591 |
Median rent in in 2021:
| Bel Aire (South Bayview): | $992 |
| Norfolk: | $938 |
Male vs Females
| Males: | 341 |
| Females: | 279 |
Median age
| Males: | 35.3 years |
| Females: | 43.6 years |
Housing prices:
Average estimated value of detached houses in 2021 (85.8% of all units):
| Bel Aire (South Bayview): | $287,306 |
| Norfolk: | $306,640 |
Average estimated value of mobile home in 2021 (7.9% of all units):
| Bel Aire (South Bayview): | $12,746 |
| Norfolk: | $23,245 |
Most popular occupations of males: sales and office occupations (35.4%); business and financial operations occupations (23.3%); transportation occupations (10.7%); service occupations (8.7%); computer and mathematical occupations (6.0%); management occupations (except farmers) (5.6%); material moving occupations (3.1%)
Most popular occupations of females: management occupations (except farmers) (18.8%); healthcare practitioners and technical occupations (18.1%); education, training, and library occupations (16.1%); sales and office occupations (15.0%); community and social services occupations (13.2%); service occupations (12.0%); architecture and engineering occupations (3.9%)
Highways in this neighborhood: State Rte 170 (E Little Creek Rd).
Roads and streets: Bi County Rd; Carlton St; Elk Ave; Lion Ave; Eagle Ave; Pythian Ave; Templar Blvd; Moose Ave; Mason Ave.
Bel Aire neighborhood detailed profile
Belvedere neighborhood in Norfolk statistics: (Find on map)
Area: 0.112 square miles
Population: 194
Population density:
Median household income in 2021:
Median rent in in 2021:
Male vs Females
Median age
Most popular occupations of males: legal occupations (18.8%); management occupations (except farmers) (15.9%); healthcare practitioners and technical occupations (13.1%); sales and office occupations (11.9%); architecture and engineering occupations (8.4%); service occupations (6.9%); business and financial operations occupations (6.3%)
Most popular occupations of females: education, training, and library occupations (28.6%); sales and office occupations (19.8%); management occupations (except farmers) (9.5%); service occupations (8.8%); legal occupations (8.0%); healthcare practitioners and technical occupations (7.6%); architecture and engineering occupations (5.6%)
Highways in this neighborhood: US Hwy 460 (Granby St).
Roads and streets: W Belvedere Rd; Regent Rd; Willow Grove Ct; W Severn Rd; W Arden Cir; Orchard St.
Belvedere neighborhood detailed profile
Area: 0.112 square miles
Population: 194
Population density:
| Belvedere: | 1,726 people per square mile |
| Norfolk: | 4,376 people per square mile |
Median household income in 2021:
| Belvedere: | $107,014 |
| Norfolk: | $58,591 |
Median rent in in 2021:
| Belvedere: | $1,402 |
| Norfolk: | $938 |
Male vs Females
| Males: | 101 |
| Females: | 92 |
Median age
| Males: | 38.1 years |
| Females: | 44.4 years |
Most popular occupations of males: legal occupations (18.8%); management occupations (except farmers) (15.9%); healthcare practitioners and technical occupations (13.1%); sales and office occupations (11.9%); architecture and engineering occupations (8.4%); service occupations (6.9%); business and financial operations occupations (6.3%)
Most popular occupations of females: education, training, and library occupations (28.6%); sales and office occupations (19.8%); management occupations (except farmers) (9.5%); service occupations (8.8%); legal occupations (8.0%); healthcare practitioners and technical occupations (7.6%); architecture and engineering occupations (5.6%)
Highways in this neighborhood: US Hwy 460 (Granby St).
Roads and streets: W Belvedere Rd; Regent Rd; Willow Grove Ct; W Severn Rd; W Arden Cir; Orchard St.
Belvedere neighborhood detailed profile
Bolling Brook neighborhood in Norfolk statistics: (Find on map)
Area: 0.040 square miles
Population: 262
Population density:
Median household income in 2021:
Median rent in in 2021:
Male vs Females
Median age
Most popular occupations of males: production occupations (21.3%); computer and mathematical occupations (17.7%); service occupations (16.0%); sales and office occupations (14.9%); management occupations (except farmers) (10.3%); architecture and engineering occupations (10.3%); construction, extraction, and maintenance occupations (9.7%)
Most popular occupations of females: sales and office occupations (49.1%); service occupations (18.3%); education, training, and library occupations (12.5%); management occupations (except farmers) (10.0%); material moving occupations (4.2%); arts, design, entertainment, sports, and media occupations (3.1%); community and social services occupations (2.8%)
Roads and streets: Filbert St; Seekel St; Midfield St.
Other features: Branch Wayne Crk.
Bolling Brook neighborhood detailed profile
Area: 0.040 square miles
Population: 262
Population density:
| Bolling Brook: | 6,599 people per square mile |
| Norfolk: | 4,376 people per square mile |
Median household income in 2021:
| Bolling Brook: | $36,627 |
| Norfolk: | $58,591 |
Median rent in in 2021:
| Bolling Brook: | $943 |
| Norfolk: | $938 |
Male vs Females
| Males: | 118 |
| Females: | 144 |
Median age
| Males: | 27.5 years |
| Females: | 36.2 years |
Most popular occupations of males: production occupations (21.3%); computer and mathematical occupations (17.7%); service occupations (16.0%); sales and office occupations (14.9%); management occupations (except farmers) (10.3%); architecture and engineering occupations (10.3%); construction, extraction, and maintenance occupations (9.7%)
Most popular occupations of females: sales and office occupations (49.1%); service occupations (18.3%); education, training, and library occupations (12.5%); management occupations (except farmers) (10.0%); material moving occupations (4.2%); arts, design, entertainment, sports, and media occupations (3.1%); community and social services occupations (2.8%)
Roads and streets: Filbert St; Seekel St; Midfield St.
Other features: Branch Wayne Crk.
Bolling Brook neighborhood detailed profile
Bowling Green neighborhood in Norfolk statistics: (Find on map)
Area: 0.050 square miles
Population: 509
Population density:
Median household income in 2021:
Median rent in in 2021:
Male vs Females
Median age
Most popular occupations of males: production occupations (42.4%); healthcare practitioners and technical occupations (15.0%); service occupations (12.4%); construction, extraction, and maintenance occupations (8.4%); transportation occupations (7.5%); sales and office occupations (6.9%); computer and mathematical occupations (5.4%)
Most popular occupations of females: sales and office occupations (45.7%); transportation occupations (15.6%); production occupations (15.0%); education, training, and library occupations (9.7%); service occupations (8.1%); business and financial operations occupations (5.9%)
Highways in this neighborhood: US Hwy 58 (E Virginia Beach Blvd).
Roads and streets: Godfrey Ave; Ballentine Blvd; Hollister Ave; Dogan St.
Bowling Green neighborhood detailed profile
Area: 0.050 square miles
Population: 509
Population density:
| Bowling Green: | 10,113 people per square mile |
| Norfolk: | 4,376 people per square mile |
Median household income in 2021:
| Bowling Green: | $72,571 |
| Norfolk: | $58,591 |
Median rent in in 2021:
| Bowling Green: | $1,133 |
| Norfolk: | $938 |
Male vs Females
| Males: | 301 |
| Females: | 208 |
Median age
| Males: | 32.1 years |
| Females: | 50.1 years |
Most popular occupations of males: production occupations (42.4%); healthcare practitioners and technical occupations (15.0%); service occupations (12.4%); construction, extraction, and maintenance occupations (8.4%); transportation occupations (7.5%); sales and office occupations (6.9%); computer and mathematical occupations (5.4%)
Most popular occupations of females: sales and office occupations (45.7%); transportation occupations (15.6%); production occupations (15.0%); education, training, and library occupations (9.7%); service occupations (8.1%); business and financial operations occupations (5.9%)
Highways in this neighborhood: US Hwy 58 (E Virginia Beach Blvd).
Roads and streets: Godfrey Ave; Ballentine Blvd; Hollister Ave; Dogan St.
Bowling Green neighborhood detailed profile
Brandon Place neighborhood in Norfolk statistics: (Find on map)
Area: 0.175 square miles
Population: 900
Population density:
Median household income in 2021:
Median rent in in 2021:
Male vs Females
Median age
Average estimated value of detached houses in 2021 (79.9% of all units):
Most popular occupations of males: service occupations (29.1%); education, training, and library occupations (15.2%); sales and office occupations (9.3%); architecture and engineering occupations (4.9%); construction, extraction, and maintenance occupations (4.5%); production occupations (2.9%); healthcare practitioners and technical occupations (2.4%)
Most popular occupations of females: sales and office occupations (53.3%); service occupations (19.1%); management occupations (except farmers) (13.4%); transportation occupations (7.3%); education, training, and library occupations (6.9%); computer and mathematical occupations (3.0%)
Highways in this neighborhood: .
Roads and streets: Humbolt St; Herbert St; Bell St; Norvella Ave; Texas Ave; Wellington St; Windermere Ave; Dey St; Hampshire Ave; Iowa Ave.
Brandon Place neighborhood detailed profile
Area: 0.175 square miles
Population: 900
Population density:
| Brandon Place: | 5,136 people per square mile |
| Norfolk: | 4,376 people per square mile |
Median household income in 2021:
| Brandon Place: | $41,793 |
| Norfolk: | $58,591 |
Median rent in in 2021:
| Brandon Place: | $726 |
| Norfolk: | $938 |
Male vs Females
| Males: | 387 |
| Females: | 513 |
Median age
| Males: | 39.0 years |
| Females: | 41.2 years |
Average estimated value of detached houses in 2021 (79.9% of all units):
| Brandon Place: | $484,697 |
| Norfolk: | $306,640 |
Most popular occupations of males: service occupations (29.1%); education, training, and library occupations (15.2%); sales and office occupations (9.3%); architecture and engineering occupations (4.9%); construction, extraction, and maintenance occupations (4.5%); production occupations (2.9%); healthcare practitioners and technical occupations (2.4%)
Most popular occupations of females: sales and office occupations (53.3%); service occupations (19.1%); management occupations (except farmers) (13.4%); transportation occupations (7.3%); education, training, and library occupations (6.9%); computer and mathematical occupations (3.0%)
Highways in this neighborhood: .
Roads and streets: Humbolt St; Herbert St; Bell St; Norvella Ave; Texas Ave; Wellington St; Windermere Ave; Dey St; Hampshire Ave; Iowa Ave.
Brandon Place neighborhood detailed profile
Broad Creek neighborhood in Norfolk statistics: (Find on map)
Area: 0.192 square miles
Population: 1,450
Population density:
Median household income in 2021:
Median rent in in 2021:
Male vs Females
Median age
Housing prices:
Average estimated value of detached houses in 2021 (39.1% of all units):
Average estimated value of townhouses or other attached units in 2021 (38.1% of all units):
Average estimated '21 value of housing units in 5-or-more-unit structures (57.4% of all units):
Most popular occupations of males: service occupations (59.8%); production occupations (9.4%); transportation occupations (7.7%); sales and office occupations (4.7%); healthcare practitioners and technical occupations (3.3%); construction, extraction, and maintenance occupations (2.9%); management occupations (except farmers) (1.9%)
Most popular occupations of females: sales and office occupations (41.3%); service occupations (38.8%); management occupations (except farmers) (6.2%); education, training, and library occupations (5.8%); production occupations (2.2%); transportation occupations (2.1%); healthcare practitioners and technical occupations (1.1%)
Highways in this neighborhood: US Hwy 58 (E Virginia Beach Blvd).
Roads and streets: Merrimac Ave; Mapleton Ave; Beachmont Ave; Woodland Ave; Myrtle Ave; Hollister Ave; Corprew Ave; Norchester St; Majestic Ave; Parish Rd; Oaklawn Ave; Bayne Ave; Merrimac Ct.
Broad Creek neighborhood detailed profile
Area: 0.192 square miles
Population: 1,450
Population density:
| Broad Creek: | 7,564 people per square mile |
| Norfolk: | 4,376 people per square mile |
Median household income in 2021:
| Broad Creek: | $52,868 |
| Norfolk: | $58,591 |
Median rent in in 2021:
| Broad Creek: | $672 |
| Norfolk: | $938 |
Male vs Females
| Males: | 704 |
| Females: | 746 |
Median age
| Males: | 32.5 years |
| Females: | 45.7 years |
Housing prices:
Average estimated value of detached houses in 2021 (39.1% of all units):
| Broad Creek: | $315,833 |
| Norfolk: | $306,640 |
Average estimated value of townhouses or other attached units in 2021 (38.1% of all units):
| This neighborhood: | $207,067 |
| city: | $267,013 |
Average estimated '21 value of housing units in 5-or-more-unit structures (57.4% of all units):
| Broad Creek: | $184,688 |
| Norfolk: | $260,910 |
Most popular occupations of males: service occupations (59.8%); production occupations (9.4%); transportation occupations (7.7%); sales and office occupations (4.7%); healthcare practitioners and technical occupations (3.3%); construction, extraction, and maintenance occupations (2.9%); management occupations (except farmers) (1.9%)
Most popular occupations of females: sales and office occupations (41.3%); service occupations (38.8%); management occupations (except farmers) (6.2%); education, training, and library occupations (5.8%); production occupations (2.2%); transportation occupations (2.1%); healthcare practitioners and technical occupations (1.1%)
Highways in this neighborhood: US Hwy 58 (E Virginia Beach Blvd).
Roads and streets: Merrimac Ave; Mapleton Ave; Beachmont Ave; Woodland Ave; Myrtle Ave; Hollister Ave; Corprew Ave; Norchester St; Majestic Ave; Parish Rd; Oaklawn Ave; Bayne Ave; Merrimac Ct.
Broad Creek neighborhood detailed profile
Broad Creek Shores neighborhood in Norfolk statistics: (Find on map)
Area: 0.043 square miles
Population: 57
Population density:
Median household income in 2021:
Median rent in in 2021:
Male vs Females
Median age
Most popular occupations of males: business and financial operations occupations (30.1%); sales and office occupations (20.3%); construction, extraction, and maintenance occupations (15.3%); service occupations (11.7%); management occupations (except farmers) (6.4%); transportation occupations (3.8%); healthcare practitioners and technical occupations (2.6%)
Most popular occupations of females: service occupations (33.7%); healthcare practitioners and technical occupations (14.6%); business and financial operations occupations (8.1%); production occupations (7.3%); management occupations (except farmers) (6.9%); sales and office occupations (6.2%); education, training, and library occupations (6.1%)
Broad Creek Shores neighborhood detailed profile
Area: 0.043 square miles
Population: 57
Population density:
| Broad Creek Shores: | 1,323 people per square mile |
| Norfolk: | 4,376 people per square mile |
Median household income in 2021:
| Broad Creek Shores: | $81,043 |
| Norfolk: | $58,591 |
Median rent in in 2021:
| Broad Creek Shores: | $997 |
| Norfolk: | $938 |
Male vs Females
| Males: | 34 |
| Females: | 23 |
Median age
| Males: | 36.6 years |
| Females: | 45.1 years |
Most popular occupations of males: business and financial operations occupations (30.1%); sales and office occupations (20.3%); construction, extraction, and maintenance occupations (15.3%); service occupations (11.7%); management occupations (except farmers) (6.4%); transportation occupations (3.8%); healthcare practitioners and technical occupations (2.6%)
Most popular occupations of females: service occupations (33.7%); healthcare practitioners and technical occupations (14.6%); business and financial operations occupations (8.1%); production occupations (7.3%); management occupations (except farmers) (6.9%); sales and office occupations (6.2%); education, training, and library occupations (6.1%)
Broad Creek Shores neighborhood detailed profile
Bromley neighborhood in Norfolk statistics: (Find on map)
Area: 0.172 square miles
Population: 563
Population density:
Median household income in 2021:
Median rent in in 2021:
Male vs Females
Median age
Average estimated value of detached houses in 2021 (67.4% of all units):
Most popular occupations of males: construction, extraction, and maintenance occupations (13.5%); material moving occupations (12.8%); business and financial operations occupations (9.4%); transportation occupations (8.6%); production occupations (3.4%); service occupations (2.3%); architecture and engineering occupations (2.0%)
Most popular occupations of females: service occupations (23.9%); transportation occupations (23.1%); healthcare practitioners and technical occupations (16.7%); sales and office occupations (14.7%); business and financial operations occupations (11.9%); management occupations (except farmers) (5.6%); education, training, and library occupations (2.8%)
Highways in this neighborhood: Azalea Garden Rd (State Rte 192).
Roads and streets: Norview Ave; N Lakeland Dr; S Lakeland Dr; Mc Dowell Rd; Ball Ave; Grimes Ave; Hartford Dr; Colgate Ave; Irwin Dr; Grimes Ct; Bromley Ct; Bivens Ct.
Other features: Lk Whitehurst.
Bromley neighborhood detailed profile
Area: 0.172 square miles
Population: 563
Population density:
| Bromley: | 3,271 people per square mile |
| Norfolk: | 4,376 people per square mile |
Median household income in 2021:
| Bromley: | $61,653 |
| Norfolk: | $58,591 |
Median rent in in 2021:
| Bromley: | $809 |
| Norfolk: | $938 |
Male vs Females
| Males: | 290 |
| Females: | 272 |
Median age
| Males: | 39.0 years |
| Females: | 43.0 years |
Average estimated value of detached houses in 2021 (67.4% of all units):
| Bromley: | $191,015 |
| Norfolk: | $306,640 |
Most popular occupations of males: construction, extraction, and maintenance occupations (13.5%); material moving occupations (12.8%); business and financial operations occupations (9.4%); transportation occupations (8.6%); production occupations (3.4%); service occupations (2.3%); architecture and engineering occupations (2.0%)
Most popular occupations of females: service occupations (23.9%); transportation occupations (23.1%); healthcare practitioners and technical occupations (16.7%); sales and office occupations (14.7%); business and financial operations occupations (11.9%); management occupations (except farmers) (5.6%); education, training, and library occupations (2.8%)
Highways in this neighborhood: Azalea Garden Rd (State Rte 192).
Roads and streets: Norview Ave; N Lakeland Dr; S Lakeland Dr; Mc Dowell Rd; Ball Ave; Grimes Ave; Hartford Dr; Colgate Ave; Irwin Dr; Grimes Ct; Bromley Ct; Bivens Ct.
Other features: Lk Whitehurst.
Bromley neighborhood detailed profile
Bruce's Park neighborhood in Norfolk statistics: (Find on map)
Area: 0.193 square miles
Population: 2,007
Population density:
Median household income in 2021:
Median rent in in 2021:
Male vs Females
Median age
Average estimated value of detached houses in 2021 (44.8% of all units):
Most popular occupations of males: service occupations (28.9%); healthcare practitioners and technical occupations (12.5%); production occupations (11.0%); community and social services occupations (10.6%); sales and office occupations (6.2%); material moving occupations (5.6%); life, physical, and social science occupations (2.0%)
Most popular occupations of females: service occupations (33.9%); sales and office occupations (32.6%); management occupations (except farmers) (10.2%); healthcare practitioners and technical occupations (9.6%); transportation occupations (6.3%); education, training, and library occupations (4.7%)
Roads and streets: Goff St; Maltby Ave; Marshall Ave; E Princess Anne Rd; Hanson Ave; Reservoir Ave; Cary Ave; Saint Julian Ave; Lead St; Courtney Ave; Barraud Ave; Bolton St; Jamaica Ave; Link St; Langhorne St.
Railroad features: Norfolk Southern Rlwy.
Bruce's Park neighborhood detailed profile
Area: 0.193 square miles
Population: 2,007
Population density:
| Bruce's Park: | 10,417 people per square mile |
| Norfolk: | 4,376 people per square mile |
Median household income in 2021:
| Bruce's Park: | $35,087 |
| Norfolk: | $58,591 |
Median rent in in 2021:
| Bruce's Park: | $879 |
| Norfolk: | $938 |
Male vs Females
| Males: | 842 |
| Females: | 1,164 |
Median age
| Males: | 32.3 years |
| Females: | 36.2 years |
Average estimated value of detached houses in 2021 (44.8% of all units):
| Bruce's Park: | $258,016 |
| Norfolk: | $306,640 |
Most popular occupations of males: service occupations (28.9%); healthcare practitioners and technical occupations (12.5%); production occupations (11.0%); community and social services occupations (10.6%); sales and office occupations (6.2%); material moving occupations (5.6%); life, physical, and social science occupations (2.0%)
Most popular occupations of females: service occupations (33.9%); sales and office occupations (32.6%); management occupations (except farmers) (10.2%); healthcare practitioners and technical occupations (9.6%); transportation occupations (6.3%); education, training, and library occupations (4.7%)
Roads and streets: Goff St; Maltby Ave; Marshall Ave; E Princess Anne Rd; Hanson Ave; Reservoir Ave; Cary Ave; Saint Julian Ave; Lead St; Courtney Ave; Barraud Ave; Bolton St; Jamaica Ave; Link St; Langhorne St.
Railroad features: Norfolk Southern Rlwy.
Bruce's Park neighborhood detailed profile
Calvert Square neighborhood in Norfolk statistics: (Find on map)
Area: 0.032 square miles
Population: 477
Population density:
Median household income in 2021:
Median rent in in 2021:
Male vs Females
Median age
Average estimated value of detached houses in 2021 (3.3% of all units):
Most popular occupations of males: production occupations (62.7%); service occupations (54.3%); material moving occupations (27.2%); transportation occupations (18.5%); management occupations (except farmers) (11.8%); sales and office occupations (4.2%)
Most popular occupations of females: service occupations (57.0%); sales and office occupations (29.9%); production occupations (13.1%); healthcare practitioners and technical occupations (2.4%)
Roads and streets: Bagnall Rd; Turnstall Ave.
Calvert Square neighborhood detailed profile
Area: 0.032 square miles
Population: 477
Population density:
| Calvert Square: | 14,965 people per square mile |
| Norfolk: | 4,376 people per square mile |
Median household income in 2021:
| Calvert Square: | $13,060 |
| Norfolk: | $58,591 |
Median rent in in 2021:
| Calvert Square: | $292 |
| Norfolk: | $938 |
Male vs Females
| Males: | 199 |
| Females: | 278 |
Median age
| Males: | 13.6 years |
| Females: | 28.2 years |
Average estimated value of detached houses in 2021 (3.3% of all units):
| Calvert Square: | $86,762 |
| Norfolk: | $306,640 |
Most popular occupations of males: production occupations (62.7%); service occupations (54.3%); material moving occupations (27.2%); transportation occupations (18.5%); management occupations (except farmers) (11.8%); sales and office occupations (4.2%)
Most popular occupations of females: service occupations (57.0%); sales and office occupations (29.9%); production occupations (13.1%); healthcare practitioners and technical occupations (2.4%)
Roads and streets: Bagnall Rd; Turnstall Ave.
Calvert Square neighborhood detailed profile
Camellia Gardens neighborhood in Norfolk statistics: (Find on map)
Area: 0.079 square miles
Population: 150
Population density:
Median household income in 2021:
Median rent in in 2021:
Male vs Females
Median age
Housing prices:
Average estimated value of detached houses in 2021 (54.0% of all units):
Average estimated value of townhouses or other attached units in 2021 (6.3% of all units):
Most popular occupations of males: service occupations (24.6%); business and financial operations occupations (24.1%); transportation occupations (9.9%); material moving occupations (9.8%); management occupations (except farmers) (8.9%); education, training, and library occupations (8.8%); construction, extraction, and maintenance occupations (7.5%)
Most popular occupations of females: healthcare practitioners and technical occupations (45.6%); service occupations (22.8%); production occupations (16.6%); sales and office occupations (12.7%); education, training, and library occupations (7.4%); management occupations (except farmers) (6.7%); life, physical, and social science occupations (4.0%)
Roads and streets: Camellia Rd; Pace Rd; Tidal Rd; Faber Rd; Dominion Ave; Ridgefield Dr; Creekwood Rd.
Camellia Gardens neighborhood detailed profile
Area: 0.079 square miles
Population: 150
Population density:
| Camellia Gardens: | 1,887 people per square mile |
| Norfolk: | 4,376 people per square mile |
Median household income in 2021:
| Camellia Gardens: | $84,206 |
| Norfolk: | $58,591 |
Median rent in in 2021:
| Camellia Gardens: | $1,011 |
| Norfolk: | $938 |
Male vs Females
| Males: | 60 |
| Females: | 90 |
Median age
| Males: | 39.6 years |
| Females: | 37.5 years |
Housing prices:
Average estimated value of detached houses in 2021 (54.0% of all units):
| Camellia Gardens: | $221,354 |
| Norfolk: | $306,640 |
Average estimated value of townhouses or other attached units in 2021 (6.3% of all units):
| This neighborhood: | $235,600 |
| city: | $267,013 |
Most popular occupations of males: service occupations (24.6%); business and financial operations occupations (24.1%); transportation occupations (9.9%); material moving occupations (9.8%); management occupations (except farmers) (8.9%); education, training, and library occupations (8.8%); construction, extraction, and maintenance occupations (7.5%)
Most popular occupations of females: healthcare practitioners and technical occupations (45.6%); service occupations (22.8%); production occupations (16.6%); sales and office occupations (12.7%); education, training, and library occupations (7.4%); management occupations (except farmers) (6.7%); life, physical, and social science occupations (4.0%)
Roads and streets: Camellia Rd; Pace Rd; Tidal Rd; Faber Rd; Dominion Ave; Ridgefield Dr; Creekwood Rd.
Camellia Gardens neighborhood detailed profile
Camellia Shores neighborhood in Norfolk statistics: (Find on map)
Area: 0.426 square miles
Population: 547
Population density:
Median household income in 2021:
Median rent in in 2021:
Male vs Females
Median age
Average estimated value of detached houses in 2021 (78.5% of all units):
Most popular occupations of males: management occupations (except farmers) (16.5%); sales and office occupations (15.2%); business and financial operations occupations (14.2%); construction, extraction, and maintenance occupations (13.9%); production occupations (7.1%); material moving occupations (6.8%); computer and mathematical occupations (6.5%)
Most popular occupations of females: sales and office occupations (29.9%); education, training, and library occupations (21.1%); service occupations (15.1%); business and financial operations occupations (12.7%); healthcare practitioners and technical occupations (12.3%); management occupations (except farmers) (5.3%); community and social services occupations (3.5%)
Roads and streets: Heutte Dr; Nancy Dr; Martone Rd; Murray Ave; Flowerfield Rd; Tarpon Pl; Greendale Ave; Console Ave; Flowerfield Ct; Oleo Rd; Walters Dr; Bridgette Ln; Parktown Rd; Manassas Ct; Vicksburg Ct; Bull Run Ct; Murray Ct; Woodall Rd.
Camellia Shores neighborhood detailed profile
Area: 0.426 square miles
Population: 547
Population density:
| Camellia Shores: | 1,284 people per square mile |
| Norfolk: | 4,376 people per square mile |
Median household income in 2021:
| Camellia Shores: | $86,125 |
| Norfolk: | $58,591 |
Median rent in in 2021:
| Camellia Shores: | $952 |
| Norfolk: | $938 |
Male vs Females
| Males: | 288 |
| Females: | 259 |
Median age
| Males: | 40.9 years |
| Females: | 38.8 years |
Average estimated value of detached houses in 2021 (78.5% of all units):
| Camellia Shores: | $254,716 |
| Norfolk: | $306,640 |
Most popular occupations of males: management occupations (except farmers) (16.5%); sales and office occupations (15.2%); business and financial operations occupations (14.2%); construction, extraction, and maintenance occupations (13.9%); production occupations (7.1%); material moving occupations (6.8%); computer and mathematical occupations (6.5%)
Most popular occupations of females: sales and office occupations (29.9%); education, training, and library occupations (21.1%); service occupations (15.1%); business and financial operations occupations (12.7%); healthcare practitioners and technical occupations (12.3%); management occupations (except farmers) (5.3%); community and social services occupations (3.5%)
Roads and streets: Heutte Dr; Nancy Dr; Martone Rd; Murray Ave; Flowerfield Rd; Tarpon Pl; Greendale Ave; Console Ave; Flowerfield Ct; Oleo Rd; Walters Dr; Bridgette Ln; Parktown Rd; Manassas Ct; Vicksburg Ct; Bull Run Ct; Murray Ct; Woodall Rd.
Camellia Shores neighborhood detailed profile
Campostella neighborhood in Norfolk statistics: (Find on map)
Area: 0.260 square miles
Population: 258
Population density:
Median household income in 2021:
Median rent in in 2021:
Male vs Females
Median age
Average estimated value of detached houses in 2021 (81.7% of all units):
Most popular occupations of males: service occupations (22.5%); education, training, and library occupations (17.0%); production occupations (15.9%); transportation occupations (13.8%); computer and mathematical occupations (13.4%); sales and office occupations (12.6%); healthcare practitioners and technical occupations (2.6%)
Most popular occupations of females: computer and mathematical occupations (56.7%); service occupations (30.9%); sales and office occupations (20.9%); production occupations (16.8%); community and social services occupations (12.6%); education, training, and library occupations (10.1%); transportation occupations (6.3%)
Roads and streets: Berkley Ave Exd (Berkley Ave).
Highways in this neighborhood: Wilson Rd (State Rte 166, US Hwy 460); State Rte 168 (Campostella Rd).
Roads and streets: Berkley Ave Exd (Berkley Ave); E Indian River Rd; Selden Ave; Melon St; Hatton St; Joyce St; Marsh St; Hibie St; Leake St; Roseclair St; Pike St; Covel St; Midland St; Cypress St; Manson St; Colon Ave; Conoga St; Oakfield Ave; Vine St; E Berkley Ave; Isaac St; Delevan St; Crosman Ave; Wayman St; Cass St; Todd St.
Railroad features: Norfolk Southern Rlwy.
Campostella neighborhood detailed profile
Area: 0.260 square miles
Population: 258
Population density:
| Campostella: | 994 people per square mile |
| Norfolk: | 4,376 people per square mile |
Median household income in 2021:
| Campostella: | $42,295 |
| Norfolk: | $58,591 |
Median rent in in 2021:
| Campostella: | $959 |
| Norfolk: | $938 |
Male vs Females
| Males: | 101 |
| Females: | 157 |
Median age
| Males: | 18.8 years |
| Females: | 40.3 years |
Average estimated value of detached houses in 2021 (81.7% of all units):
| Campostella: | $148,331 |
| Norfolk: | $306,640 |
Most popular occupations of males: service occupations (22.5%); education, training, and library occupations (17.0%); production occupations (15.9%); transportation occupations (13.8%); computer and mathematical occupations (13.4%); sales and office occupations (12.6%); healthcare practitioners and technical occupations (2.6%)
Most popular occupations of females: computer and mathematical occupations (56.7%); service occupations (30.9%); sales and office occupations (20.9%); production occupations (16.8%); community and social services occupations (12.6%); education, training, and library occupations (10.1%); transportation occupations (6.3%)
Roads and streets: Berkley Ave Exd (Berkley Ave).
Highways in this neighborhood: Wilson Rd (State Rte 166, US Hwy 460); State Rte 168 (Campostella Rd).
Roads and streets: Berkley Ave Exd (Berkley Ave); E Indian River Rd; Selden Ave; Melon St; Hatton St; Joyce St; Marsh St; Hibie St; Leake St; Roseclair St; Pike St; Covel St; Midland St; Cypress St; Manson St; Colon Ave; Conoga St; Oakfield Ave; Vine St; E Berkley Ave; Isaac St; Delevan St; Crosman Ave; Wayman St; Cass St; Todd St.
Railroad features: Norfolk Southern Rlwy.
Campostella neighborhood detailed profile
Campostella Heights neighborhood in Norfolk statistics: (Find on map)
Area: 0.295 square miles
Population: 233
Population density:
Median household income in 2021:
Median rent in in 2021:
Male vs Females
Median age
Average estimated value of detached houses in 2021 (86.1% of all units):
Most popular occupations of males: service occupations (27.6%); education, training, and library occupations (20.9%); production occupations (19.4%); computer and mathematical occupations (16.4%); material moving occupations (11.6%); sales and office occupations (9.0%); transportation occupations (6.7%)
Most popular occupations of females: service occupations (27.2%); computer and mathematical occupations (20.6%); production occupations (20.2%); sales and office occupations (19.1%); healthcare practitioners and technical occupations (15.8%); community and social services occupations (13.9%); education, training, and library occupations (9.2%)
Highways in this neighborhood: State Rte 168 (Campostella Rd).
Roads and streets: Springfield Ave; E Indian River Rd; Ford Dr; Montclair Ave; Oakwood St; Waltham St; Light St; Sycamore St; Princeton Ave; Canton Ave; Decker St; Eustis Ave; Arlington Ave; Campos Pl; Wheeling Ave; Mount Vernon Ave; Sycamore Ln.
Campostella Heights neighborhood detailed profile
Area: 0.295 square miles
Population: 233
Population density:
| Campostella Heights: | 790 people per square mile |
| Norfolk: | 4,376 people per square mile |
Median household income in 2021:
| Campostella Heights: | $48,894 |
| Norfolk: | $58,591 |
Median rent in in 2021:
| Campostella Heights: | $960 |
| Norfolk: | $938 |
Male vs Females
| Males: | 82 |
| Females: | 151 |
Median age
| Males: | 21.6 years |
| Females: | 50.1 years |
Average estimated value of detached houses in 2021 (86.1% of all units):
| Campostella Heights: | $149,377 |
| Norfolk: | $306,640 |
Most popular occupations of males: service occupations (27.6%); education, training, and library occupations (20.9%); production occupations (19.4%); computer and mathematical occupations (16.4%); material moving occupations (11.6%); sales and office occupations (9.0%); transportation occupations (6.7%)
Most popular occupations of females: service occupations (27.2%); computer and mathematical occupations (20.6%); production occupations (20.2%); sales and office occupations (19.1%); healthcare practitioners and technical occupations (15.8%); community and social services occupations (13.9%); education, training, and library occupations (9.2%)
Highways in this neighborhood: State Rte 168 (Campostella Rd).
Roads and streets: Springfield Ave; E Indian River Rd; Ford Dr; Montclair Ave; Oakwood St; Waltham St; Light St; Sycamore St; Princeton Ave; Canton Ave; Decker St; Eustis Ave; Arlington Ave; Campos Pl; Wheeling Ave; Mount Vernon Ave; Sycamore Ln.
Campostella Heights neighborhood detailed profile
Central Brambleton neighborhood in Norfolk statistics: (Find on map)
Area: 0.174 square miles
Population: 275
Population density:
Median household income in 2021:
Median rent in in 2021:
Male vs Females
Median age
Average estimated value of detached houses in 2021 (24.2% of all units):
Most popular occupations of males: production occupations (27.5%); service occupations (24.8%); computer and mathematical occupations (20.2%); transportation occupations (14.9%); community and social services occupations (6.0%); healthcare practitioners and technical occupations (5.2%); management occupations (except farmers) (4.9%)
Most popular occupations of females: community and social services occupations (32.2%); healthcare practitioners and technical occupations (23.0%); production occupations (16.5%); sales and office occupations (12.7%); service occupations (11.4%); transportation occupations (2.0%); education, training, and library occupations (1.9%)
Highways in this neighborhood: US Hwy 58 (E Virginia Beach Blvd); State Rte 166 (Park Ave); State Rte 168 (Tidewater Dr).
Roads and streets: E Olney Rd; Corprew Ave; Reservoir Ave; Marshall Ave; Maltby Ave; Cecelia St; May Ave; Shipp Ave; Booth St; Tabb St; Va Bch Blvd Acc Rd; Baxter St; Bond St; Hanson Ave; Cooke Ave; Brambleton Av Acc Rd; Smallwood St; Spring St.
Railroad features: Norfolk Southern Rlwy.
Central Brambleton neighborhood detailed profile
Area: 0.174 square miles
Population: 275
Population density:
| Central Brambleton: | 1,576 people per square mile |
| Norfolk: | 4,376 people per square mile |
Median household income in 2021:
| Central Brambleton: | $27,535 |
| Norfolk: | $58,591 |
Median rent in in 2021:
| Central Brambleton: | $735 |
| Norfolk: | $938 |
Male vs Females
| Males: | 142 |
| Females: | 133 |
Median age
| Males: | 29.3 years |
| Females: | 37.8 years |
Average estimated value of detached houses in 2021 (24.2% of all units):
| Central Brambleton: | $86,762 |
| Norfolk: | $306,640 |
Most popular occupations of males: production occupations (27.5%); service occupations (24.8%); computer and mathematical occupations (20.2%); transportation occupations (14.9%); community and social services occupations (6.0%); healthcare practitioners and technical occupations (5.2%); management occupations (except farmers) (4.9%)
Most popular occupations of females: community and social services occupations (32.2%); healthcare practitioners and technical occupations (23.0%); production occupations (16.5%); sales and office occupations (12.7%); service occupations (11.4%); transportation occupations (2.0%); education, training, and library occupations (1.9%)
Highways in this neighborhood: US Hwy 58 (E Virginia Beach Blvd); State Rte 166 (Park Ave); State Rte 168 (Tidewater Dr).
Roads and streets: E Olney Rd; Corprew Ave; Reservoir Ave; Marshall Ave; Maltby Ave; Cecelia St; May Ave; Shipp Ave; Booth St; Tabb St; Va Bch Blvd Acc Rd; Baxter St; Bond St; Hanson Ave; Cooke Ave; Brambleton Av Acc Rd; Smallwood St; Spring St.
Railroad features: Norfolk Southern Rlwy.
Central Brambleton neighborhood detailed profile
Chesapeake Gardens neighborhood in Norfolk statistics: (Find on map)
Area: 0.201 square miles
Population: 703
Population density:
Median household income in 2021:
Median rent in in 2021:
Male vs Females
Median age
Average estimated value of detached houses in 2021 (63.6% of all units):
Most popular occupations of males: construction, extraction, and maintenance occupations (46.5%); service occupations (17.6%); material moving occupations (11.4%); business and financial operations occupations (9.7%); production occupations (8.7%); sales and office occupations (7.9%); architecture and engineering occupations (4.2%)
Most popular occupations of females: sales and office occupations (63.6%); education, training, and library occupations (38.0%); healthcare practitioners and technical occupations (17.2%); legal occupations (15.1%); community and social services occupations (12.0%); service occupations (10.4%); material moving occupations (8.4%)
Roads and streets: Tifton St; Denison Ave; Johnstons Rd; Workwood Rd; Mamie Blvd; Lasser Dr; Gregory Dr; University Dr; Spaulding Dr; Craten Rd; Clayton Dr; Selma Ave; Minnie Ave; Chryslon Ln; Clarion Ln; Nicholes Ln; Denison Ct; Tifton Ct; Partridge St.
Chesapeake Gardens neighborhood detailed profile
Area: 0.201 square miles
Population: 703
Population density:
| Chesapeake Gardens (Mamie Homes): | 3,503 people per square mile |
| Norfolk: | 4,376 people per square mile |
Median household income in 2021:
| Chesapeake Gardens (Mamie Homes): | $49,196 |
| Norfolk: | $58,591 |
Median rent in in 2021:
| Chesapeake Gardens (Mamie Homes): | $876 |
| Norfolk: | $938 |
Male vs Females
| Males: | 399 |
| Females: | 304 |
Median age
| Males: | 35.0 years |
| Females: | 46.2 years |
Average estimated value of detached houses in 2021 (63.6% of all units):
| Chesapeake Gardens (Mamie Homes): | $181,665 |
| Norfolk: | $306,640 |
Most popular occupations of males: construction, extraction, and maintenance occupations (46.5%); service occupations (17.6%); material moving occupations (11.4%); business and financial operations occupations (9.7%); production occupations (8.7%); sales and office occupations (7.9%); architecture and engineering occupations (4.2%)
Most popular occupations of females: sales and office occupations (63.6%); education, training, and library occupations (38.0%); healthcare practitioners and technical occupations (17.2%); legal occupations (15.1%); community and social services occupations (12.0%); service occupations (10.4%); material moving occupations (8.4%)
Roads and streets: Tifton St; Denison Ave; Johnstons Rd; Workwood Rd; Mamie Blvd; Lasser Dr; Gregory Dr; University Dr; Spaulding Dr; Craten Rd; Clayton Dr; Selma Ave; Minnie Ave; Chryslon Ln; Clarion Ln; Nicholes Ln; Denison Ct; Tifton Ct; Partridge St.
Chesapeake Gardens neighborhood detailed profile
Chesterfield Heights neighborhood in Norfolk statistics: (Find on map)
Area: 0.235 square miles
Population: 759
Population density:
Median household income in 2021:
Median rent in in 2021:
Male vs Females
Median age
Average estimated value of detached houses in 2021 (51.3% of all units):
Most popular occupations of males: service occupations (44.8%); management occupations (except farmers) (14.3%); construction, extraction, and maintenance occupations (9.6%); architecture and engineering occupations (8.9%); sales and office occupations (5.1%); transportation occupations (5.1%); material moving occupations (4.8%)
Most popular occupations of females: sales and office occupations (32.1%); service occupations (22.3%); education, training, and library occupations (11.6%); material moving occupations (10.4%); architecture and engineering occupations (7.4%); business and financial operations occupations (6.7%); healthcare practitioners and technical occupations (5.1%)
Roads and streets: Kimball Ter; Westminster Ave; Marlboro Ave; Chesterfield Blvd; Norchester St; Victoria Ave; Stanhope Ave; Ballentine Blvd; Forbes St; Thayor St; Earlscourt Ave; Majestic Ave; Hydro St; Filer St; Sedgewick St; Jacob St; Odell St.
Other features: Ohio Crk.
Chesterfield Heights neighborhood detailed profile
Area: 0.235 square miles
Population: 759
Population density:
| Chesterfield Heights: | 3,224 people per square mile |
| Norfolk: | 4,376 people per square mile |
Median household income in 2021:
| Chesterfield Heights: | $45,322 |
| Norfolk: | $58,591 |
Median rent in in 2021:
| Chesterfield Heights: | $610 |
| Norfolk: | $938 |
Male vs Females
| Males: | 373 |
| Females: | 386 |
Median age
| Males: | 27.9 years |
| Females: | 32.1 years |
Average estimated value of detached houses in 2021 (51.3% of all units):
| Chesterfield Heights: | $181,546 |
| Norfolk: | $306,640 |
Most popular occupations of males: service occupations (44.8%); management occupations (except farmers) (14.3%); construction, extraction, and maintenance occupations (9.6%); architecture and engineering occupations (8.9%); sales and office occupations (5.1%); transportation occupations (5.1%); material moving occupations (4.8%)
Most popular occupations of females: sales and office occupations (32.1%); service occupations (22.3%); education, training, and library occupations (11.6%); material moving occupations (10.4%); architecture and engineering occupations (7.4%); business and financial operations occupations (6.7%); healthcare practitioners and technical occupations (5.1%)
Roads and streets: Kimball Ter; Westminster Ave; Marlboro Ave; Chesterfield Blvd; Norchester St; Victoria Ave; Stanhope Ave; Ballentine Blvd; Forbes St; Thayor St; Earlscourt Ave; Majestic Ave; Hydro St; Filer St; Sedgewick St; Jacob St; Odell St.
Other features: Ohio Crk.
Chesterfield Heights neighborhood detailed profile
Coleman Place neighborhood in Norfolk statistics: (Find on map)
Area: 0.381 square miles
Population: 2,492
Population density:
Median household income in 2021:
Median rent in in 2021:
Male vs Females
Median age
Average estimated value of detached houses in 2021 (66.5% of all units):
Most popular occupations of males: service occupations (24.1%); business and financial operations occupations (12.6%); construction, extraction, and maintenance occupations (11.4%); production occupations (11.1%); architecture and engineering occupations (10.7%); sales and office occupations (7.9%); transportation occupations (6.0%)
Most popular occupations of females: healthcare practitioners and technical occupations (34.4%); sales and office occupations (27.5%); service occupations (15.2%); business and financial operations occupations (8.2%); education, training, and library occupations (8.2%); production occupations (4.3%); computer and mathematical occupations (2.3%)
Highways in this neighborhood: E Princess Anne Rd (State Rte 166); Sewells Point Rd (State Rte 194).
Roads and streets: Denver Ave; Cape Henry Ave; S Cape Henry Ave; Minnesota Ave; Palmetto St; Aspin St; Wyoming Ave; Rush St; Azalea Garden Rd; Palmyra St; Kennon Ave; Nevada Ave; Santos St; Early St; Juniper St; Birch St; Spruce St; Hemlock St; Fairbanks Ave; Arkansas Ave; Kincaid Ave; Alder St; Florida Ave (Ingleside Rd).
Railroad features: Norfolk Southern Rlwy.
Coleman Place neighborhood detailed profile
Area: 0.381 square miles
Population: 2,492
Population density:
| Coleman Place: | 6,540 people per square mile |
| Norfolk: | 4,376 people per square mile |
Median household income in 2021:
| Coleman Place: | $61,306 |
| Norfolk: | $58,591 |
Median rent in in 2021:
| Coleman Place: | $826 |
| Norfolk: | $938 |
Male vs Females
| Males: | 1,342 |
| Females: | 1,149 |
Median age
| Males: | 43.4 years |
| Females: | 46.1 years |
Average estimated value of detached houses in 2021 (66.5% of all units):
| Coleman Place: | $185,860 |
| Norfolk: | $306,640 |
Most popular occupations of males: service occupations (24.1%); business and financial operations occupations (12.6%); construction, extraction, and maintenance occupations (11.4%); production occupations (11.1%); architecture and engineering occupations (10.7%); sales and office occupations (7.9%); transportation occupations (6.0%)
Most popular occupations of females: healthcare practitioners and technical occupations (34.4%); sales and office occupations (27.5%); service occupations (15.2%); business and financial operations occupations (8.2%); education, training, and library occupations (8.2%); production occupations (4.3%); computer and mathematical occupations (2.3%)
Highways in this neighborhood: E Princess Anne Rd (State Rte 166); Sewells Point Rd (State Rte 194).
Roads and streets: Denver Ave; Cape Henry Ave; S Cape Henry Ave; Minnesota Ave; Palmetto St; Aspin St; Wyoming Ave; Rush St; Azalea Garden Rd; Palmyra St; Kennon Ave; Nevada Ave; Santos St; Early St; Juniper St; Birch St; Spruce St; Hemlock St; Fairbanks Ave; Arkansas Ave; Kincaid Ave; Alder St; Florida Ave (Ingleside Rd).
Railroad features: Norfolk Southern Rlwy.
Coleman Place neighborhood detailed profile
Colonial Place neighborhood in Norfolk statistics: (Find on map)
Area: 0.584 square miles
Population: 3,545
Population density:
Median household income in 2021:
Median rent in in 2021:
Male vs Females
Median age
Average estimated value of detached houses in 2021 (60.4% of all units):
Most popular occupations of males: sales and office occupations (19.3%); management occupations (except farmers) (18.4%); education, training, and library occupations (15.3%); architecture and engineering occupations (10.7%); computer and mathematical occupations (6.0%); arts, design, entertainment, sports, and media occupations (5.7%); service occupations (5.7%)
Most popular occupations of females: healthcare practitioners and technical occupations (15.9%); education, training, and library occupations (14.0%); service occupations (12.2%); business and financial operations occupations (12.1%); sales and office occupations (11.6%); management occupations (except farmers) (10.4%); arts, design, entertainment, sports, and media occupations (7.6%)
Highways in this neighborhood: US Hwy 460 (Granby St).
Roads and streets: Mayflower Rd; Newport Ave (Carolina Ave); Gosnold Ave; Delaware Ave; Pennsylvania Ave; Maryland Ave; Colonial Ave; Virginia Ave; Massachusetts Ave; New York Ave; Beach Ave; Rhode Island Ave; Connecticut Ave; New Jersey Ave; New Hampshire Ave; Llewellyn Ave; Holly Ave; Columbus Ave; E 39th St; la Valette Ave; E 40th St; E 41st St; Omohundro Ave; Lucile Ave; Carolina Ave; E 42nd St; Plymouth Cres; Ethel Ave; Georgia Ave; W 42nd St; W 39th St; W 38th St; Nichal Ct.
Colonial Place neighborhood detailed profile
Area: 0.584 square miles
Population: 3,545
Population density:
| Colonial Place: | 6,073 people per square mile |
| Norfolk: | 4,376 people per square mile |
Median household income in 2021:
| Colonial Place: | $72,674 |
| Norfolk: | $58,591 |
Median rent in in 2021:
| Colonial Place: | $1,208 |
| Norfolk: | $938 |
Male vs Females
| Males: | 1,799 |
| Females: | 1,746 |
Median age
| Males: | 39.6 years |
| Females: | 43.7 years |
Average estimated value of detached houses in 2021 (60.4% of all units):
| Colonial Place: | $242,349 |
| Norfolk: | $306,640 |
Most popular occupations of males: sales and office occupations (19.3%); management occupations (except farmers) (18.4%); education, training, and library occupations (15.3%); architecture and engineering occupations (10.7%); computer and mathematical occupations (6.0%); arts, design, entertainment, sports, and media occupations (5.7%); service occupations (5.7%)
Most popular occupations of females: healthcare practitioners and technical occupations (15.9%); education, training, and library occupations (14.0%); service occupations (12.2%); business and financial operations occupations (12.1%); sales and office occupations (11.6%); management occupations (except farmers) (10.4%); arts, design, entertainment, sports, and media occupations (7.6%)
Highways in this neighborhood: US Hwy 460 (Granby St).
Roads and streets: Mayflower Rd; Newport Ave (Carolina Ave); Gosnold Ave; Delaware Ave; Pennsylvania Ave; Maryland Ave; Colonial Ave; Virginia Ave; Massachusetts Ave; New York Ave; Beach Ave; Rhode Island Ave; Connecticut Ave; New Jersey Ave; New Hampshire Ave; Llewellyn Ave; Holly Ave; Columbus Ave; E 39th St; la Valette Ave; E 40th St; E 41st St; Omohundro Ave; Lucile Ave; Carolina Ave; E 42nd St; Plymouth Cres; Ethel Ave; Georgia Ave; W 42nd St; W 39th St; W 38th St; Nichal Ct.
Colonial Place neighborhood detailed profile
Coronado-Inglenook neighborhood in Norfolk statistics: (Find on map)
Area: 0.175 square miles
Population: 980
Population density:
Median household income in 2021:
Median rent in in 2021:
Male vs Females
Median age
Average estimated value of detached houses in 2021 (96.5% of all units):
Most popular occupations of males: sales and office occupations (19.8%); transportation occupations (18.1%); service occupations (17.3%); life, physical, and social science occupations (10.5%); material moving occupations (9.7%); construction, extraction, and maintenance occupations (6.7%); production occupations (6.1%)
Most popular occupations of females: education, training, and library occupations (27.3%); sales and office occupations (24.2%); healthcare practitioners and technical occupations (16.3%); service occupations (14.5%); business and financial operations occupations (8.2%); community and social services occupations (5.8%); management occupations (except farmers) (2.3%)
Limited-access highways (interstate or state) in this neighborhood: I- 64.
Roads and streets: Marietta Ave; Philpotts Rd; Albert Ave; Widgeon Rd; Wolcott Ave; Pugh St; Sewells Point Rd; Partridge St; Pierce St; Thaxton St; Palem Rd; Minnie Ave; Gregory Dr.
Coronado-Inglenook neighborhood detailed profile
Area: 0.175 square miles
Population: 980
Population density:
| Coronado-Inglenook: | 5,602 people per square mile |
| Norfolk: | 4,376 people per square mile |
Median household income in 2021:
| Coronado-Inglenook: | $50,497 |
| Norfolk: | $58,591 |
Median rent in in 2021:
| Coronado-Inglenook: | $883 |
| Norfolk: | $938 |
Male vs Females
| Males: | 555 |
| Females: | 424 |
Median age
| Males: | 35.5 years |
| Females: | 38.4 years |
Average estimated value of detached houses in 2021 (96.5% of all units):
| Coronado-Inglenook: | $195,986 |
| Norfolk: | $306,640 |
Most popular occupations of males: sales and office occupations (19.8%); transportation occupations (18.1%); service occupations (17.3%); life, physical, and social science occupations (10.5%); material moving occupations (9.7%); construction, extraction, and maintenance occupations (6.7%); production occupations (6.1%)
Most popular occupations of females: education, training, and library occupations (27.3%); sales and office occupations (24.2%); healthcare practitioners and technical occupations (16.3%); service occupations (14.5%); business and financial operations occupations (8.2%); community and social services occupations (5.8%); management occupations (except farmers) (2.3%)
Limited-access highways (interstate or state) in this neighborhood: I- 64.
Roads and streets: Marietta Ave; Philpotts Rd; Albert Ave; Widgeon Rd; Wolcott Ave; Pugh St; Sewells Point Rd; Partridge St; Pierce St; Thaxton St; Palem Rd; Minnie Ave; Gregory Dr.
Coronado-Inglenook neighborhood detailed profile
Cottage Heights neighborhood in Norfolk statistics: (Find on map)
Area: 0.360 square miles
Population: 1,314
Population density:
Median household income in 2021:
Median rent in in 2021:
Male vs Females
Median age
Average estimated value of detached houses in 2021 (70.6% of all units):
Most popular occupations of males: service occupations (23.8%); sales and office occupations (20.9%); construction, extraction, and maintenance occupations (13.9%); material moving occupations (13.2%); business and financial operations occupations (4.2%); computer and mathematical occupations (2.9%); arts, design, entertainment, sports, and media occupations (2.7%)
Most popular occupations of females: service occupations (33.3%); sales and office occupations (32.1%); material moving occupations (6.4%); business and financial operations occupations (6.0%); management occupations (except farmers) (5.5%); transportation occupations (3.8%); production occupations (3.2%)
Highways in this neighborhood: State Rte 168 (Tidewater Dr).
Roads and streets: Rugby St; Wall St; Lindenwood Ave; Barraud Ave; Ruffin St; West Ave; Pollard St; Reservoir Ave; Middle Ave; Carona St; Hayes St; Barre St; Maltby Ave; Summit Ave; Thistle St; Cottage Ave; Ludlow St; Hale St; Hanson Ave; Courtney Ave; Masi St; Bolton St; Vista St; Saint Julian Ave; Marshall Ave; Forge St; Ann St; Lamont St; Bower St; Lead St.
Railroad features: Norfolk Southern Rlwy.
Cottage Heights neighborhood detailed profile
Area: 0.360 square miles
Population: 1,314
Population density:
| Cottage Heights (Lindenwood): | 3,649 people per square mile |
| Norfolk: | 4,376 people per square mile |
Median household income in 2021:
| Cottage Heights (Lindenwood): | $35,052 |
| Norfolk: | $58,591 |
Median rent in in 2021:
| Cottage Heights (Lindenwood): | $837 |
| Norfolk: | $938 |
Male vs Females
| Males: | 610 |
| Females: | 703 |
Median age
| Males: | 28.2 years |
| Females: | 37.6 years |
Average estimated value of detached houses in 2021 (70.6% of all units):
| Cottage Heights (Lindenwood): | $180,342 |
| Norfolk: | $306,640 |
Most popular occupations of males: service occupations (23.8%); sales and office occupations (20.9%); construction, extraction, and maintenance occupations (13.9%); material moving occupations (13.2%); business and financial operations occupations (4.2%); computer and mathematical occupations (2.9%); arts, design, entertainment, sports, and media occupations (2.7%)
Most popular occupations of females: service occupations (33.3%); sales and office occupations (32.1%); material moving occupations (6.4%); business and financial operations occupations (6.0%); management occupations (except farmers) (5.5%); transportation occupations (3.8%); production occupations (3.2%)
Highways in this neighborhood: State Rte 168 (Tidewater Dr).
Roads and streets: Rugby St; Wall St; Lindenwood Ave; Barraud Ave; Ruffin St; West Ave; Pollard St; Reservoir Ave; Middle Ave; Carona St; Hayes St; Barre St; Maltby Ave; Summit Ave; Thistle St; Cottage Ave; Ludlow St; Hale St; Hanson Ave; Courtney Ave; Masi St; Bolton St; Vista St; Saint Julian Ave; Marshall Ave; Forge St; Ann St; Lamont St; Bower St; Lead St.
Railroad features: Norfolk Southern Rlwy.
Cottage Heights neighborhood detailed profile
Cottage Line neighborhood in Norfolk statistics: (Find on map)
Area: 0.180 square miles
Population: 1,250
Population density:
Median household income in 2021:
Median rent in in 2021:
Male vs Females
Median age
Housing prices:
Average estimated value of detached houses in 2021 (32.6% of all units):
Average estimated value of townhouses or other attached units in 2021 (9.1% of all units):
Average estimated value of housing units in 2-unit structures in 2021 (10.1% of all units):
Average estimated '21 value of housing units in 3-to-4-unit structures (10.7% of all units):
Average estimated '21 value of housing units in 5-or-more-unit structures (6.8% of all units):
Most popular occupations of males: sales and office occupations (27.8%); service occupations (11.8%); construction, extraction, and maintenance occupations (10.1%); production occupations (9.0%); management occupations (except farmers) (7.3%); transportation occupations (6.6%); architecture and engineering occupations (6.5%)
Most popular occupations of females: sales and office occupations (36.3%); service occupations (19.0%); education, training, and library occupations (9.0%); material moving occupations (8.0%); management occupations (except farmers) (6.1%); transportation occupations (5.2%); healthcare practitioners and technical occupations (5.1%)
Highways in this neighborhood: US Hwy 60 (E Ocean View Ave).
Roads and streets: Cottage Pl; Beach View St Exd; Cape View Ave; Grove Ave; Chesapeake St; Inlet Rd.
Cottage Line neighborhood detailed profile
Area: 0.180 square miles
Population: 1,250
Population density:
| Cottage Line: | 6,955 people per square mile |
| Norfolk: | 4,376 people per square mile |
Median household income in 2021:
| Cottage Line: | $56,809 |
| Norfolk: | $58,591 |
Median rent in in 2021:
| Cottage Line: | $809 |
| Norfolk: | $938 |
Male vs Females
| Males: | 663 |
| Females: | 586 |
Median age
| Males: | 39.1 years |
| Females: | 43.2 years |
Housing prices:
Average estimated value of detached houses in 2021 (32.6% of all units):
| Cottage Line: | $357,563 |
| Norfolk: | $306,640 |
Average estimated value of townhouses or other attached units in 2021 (9.1% of all units):
| This neighborhood: | $528,941 |
| city: | $267,013 |
Average estimated value of housing units in 2-unit structures in 2021 (10.1% of all units):
| This neighborhood: | $160,808 |
| Norfolk: | $250,782 |
Average estimated '21 value of housing units in 3-to-4-unit structures (10.7% of all units):
| Cottage Line: | $51,798 |
| city: | $117,518 |
Average estimated '21 value of housing units in 5-or-more-unit structures (6.8% of all units):
| Cottage Line: | $209,862 |
| Norfolk: | $260,910 |
Most popular occupations of males: sales and office occupations (27.8%); service occupations (11.8%); construction, extraction, and maintenance occupations (10.1%); production occupations (9.0%); management occupations (except farmers) (7.3%); transportation occupations (6.6%); architecture and engineering occupations (6.5%)
Most popular occupations of females: sales and office occupations (36.3%); service occupations (19.0%); education, training, and library occupations (9.0%); material moving occupations (8.0%); management occupations (except farmers) (6.1%); transportation occupations (5.2%); healthcare practitioners and technical occupations (5.1%)
Highways in this neighborhood: US Hwy 60 (E Ocean View Ave).
Roads and streets: Cottage Pl; Beach View St Exd; Cape View Ave; Grove Ave; Chesapeake St; Inlet Rd.
Cottage Line neighborhood detailed profile
Cottage Row Park neighborhood in Norfolk statistics: (Find on map)
Area: 0.110 square miles
Population: 663
Population density:
Median household income in 2021:
Median rent in in 2021:
Male vs Females
Median age
Average estimated value of detached houses in 2021 (56.6% of all units):
Most popular occupations of males: sales and office occupations (52.6%); construction, extraction, and maintenance occupations (38.0%); business and financial operations occupations (8.8%); architecture and engineering occupations (2.5%)
Most popular occupations of females: healthcare practitioners and technical occupations (36.3%); sales and office occupations (32.6%); service occupations (23.7%); education, training, and library occupations (9.2%); material moving occupations (7.4%); legal occupations (3.6%); community and social services occupations (2.9%)
Highways in this neighborhood: State Rte 168 (Tidewater Dr).
Roads and streets: Gladstone Rd; Stockton Rd; Naval Base Rd; Biltmore Rd; Pennington Rd; Stanley St; Wellington Rd; Astor Cir; Jay Ct; Jean Ct; Buxby Ct.
Cottage Row Park neighborhood detailed profile
Area: 0.110 square miles
Population: 663
Population density:
| Cottage Row Park: | 6,018 people per square mile |
| Norfolk: | 4,376 people per square mile |
Median household income in 2021:
| Cottage Row Park: | $37,957 |
| Norfolk: | $58,591 |
Median rent in in 2021:
| Cottage Row Park: | $958 |
| Norfolk: | $938 |
Male vs Females
| Males: | 440 |
| Females: | 223 |
Median age
| Males: | 36.5 years |
| Females: | 28.3 years |
Average estimated value of detached houses in 2021 (56.6% of all units):
| Cottage Row Park: | $194,519 |
| Norfolk: | $306,640 |
Most popular occupations of males: sales and office occupations (52.6%); construction, extraction, and maintenance occupations (38.0%); business and financial operations occupations (8.8%); architecture and engineering occupations (2.5%)
Most popular occupations of females: healthcare practitioners and technical occupations (36.3%); sales and office occupations (32.6%); service occupations (23.7%); education, training, and library occupations (9.2%); material moving occupations (7.4%); legal occupations (3.6%); community and social services occupations (2.9%)
Highways in this neighborhood: State Rte 168 (Tidewater Dr).
Roads and streets: Gladstone Rd; Stockton Rd; Naval Base Rd; Biltmore Rd; Pennington Rd; Stanley St; Wellington Rd; Astor Cir; Jay Ct; Jean Ct; Buxby Ct.
Cottage Row Park neighborhood detailed profile
Cromwell Farms neighborhood in Norfolk statistics: (Find on map)
Area: 0.159 square miles
Population: 301
Population density:
Median household income in 2021:
Median rent in in 2021:
Male vs Females
Median age
Average estimated value of detached houses in 2021 (60.5% of all units):
Most popular occupations of males: sales and office occupations (23.6%); management occupations (except farmers) (18.3%); service occupations (9.6%); material moving occupations (8.4%); computer and mathematical occupations (7.6%); healthcare practitioners and technical occupations (6.3%); community and social services occupations (5.9%)
Most popular occupations of females: healthcare practitioners and technical occupations (30.8%); education, training, and library occupations (23.4%); management occupations (except farmers) (18.3%); computer and mathematical occupations (16.1%); sales and office occupations (9.3%); construction, extraction, and maintenance occupations (7.0%); business and financial operations occupations (6.5%)
Roads and streets: Sir Oliver Rd; N Blake Rd; S Blake Rd.
Cromwell Farms neighborhood detailed profile
Area: 0.159 square miles
Population: 301
Population density:
| Cromwell Farms: | 1,898 people per square mile |
| Norfolk: | 4,376 people per square mile |
Median household income in 2021:
| Cromwell Farms: | $104,589 |
| Norfolk: | $58,591 |
Median rent in in 2021:
| Cromwell Farms: | $253 |
| Norfolk: | $938 |
Male vs Females
| Males: | 151 |
| Females: | 149 |
Median age
| Males: | 44.4 years |
| Females: | 51.6 years |
Average estimated value of detached houses in 2021 (60.5% of all units):
| Cromwell Farms: | $199,702 |
| Norfolk: | $306,640 |
Most popular occupations of males: sales and office occupations (23.6%); management occupations (except farmers) (18.3%); service occupations (9.6%); material moving occupations (8.4%); computer and mathematical occupations (7.6%); healthcare practitioners and technical occupations (6.3%); community and social services occupations (5.9%)
Most popular occupations of females: healthcare practitioners and technical occupations (30.8%); education, training, and library occupations (23.4%); management occupations (except farmers) (18.3%); computer and mathematical occupations (16.1%); sales and office occupations (9.3%); construction, extraction, and maintenance occupations (7.0%); business and financial operations occupations (6.5%)
Roads and streets: Sir Oliver Rd; N Blake Rd; S Blake Rd.
Cromwell Farms neighborhood detailed profile
Crown Point neighborhood in Norfolk statistics: (Find on map)
Area: 0.237 square miles
Population: 804
Population density:
Median household income in 2021:
Median rent in in 2021:
Male vs Females
Median age
Most popular occupations of males: material moving occupations (29.5%); service occupations (24.1%); construction, extraction, and maintenance occupations (9.8%); transportation occupations (9.8%); sales and office occupations (9.7%); education, training, and library occupations (3.8%); computer and mathematical occupations (3.2%)
Most popular occupations of females: sales and office occupations (35.0%); healthcare practitioners and technical occupations (27.5%); service occupations (21.9%); management occupations (except farmers) (5.6%); production occupations (3.0%); material moving occupations (2.9%); education, training, and library occupations (1.9%)
Highways in this neighborhood: US Hwy 58 (E Virginia Beach Blvd).
Roads and streets: Pleasant Valley Rd; Pickett Rd; Piney Branch Rd; Harmony Rd; Raby Rd; Coach Way Dr; Bellefield Rd; Kingswell Dr; Marlfield Dr; Eastover Rd (Bellefield Rd); Typo Ave; Wyngate Dr; Eastover Cir; Old Court Dr; Greenplain Rd; Quill Rd; Piney Branch Cir; Piney Branch Ct; Typo Ln.
Other features: Broad Crk.
Crown Point neighborhood detailed profile
Area: 0.237 square miles
Population: 804
Population density:
| Crown Point: | 3,388 people per square mile |
| Norfolk: | 4,376 people per square mile |
Median household income in 2021:
| Crown Point: | $72,210 |
| Norfolk: | $58,591 |
Median rent in in 2021:
| Crown Point: | $1,085 |
| Norfolk: | $938 |
Male vs Females
| Males: | 306 |
| Females: | 498 |
Median age
| Males: | 33.9 years |
| Females: | 41.6 years |
Most popular occupations of males: material moving occupations (29.5%); service occupations (24.1%); construction, extraction, and maintenance occupations (9.8%); transportation occupations (9.8%); sales and office occupations (9.7%); education, training, and library occupations (3.8%); computer and mathematical occupations (3.2%)
Most popular occupations of females: sales and office occupations (35.0%); healthcare practitioners and technical occupations (27.5%); service occupations (21.9%); management occupations (except farmers) (5.6%); production occupations (3.0%); material moving occupations (2.9%); education, training, and library occupations (1.9%)
Highways in this neighborhood: US Hwy 58 (E Virginia Beach Blvd).
Roads and streets: Pleasant Valley Rd; Pickett Rd; Piney Branch Rd; Harmony Rd; Raby Rd; Coach Way Dr; Bellefield Rd; Kingswell Dr; Marlfield Dr; Eastover Rd (Bellefield Rd); Typo Ave; Wyngate Dr; Eastover Cir; Old Court Dr; Greenplain Rd; Quill Rd; Piney Branch Cir; Piney Branch Ct; Typo Ln.
Other features: Broad Crk.
Crown Point neighborhood detailed profile
Diggs Town neighborhood in Norfolk statistics: (Find on map)
Area: 0.058 square miles
Population: 526
Population density:
Median household income in 2021:
Male vs Females
Median age
Average estimated value of detached houses in 2021 (100.0% of all units):
Most popular occupations of males: management occupations (except farmers) (51.4%); transportation occupations (30.7%); business and financial operations occupations (14.3%); production occupations (3.6%)
Most popular occupations of females: sales and office occupations (59.6%); service occupations (36.2%); arts, design, entertainment, sports, and media occupations (4.2%)
Roads and streets: E Berkley Ave Exd (Berkley Ave Exd, Berkley Ave).
Highways in this neighborhood: State Rte 168 (Campostella Rd).
Roads and streets: Vernon Dr; Green Leaf Dr; Vine St; Cypress St; E Berkley Ave Exd (Berkley Ave Exd, Berkley Ave); Goodman St.
Diggs Town neighborhood detailed profile
Area: 0.058 square miles
Population: 526
Population density:
| Diggs Town: | 9,037 people per square mile |
| Norfolk: | 4,376 people per square mile |
Median household income in 2021:
| Diggs Town: | $74,857 |
| Norfolk: | $58,591 |
Male vs Females
| Males: | 212 |
| Females: | 313 |
Median age
| Males: | 30.4 years |
| Females: | 26.3 years |
Average estimated value of detached houses in 2021 (100.0% of all units):
| Diggs Town: | $196,696 |
| Norfolk: | $306,640 |
Most popular occupations of males: management occupations (except farmers) (51.4%); transportation occupations (30.7%); business and financial operations occupations (14.3%); production occupations (3.6%)
Most popular occupations of females: sales and office occupations (59.6%); service occupations (36.2%); arts, design, entertainment, sports, and media occupations (4.2%)
Roads and streets: E Berkley Ave Exd (Berkley Ave Exd, Berkley Ave).
Highways in this neighborhood: State Rte 168 (Campostella Rd).
Roads and streets: Vernon Dr; Green Leaf Dr; Vine St; Cypress St; E Berkley Ave Exd (Berkley Ave Exd, Berkley Ave); Goodman St.
Diggs Town neighborhood detailed profile
Dnc neighborhood in Norfolk statistics: (Find on map)
Area: 0.362 square miles
Population: 1,476
Population density:
Median household income in 2021:
Median rent in in 2021:
Male vs Females
Median age
Housing prices:
Average estimated value of detached houses in 2021 (3.3% of all units):
Average estimated value of townhouses or other attached units in 2021 (8.1% of all units):
Average estimated '21 value of housing units in 5-or-more-unit structures (37.0% of all units):
Most popular occupations of males: sales and office occupations (25.8%); business and financial operations occupations (19.9%); education, training, and library occupations (17.1%); healthcare practitioners and technical occupations (16.7%); service occupations (9.3%); production occupations (4.7%); life, physical, and social science occupations (4.0%)
Most popular occupations of females: management occupations (except farmers) (24.6%); sales and office occupations (18.7%); community and social services occupations (13.0%); business and financial operations occupations (12.5%); healthcare practitioners and technical occupations (12.1%); service occupations (9.6%); construction, extraction, and maintenance occupations (4.7%)
Highways in this neighborhood: State Rte 337 Alt (Boush St); US Hwy 58 (State Rte 337, W Brambleton Ave); State Rte 337 Alt (Waterside Dr); US Hwy 58 (State Rte 337, E Brambleton Ave).
Roads and streets: Saint Pauls Blvd; Granby St; E City Hall Ave; Monticello Ave; E Charlotte St; E Main St; E Plume St; E Freemason St; Market St; Bank St; Magazine Ln; W Olney Rd; Martins Ln; Atlantic St; Wilson Ave; E Olney Rd; Randolph St; Commercial Pl; Plume Ln; W Tazewell St; W Freemason St; Voss St; National Ln; W Bute St; College Pl; Starke St; W Plume St; W Main St; Madison Mews; Concord St; W Charlotte St; E Tazewell St; E Bute St; E Wilson Ave; W City Hall Ave; Court St; Grace St; Moseley Ln; Addison St; Union St; Brooke Ave; Berkley Brdg Acc Rd; Talbot St.
Dnc neighborhood detailed profile
Area: 0.362 square miles
Population: 1,476
Population density:
| Dnc: | 4,073 people per square mile |
| Norfolk: | 4,376 people per square mile |
Median household income in 2021:
| Dnc: | $80,673 |
| Norfolk: | $58,591 |
Median rent in in 2021:
| Dnc: | $1,556 |
| Norfolk: | $938 |
Male vs Females
| Males: | 840 |
| Females: | 636 |
Median age
| Males: | 29.7 years |
| Females: | 37.5 years |
Housing prices:
Average estimated value of detached houses in 2021 (3.3% of all units):
| Dnc: | $81,420 |
| Norfolk: | $306,640 |
Average estimated value of townhouses or other attached units in 2021 (8.1% of all units):
| This neighborhood: | $698,295 |
| city: | $267,013 |
Average estimated '21 value of housing units in 5-or-more-unit structures (37.0% of all units):
| Dnc: | $396,001 |
| Norfolk: | $260,910 |
Most popular occupations of males: sales and office occupations (25.8%); business and financial operations occupations (19.9%); education, training, and library occupations (17.1%); healthcare practitioners and technical occupations (16.7%); service occupations (9.3%); production occupations (4.7%); life, physical, and social science occupations (4.0%)
Most popular occupations of females: management occupations (except farmers) (24.6%); sales and office occupations (18.7%); community and social services occupations (13.0%); business and financial operations occupations (12.5%); healthcare practitioners and technical occupations (12.1%); service occupations (9.6%); construction, extraction, and maintenance occupations (4.7%)
Highways in this neighborhood: State Rte 337 Alt (Boush St); US Hwy 58 (State Rte 337, W Brambleton Ave); State Rte 337 Alt (Waterside Dr); US Hwy 58 (State Rte 337, E Brambleton Ave).
Roads and streets: Saint Pauls Blvd; Granby St; E City Hall Ave; Monticello Ave; E Charlotte St; E Main St; E Plume St; E Freemason St; Market St; Bank St; Magazine Ln; W Olney Rd; Martins Ln; Atlantic St; Wilson Ave; E Olney Rd; Randolph St; Commercial Pl; Plume Ln; W Tazewell St; W Freemason St; Voss St; National Ln; W Bute St; College Pl; Starke St; W Plume St; W Main St; Madison Mews; Concord St; W Charlotte St; E Tazewell St; E Bute St; E Wilson Ave; W City Hall Ave; Court St; Grace St; Moseley Ln; Addison St; Union St; Brooke Ave; Berkley Brdg Acc Rd; Talbot St.
Dnc neighborhood detailed profile
East Belvedere neighborhood in Norfolk statistics: (Find on map)
Area: 0.154 square miles
Population: 270
Population density:
Median household income in 2021:
Median rent in in 2021:
Male vs Females
Median age
Most popular occupations of males: legal occupations (17.0%); management occupations (except farmers) (16.2%); sales and office occupations (13.2%); healthcare practitioners and technical occupations (12.3%); architecture and engineering occupations (7.9%); service occupations (7.2%); business and financial operations occupations (5.8%)
Most popular occupations of females: education, training, and library occupations (28.1%); sales and office occupations (18.8%); management occupations (except farmers) (10.4%); healthcare practitioners and technical occupations (10.0%); service occupations (8.4%); legal occupations (7.2%); arts, design, entertainment, sports, and media occupations (4.8%)
Highways in this neighborhood: US Hwy 460 (Granby St).
Roads and streets: E Severn Rd; E Arden Cir; E Belvedere Rd; Willowwood Dr; Dover Cir; S Arden Cir; Dover Cir W.
East Belvedere neighborhood detailed profile
Area: 0.154 square miles
Population: 270
Population density:
| East Belvedere: | 1,752 people per square mile |
| Norfolk: | 4,376 people per square mile |
Median household income in 2021:
| East Belvedere: | $104,589 |
| Norfolk: | $58,591 |
Median rent in in 2021:
| East Belvedere: | $1,247 |
| Norfolk: | $938 |
Male vs Females
| Males: | 140 |
| Females: | 129 |
Median age
| Males: | 44.4 years |
| Females: | 51.6 years |
Most popular occupations of males: legal occupations (17.0%); management occupations (except farmers) (16.2%); sales and office occupations (13.2%); healthcare practitioners and technical occupations (12.3%); architecture and engineering occupations (7.9%); service occupations (7.2%); business and financial operations occupations (5.8%)
Most popular occupations of females: education, training, and library occupations (28.1%); sales and office occupations (18.8%); management occupations (except farmers) (10.4%); healthcare practitioners and technical occupations (10.0%); service occupations (8.4%); legal occupations (7.2%); arts, design, entertainment, sports, and media occupations (4.8%)
Highways in this neighborhood: US Hwy 460 (Granby St).
Roads and streets: E Severn Rd; E Arden Cir; E Belvedere Rd; Willowwood Dr; Dover Cir; S Arden Cir; Dover Cir W.
East Belvedere neighborhood detailed profile
East Fairmont neighborhood in Norfolk statistics: (Find on map)
Area: 0.037 square miles
Population: 235
Population density:
Median household income in 2021:
Median rent in in 2021:
Male vs Females
Median age
Average estimated value of detached houses in 2021 (81.9% of all units):
Most popular occupations of males: service occupations (23.5%); production occupations (11.9%); sales and office occupations (10.0%); architecture and engineering occupations (7.3%); community and social services occupations (6.3%); management occupations (except farmers) (4.7%); construction, extraction, and maintenance occupations (2.3%)
Most popular occupations of females: sales and office occupations (31.4%); management occupations (except farmers) (22.6%); service occupations (18.7%); business and financial operations occupations (14.4%); education, training, and library occupations (9.7%); community and social services occupations (1.8%); production occupations (1.4%)
Roads and streets: Lafayette Blvd; Upshur St; Oklahoma Ave; Montana Ave; Kansas Ave; Illinois Ave.
East Fairmont neighborhood detailed profile
Area: 0.037 square miles
Population: 235
Population density:
| East Fairmont: | 6,331 people per square mile |
| Norfolk: | 4,376 people per square mile |
Median household income in 2021:
| East Fairmont: | $71,861 |
| Norfolk: | $58,591 |
Median rent in in 2021:
| East Fairmont: | $973 |
| Norfolk: | $938 |
Male vs Females
| Males: | 116 |
| Females: | 119 |
Median age
| Males: | 30.3 years |
| Females: | 30.8 years |
Average estimated value of detached houses in 2021 (81.9% of all units):
| East Fairmont: | $151,187 |
| Norfolk: | $306,640 |
Most popular occupations of males: service occupations (23.5%); production occupations (11.9%); sales and office occupations (10.0%); architecture and engineering occupations (7.3%); community and social services occupations (6.3%); management occupations (except farmers) (4.7%); construction, extraction, and maintenance occupations (2.3%)
Most popular occupations of females: sales and office occupations (31.4%); management occupations (except farmers) (22.6%); service occupations (18.7%); business and financial operations occupations (14.4%); education, training, and library occupations (9.7%); community and social services occupations (1.8%); production occupations (1.4%)
Roads and streets: Lafayette Blvd; Upshur St; Oklahoma Ave; Montana Ave; Kansas Ave; Illinois Ave.
East Fairmont neighborhood detailed profile
East Lynne neighborhood in Norfolk statistics: (Find on map)
Area: 0.207 square miles
Population: 276
Population density:
Median household income in 2021:
Median rent in in 2021:
Male vs Females
Median age
Housing prices:
Average estimated value of detached houses in 2021 (78.7% of all units):
Average estimated value of mobile home in 2021 (4.7% of all units):
Most popular occupations of males: sales and office occupations (15.3%); management occupations (except farmers) (14.8%); construction, extraction, and maintenance occupations (12.9%); business and financial operations occupations (12.8%); production occupations (8.6%); material moving occupations (7.5%); computer and mathematical occupations (6.5%)
Most popular occupations of females: sales and office occupations (30.4%); education, training, and library occupations (20.8%); service occupations (14.4%); business and financial operations occupations (12.2%); healthcare practitioners and technical occupations (11.0%); management occupations (except farmers) (6.6%); community and social services occupations (3.1%)
Highways in this neighborhood: Azalea Garden Rd (State Rte 192); State Rte 170 (E Little Creek Rd).
Roads and streets: Leafwood Dr; Jasper Ct; Tullibee Dr; Stribling Ln; Everglades Rd; Heutte Dr; Blueberry Rd; Mimosa Rd; Sea Wolf Dr; Borb Ave; Jasper Cir.
East Lynne neighborhood detailed profile
Area: 0.207 square miles
Population: 276
Population density:
| East Lynne (Saratoga): | 1,333 people per square mile |
| Norfolk: | 4,376 people per square mile |
Median household income in 2021:
| East Lynne (Saratoga): | $81,688 |
| Norfolk: | $58,591 |
Median rent in in 2021:
| East Lynne (Saratoga): | $928 |
| Norfolk: | $938 |
Male vs Females
| Males: | 144 |
| Females: | 131 |
Median age
| Males: | 46.0 years |
| Females: | 48.4 years |
Housing prices:
Average estimated value of detached houses in 2021 (78.7% of all units):
| East Lynne (Saratoga): | $261,199 |
| Norfolk: | $306,640 |
Average estimated value of mobile home in 2021 (4.7% of all units):
| East Lynne (Saratoga): | $12,746 |
| Norfolk: | $23,245 |
Most popular occupations of males: sales and office occupations (15.3%); management occupations (except farmers) (14.8%); construction, extraction, and maintenance occupations (12.9%); business and financial operations occupations (12.8%); production occupations (8.6%); material moving occupations (7.5%); computer and mathematical occupations (6.5%)
Most popular occupations of females: sales and office occupations (30.4%); education, training, and library occupations (20.8%); service occupations (14.4%); business and financial operations occupations (12.2%); healthcare practitioners and technical occupations (11.0%); management occupations (except farmers) (6.6%); community and social services occupations (3.1%)
Highways in this neighborhood: Azalea Garden Rd (State Rte 192); State Rte 170 (E Little Creek Rd).
Roads and streets: Leafwood Dr; Jasper Ct; Tullibee Dr; Stribling Ln; Everglades Rd; Heutte Dr; Blueberry Rd; Mimosa Rd; Sea Wolf Dr; Borb Ave; Jasper Cir.
East Lynne neighborhood detailed profile
East Ocean View neighborhood in Norfolk statistics: (Find on map)
Area: 1.070 square miles
Population: 3,891
Population density:
Median household income in 2021:
Median rent in in 2021:
Male vs Females
Median age
Housing prices:
Average estimated value of detached houses in 2021 (34.9% of all units):
Average estimated value of townhouses or other attached units in 2021 (14.5% of all units):
Average estimated value of housing units in 2-unit structures in 2021 (26.2% of all units):
Average estimated '21 value of housing units in 5-or-more-unit structures (35.4% of all units):
Most popular occupations of males: service occupations (21.7%); construction, extraction, and maintenance occupations (14.6%); management occupations (except farmers) (11.6%); business and financial operations occupations (9.7%); sales and office occupations (8.0%); production occupations (7.3%); healthcare practitioners and technical occupations (4.6%)
Most popular occupations of females: management occupations (except farmers) (24.0%); healthcare practitioners and technical occupations (22.1%); sales and office occupations (18.4%); service occupations (10.9%); business and financial operations occupations (5.5%); legal occupations (5.3%); community and social services occupations (4.0%)
Highways in this neighborhood: US Hwy 60 (E Ocean View Ave); Shore Dr (US Hwy 60).
Roads and streets: Pleasant Ave; Pretty Lake Ave; 17th Bay St; 30th Bay St; 13th Bay St; 15th Bay St; 7th Bay St; 29th Bay St; 28th Bay St; Bay Oaks Pl; Bayside Ave; 6th Bay St; 11th Bay St; 27th Bay St; Marina Dr; 26th Bay St; Bay Front Dr; 14th Bay St; 25th Bay St; 20th Bay St; 18th Bay St; 8th Bay St; 19th Bay St; 24th Bay St; 3rd Bay St; 9th Bay St; 4th Bay St; 21st Bay St; Bay Point Dr; 12th Bay St; 10th Bay St; 16th Bay St; 23rd Bay St; 5th Bay St; 22nd Bay St; 2nd Bay St; Mooring Dr; Spy Glass Dr; Bath St; Ocean Way.
Other features: Little Crk.
East Ocean View neighborhood detailed profile
Area: 1.070 square miles
Population: 3,891
Population density:
| East Ocean View: | 3,635 people per square mile |
| Norfolk: | 4,376 people per square mile |
Median household income in 2021:
| East Ocean View: | $78,397 |
| Norfolk: | $58,591 |
Median rent in in 2021:
| East Ocean View: | $1,126 |
| Norfolk: | $938 |
Male vs Females
| Males: | 1,866 |
| Females: | 2,024 |
Median age
| Males: | 38.1 years |
| Females: | 35.3 years |
Housing prices:
Average estimated value of detached houses in 2021 (34.9% of all units):
| East Ocean View: | $580,182 |
| Norfolk: | $306,640 |
Average estimated value of townhouses or other attached units in 2021 (14.5% of all units):
| This neighborhood: | $415,276 |
| city: | $267,013 |
Average estimated value of housing units in 2-unit structures in 2021 (26.2% of all units):
| This neighborhood: | $166,025 |
| Norfolk: | $250,782 |
Average estimated '21 value of housing units in 5-or-more-unit structures (35.4% of all units):
| East Ocean View: | $90,255 |
| Norfolk: | $260,910 |
Most popular occupations of males: service occupations (21.7%); construction, extraction, and maintenance occupations (14.6%); management occupations (except farmers) (11.6%); business and financial operations occupations (9.7%); sales and office occupations (8.0%); production occupations (7.3%); healthcare practitioners and technical occupations (4.6%)
Most popular occupations of females: management occupations (except farmers) (24.0%); healthcare practitioners and technical occupations (22.1%); sales and office occupations (18.4%); service occupations (10.9%); business and financial operations occupations (5.5%); legal occupations (5.3%); community and social services occupations (4.0%)
Highways in this neighborhood: US Hwy 60 (E Ocean View Ave); Shore Dr (US Hwy 60).
Roads and streets: Pleasant Ave; Pretty Lake Ave; 17th Bay St; 30th Bay St; 13th Bay St; 15th Bay St; 7th Bay St; 29th Bay St; 28th Bay St; Bay Oaks Pl; Bayside Ave; 6th Bay St; 11th Bay St; 27th Bay St; Marina Dr; 26th Bay St; Bay Front Dr; 14th Bay St; 25th Bay St; 20th Bay St; 18th Bay St; 8th Bay St; 19th Bay St; 24th Bay St; 3rd Bay St; 9th Bay St; 4th Bay St; 21st Bay St; Bay Point Dr; 12th Bay St; 10th Bay St; 16th Bay St; 23rd Bay St; 5th Bay St; 22nd Bay St; 2nd Bay St; Mooring Dr; Spy Glass Dr; Bath St; Ocean Way.
Other features: Little Crk.
East Ocean View neighborhood detailed profile
Easton Forest neighborhood in Norfolk statistics: (Find on map)
Area: 0.175 square miles
Population: 708
Population density:
Median household income in 2021:
Median rent in in 2021:
Male vs Females
Median age
Housing prices:
Average estimated value of detached houses in 2021 (87.4% of all units):
Average estimated value of townhouses or other attached units in 2021 (6.3% of all units):
Most popular occupations of males: legal occupations (14.3%); production occupations (12.9%); architecture and engineering occupations (11.4%); computer and mathematical occupations (9.9%); construction, extraction, and maintenance occupations (7.2%); sales and office occupations (6.9%); material moving occupations (4.9%)
Most popular occupations of females: service occupations (36.5%); community and social services occupations (10.8%); sales and office occupations (10.8%); production occupations (9.4%); healthcare practitioners and technical occupations (8.7%); arts, design, entertainment, sports, and media occupations (7.6%); material moving occupations (3.5%)
Roads and streets: Curlew Dr; S Newtown Rd; Edison Ave; Abilene Ave; Ivor Ave; Stephenson Ave; Newark Ave; Houston Ave; Foresttown Dr; Lyndhurst Ave; Bristol Ave; Amarillo Ave; Bangor Ave; Cleveland St; Blackstone St.
Railroad features: Norfolk Southern Rlwy.
Roads and streets: S Newtown Rd.
Easton Forest neighborhood detailed profile
Area: 0.175 square miles
Population: 708
Population density:
| Easton Forest: | 4,047 people per square mile |
| Norfolk: | 4,376 people per square mile |
Median household income in 2021:
| Easton Forest: | $72,057 |
| Norfolk: | $58,591 |
Median rent in in 2021:
| Easton Forest: | $1,421 |
| Norfolk: | $938 |
Male vs Females
| Males: | 355 |
| Females: | 352 |
Median age
| Males: | 33.3 years |
| Females: | 40.3 years |
Housing prices:
Average estimated value of detached houses in 2021 (87.4% of all units):
| Easton Forest: | $269,405 |
| Norfolk: | $306,640 |
Average estimated value of townhouses or other attached units in 2021 (6.3% of all units):
| This neighborhood: | $169,963 |
| city: | $267,013 |
Most popular occupations of males: legal occupations (14.3%); production occupations (12.9%); architecture and engineering occupations (11.4%); computer and mathematical occupations (9.9%); construction, extraction, and maintenance occupations (7.2%); sales and office occupations (6.9%); material moving occupations (4.9%)
Most popular occupations of females: service occupations (36.5%); community and social services occupations (10.8%); sales and office occupations (10.8%); production occupations (9.4%); healthcare practitioners and technical occupations (8.7%); arts, design, entertainment, sports, and media occupations (7.6%); material moving occupations (3.5%)
Roads and streets: Curlew Dr; S Newtown Rd; Edison Ave; Abilene Ave; Ivor Ave; Stephenson Ave; Newark Ave; Houston Ave; Foresttown Dr; Lyndhurst Ave; Bristol Ave; Amarillo Ave; Bangor Ave; Cleveland St; Blackstone St.
Railroad features: Norfolk Southern Rlwy.
Roads and streets: S Newtown Rd.
Easton Forest neighborhood detailed profile
Edgewater neighborhood in Norfolk statistics: (Find on map)
Area: 1.464 square miles
Population: 4,974
Population density:
Median household income in 2021:
Median rent in in 2021:
Male vs Females
Median age
Housing prices:
Average estimated value of detached houses in 2021 (69.9% of all units):
Average estimated value of townhouses or other attached units in 2021 (17.4% of all units):
Average estimated '21 value of housing units in 5-or-more-unit structures (42.7% of all units):
Most popular occupations of males: sales and office occupations (17.2%); service occupations (15.1%); education, training, and library occupations (12.5%); management occupations (except farmers) (10.0%); business and financial operations occupations (6.9%); architecture and engineering occupations (6.9%); legal occupations (6.2%)
Most popular occupations of females: sales and office occupations (21.6%); healthcare practitioners and technical occupations (15.9%); education, training, and library occupations (15.3%); service occupations (12.7%); management occupations (except farmers) (9.2%); community and social services occupations (8.1%); business and financial operations occupations (5.5%)
Highways in this neighborhood: Hampton Blvd (State Rte 337).
Roads and streets: Bolling Ave; Buckingham Ave; Westmoreland Ave; Magnolia Ave; Melrose Pkwy; Powhatan Ave; Rockbridge Ave; Brunswick Ave; Monroe Pl; Manchester Ave; Jamestown Cres; Longwood Dr; Rolfe Ave; Studeley Ave; Upper Brandon Pl; Hanover Ave; Cedar Ln; Larchmont Cres; Cambridge Cres; Edgewater Dr; Carillo Ave; Surrey Cres; Richmond Cres; Monterey Ave; Cambridge Pl; Wythe Pl; Glenhaven Cres; Argall Ave; Cornwall Pl; Sussex Pl; Lexan Ave; Carroll Pl; Eleanor Ct; Sylvan St; Bluestone Ave; Westwood Ter; Covington Ln; Bedford Ave; Eastwood Ter; S Fairwater Dr; S Lexan Cres; N Fairwater Dr; Escadrille Pt; N Lexan Cres; Argall Cres; Walnut Hill St; Catalpa St; Alson Dr; Powhatan Ct; Walton Ave; Mc Lean Ave; S Eleanor Ct; Myrtle Park; Quarantine Rd; Studeley Ave Exn; Powhatan Pl; Woodbury Ave; Shirley Ln.
Other features: Elizabeth Riv.
Edgewater neighborhood detailed profile
Area: 1.464 square miles
Population: 4,974
Population density:
| Edgewater (Larchmont): | 3,398 people per square mile |
| Norfolk: | 4,376 people per square mile |
Median household income in 2021:
| Edgewater (Larchmont): | $84,410 |
| Norfolk: | $58,591 |
Median rent in in 2021:
| Edgewater (Larchmont): | $1,648 |
| Norfolk: | $938 |
Male vs Females
| Males: | 2,496 |
| Females: | 2,478 |
Median age
| Males: | 30.7 years |
| Females: | 27.1 years |
Housing prices:
Average estimated value of detached houses in 2021 (69.9% of all units):
| Edgewater (Larchmont): | $478,450 |
| Norfolk: | $306,640 |
Average estimated value of townhouses or other attached units in 2021 (17.4% of all units):
| This neighborhood: | $411,538 |
| city: | $267,013 |
Average estimated '21 value of housing units in 5-or-more-unit structures (42.7% of all units):
| Edgewater (Larchmont): | $316,900 |
| Norfolk: | $260,910 |
Most popular occupations of males: sales and office occupations (17.2%); service occupations (15.1%); education, training, and library occupations (12.5%); management occupations (except farmers) (10.0%); business and financial operations occupations (6.9%); architecture and engineering occupations (6.9%); legal occupations (6.2%)
Most popular occupations of females: sales and office occupations (21.6%); healthcare practitioners and technical occupations (15.9%); education, training, and library occupations (15.3%); service occupations (12.7%); management occupations (except farmers) (9.2%); community and social services occupations (8.1%); business and financial operations occupations (5.5%)
Highways in this neighborhood: Hampton Blvd (State Rte 337).
Roads and streets: Bolling Ave; Buckingham Ave; Westmoreland Ave; Magnolia Ave; Melrose Pkwy; Powhatan Ave; Rockbridge Ave; Brunswick Ave; Monroe Pl; Manchester Ave; Jamestown Cres; Longwood Dr; Rolfe Ave; Studeley Ave; Upper Brandon Pl; Hanover Ave; Cedar Ln; Larchmont Cres; Cambridge Cres; Edgewater Dr; Carillo Ave; Surrey Cres; Richmond Cres; Monterey Ave; Cambridge Pl; Wythe Pl; Glenhaven Cres; Argall Ave; Cornwall Pl; Sussex Pl; Lexan Ave; Carroll Pl; Eleanor Ct; Sylvan St; Bluestone Ave; Westwood Ter; Covington Ln; Bedford Ave; Eastwood Ter; S Fairwater Dr; S Lexan Cres; N Fairwater Dr; Escadrille Pt; N Lexan Cres; Argall Cres; Walnut Hill St; Catalpa St; Alson Dr; Powhatan Ct; Walton Ave; Mc Lean Ave; S Eleanor Ct; Myrtle Park; Quarantine Rd; Studeley Ave Exn; Powhatan Pl; Woodbury Ave; Shirley Ln.
Other features: Elizabeth Riv.
Edgewater neighborhood detailed profile
Elizabeth Park neighborhood in Norfolk statistics: (Find on map)
Area: 0.196 square miles
Population: 439
Population density:
Median household income in 2021:
Median rent in in 2021:
Male vs Females
Median age
Average estimated value of detached houses in 2021 (87.2% of all units):
Most popular occupations of males: service occupations (31.1%); material moving occupations (20.0%); computer and mathematical occupations (14.0%); sales and office occupations (8.8%); construction, extraction, and maintenance occupations (8.2%); management occupations (except farmers) (6.5%); arts, design, entertainment, sports, and media occupations (4.3%)
Most popular occupations of females: healthcare practitioners and technical occupations (21.2%); service occupations (18.6%); education, training, and library occupations (17.7%); sales and office occupations (15.2%); business and financial operations occupations (8.1%); production occupations (6.2%); transportation occupations (5.2%)
Roads and streets: Curlew Dr; Orion Ave; Pine Grove Ave; Riverwood Rd; Huntsman Rd; Revere Dr; Welaka Rd; Corporate Blvd; Kimberly Ln; Lucian Ct; Valleau Rd; Betty Ct.
Railroad features: Norfolk Southern Rlwy.
Elizabeth Park neighborhood detailed profile
Area: 0.196 square miles
Population: 439
Population density:
| Elizabeth Park: | 2,241 people per square mile |
| Norfolk: | 4,376 people per square mile |
Median household income in 2021:
| Elizabeth Park: | $88,621 |
| Norfolk: | $58,591 |
Median rent in in 2021:
| Elizabeth Park: | $1,110 |
| Norfolk: | $938 |
Male vs Females
| Males: | 236 |
| Females: | 203 |
Median age
| Males: | 38.2 years |
| Females: | 41.3 years |
Average estimated value of detached houses in 2021 (87.2% of all units):
| Elizabeth Park: | $293,716 |
| Norfolk: | $306,640 |
Most popular occupations of males: service occupations (31.1%); material moving occupations (20.0%); computer and mathematical occupations (14.0%); sales and office occupations (8.8%); construction, extraction, and maintenance occupations (8.2%); management occupations (except farmers) (6.5%); arts, design, entertainment, sports, and media occupations (4.3%)
Most popular occupations of females: healthcare practitioners and technical occupations (21.2%); service occupations (18.6%); education, training, and library occupations (17.7%); sales and office occupations (15.2%); business and financial operations occupations (8.1%); production occupations (6.2%); transportation occupations (5.2%)
Roads and streets: Curlew Dr; Orion Ave; Pine Grove Ave; Riverwood Rd; Huntsman Rd; Revere Dr; Welaka Rd; Corporate Blvd; Kimberly Ln; Lucian Ct; Valleau Rd; Betty Ct.
Railroad features: Norfolk Southern Rlwy.
Elizabeth Park neighborhood detailed profile
Elmhurst neighborhood in Norfolk statistics: (Find on map)
Area: 0.310 square miles
Population: 1,442
Population density:
Median household income in 2021:
Median rent in in 2021:
Male vs Females
Median age
Average estimated value of detached houses in 2021 (62.9% of all units):
Most popular occupations of males: material moving occupations (27.3%); service occupations (24.6%); production occupations (11.8%); construction, extraction, and maintenance occupations (5.5%); sales and office occupations (5.4%); arts, design, entertainment, sports, and media occupations (5.2%); education, training, and library occupations (4.7%)
Most popular occupations of females: sales and office occupations (23.5%); legal occupations (18.2%); service occupations (17.2%); healthcare practitioners and technical occupations (9.1%); education, training, and library occupations (9.0%); computer and mathematical occupations (6.3%); transportation occupations (5.6%)
Roads and streets: Beamon Rd; Kennebeck Ave; Elmhurst Ave; Azalea Garden Rd; Herbert St; Dunway St; Beamon Ct; Dolphin Ave; Thomas St; Humbolt St; Ellsmere Ave; Hombolt Ct (Humbolt St); Dayton Ct; Sunny Ct; Brookneal Ct; Kennebeck Ct.
Elmhurst neighborhood detailed profile
Area: 0.310 square miles
Population: 1,442
Population density:
| Elmhurst: | 4,649 people per square mile |
| Norfolk: | 4,376 people per square mile |
Median household income in 2021:
| Elmhurst: | $51,726 |
| Norfolk: | $58,591 |
Median rent in in 2021:
| Elmhurst: | $941 |
| Norfolk: | $938 |
Male vs Females
| Males: | 710 |
| Females: | 731 |
Median age
| Males: | 32.2 years |
| Females: | 33.6 years |
Average estimated value of detached houses in 2021 (62.9% of all units):
| Elmhurst: | $215,636 |
| Norfolk: | $306,640 |
Most popular occupations of males: material moving occupations (27.3%); service occupations (24.6%); production occupations (11.8%); construction, extraction, and maintenance occupations (5.5%); sales and office occupations (5.4%); arts, design, entertainment, sports, and media occupations (5.2%); education, training, and library occupations (4.7%)
Most popular occupations of females: sales and office occupations (23.5%); legal occupations (18.2%); service occupations (17.2%); healthcare practitioners and technical occupations (9.1%); education, training, and library occupations (9.0%); computer and mathematical occupations (6.3%); transportation occupations (5.6%)
Roads and streets: Beamon Rd; Kennebeck Ave; Elmhurst Ave; Azalea Garden Rd; Herbert St; Dunway St; Beamon Ct; Dolphin Ave; Thomas St; Humbolt St; Ellsmere Ave; Hombolt Ct (Humbolt St); Dayton Ct; Sunny Ct; Brookneal Ct; Kennebeck Ct.
Elmhurst neighborhood detailed profile
Estabrook neighborhood in Norfolk statistics: (Find on map)
Area: 0.468 square miles
Population: 3,286
Population density:
Median household income in 2021:
Median rent in in 2021:
Male vs Females
Median age
Average estimated value of detached houses in 2021 (81.9% of all units):
Most popular occupations of males: production occupations (31.1%); service occupations (15.0%); transportation occupations (8.9%); sales and office occupations (8.5%); construction, extraction, and maintenance occupations (8.1%); management occupations (except farmers) (3.7%); business and financial operations occupations (2.7%)
Most popular occupations of females: sales and office occupations (42.4%); management occupations (except farmers) (16.8%); service occupations (16.5%); healthcare practitioners and technical occupations (8.5%); business and financial operations occupations (6.2%); education, training, and library occupations (5.9%); production occupations (2.8%)
Highways in this neighborhood: State Rte 247 (Chesapeake Blvd); Norland Cir (State Rte 247, Chesapeake Blvd).
Roads and streets: Robin Hood Rd; Larkin St; Amherst St; Buckingham St; Peterson St; Orange St; Atterbury St; Davis St; Overbrook Ave; Henrico St; Oklahoma Ave; Jersey Ave; Hurley Ave; Nottaway St; County St; W Bonner Dr; Glen Ave; Krick St; Birch St; Kennon Ave; Radford St; Montgomery St; Norland Ct; E Bonner Dr; Tait Ter; Spruce St; Alder St; Lafayette Blvd; Hanbury St; Olean St; Stephan Ct; Woolsey St; Kansas Ave.
Estabrook neighborhood detailed profile
Area: 0.468 square miles
Population: 3,286
Population density:
| Estabrook: | 7,017 people per square mile |
| Norfolk: | 4,376 people per square mile |
Median household income in 2021:
| Estabrook: | $64,881 |
| Norfolk: | $58,591 |
Median rent in in 2021:
| Estabrook: | $954 |
| Norfolk: | $938 |
Male vs Females
| Males: | 1,662 |
| Females: | 1,623 |
Median age
| Males: | 37.5 years |
| Females: | 40.6 years |
Average estimated value of detached houses in 2021 (81.9% of all units):
| Estabrook: | $156,343 |
| Norfolk: | $306,640 |
Most popular occupations of males: production occupations (31.1%); service occupations (15.0%); transportation occupations (8.9%); sales and office occupations (8.5%); construction, extraction, and maintenance occupations (8.1%); management occupations (except farmers) (3.7%); business and financial operations occupations (2.7%)
Most popular occupations of females: sales and office occupations (42.4%); management occupations (except farmers) (16.8%); service occupations (16.5%); healthcare practitioners and technical occupations (8.5%); business and financial operations occupations (6.2%); education, training, and library occupations (5.9%); production occupations (2.8%)
Highways in this neighborhood: State Rte 247 (Chesapeake Blvd); Norland Cir (State Rte 247, Chesapeake Blvd).
Roads and streets: Robin Hood Rd; Larkin St; Amherst St; Buckingham St; Peterson St; Orange St; Atterbury St; Davis St; Overbrook Ave; Henrico St; Oklahoma Ave; Jersey Ave; Hurley Ave; Nottaway St; County St; W Bonner Dr; Glen Ave; Krick St; Birch St; Kennon Ave; Radford St; Montgomery St; Norland Ct; E Bonner Dr; Tait Ter; Spruce St; Alder St; Lafayette Blvd; Hanbury St; Olean St; Stephan Ct; Woolsey St; Kansas Ave.
Estabrook neighborhood detailed profile
Fairmont Park neighborhood in Norfolk statistics: (Find on map)
Area: 0.853 square miles
Population: 6,101
Population density:
Median household income in 2021:
Median rent in in 2021:
Male vs Females
Median age
Average estimated value of detached houses in 2021 (76.0% of all units):
Most popular occupations of males: construction, extraction, and maintenance occupations (21.3%); sales and office occupations (18.6%); service occupations (14.3%); transportation occupations (6.5%); business and financial operations occupations (6.1%); production occupations (6.0%); material moving occupations (4.5%)
Most popular occupations of females: sales and office occupations (31.4%); service occupations (25.4%); healthcare practitioners and technical occupations (11.9%); business and financial operations occupations (6.2%); management occupations (except farmers) (5.2%); computer and mathematical occupations (4.1%); architecture and engineering occupations (4.1%)
Highways in this neighborhood: State Rte 247 (Lafayette Blvd); State Rte 247.
Roads and streets: Somme Ave; Argonne Ave; Chesapeake Blvd; Dunkirk Ave; Bapaume Ave; Vimy Ridge Ave; Lens Ave; Cromwell Dr; Peronne Ave; Pershing Ave; Saint Mihiel Ave; Brest Ave; Verdun Ave; Marne Ave; Columbia Ave; Pope Ave; Shoop Ave; Alsace Ave; Lyons Ave; Silbert Rd; Tait Ter; Bellevue Ave; Abbey Rd; Saint Denis Ave; Willowwood Dr; Kitchener Ave; Fearer Ave; Beckner St; Douglas St; Flanders Ave; Gornto Ave; Ballentine Blvd; Atwater Cir.
Railroad features: Norfolk Southern Rlwy.
Other features: Wayne Crk.
Fairmont Park neighborhood detailed profile
Area: 0.853 square miles
Population: 6,101
Population density:
| Fairmont Park: | 7,149 people per square mile |
| Norfolk: | 4,376 people per square mile |
Median household income in 2021:
| Fairmont Park: | $63,050 |
| Norfolk: | $58,591 |
Median rent in in 2021:
| Fairmont Park: | $920 |
| Norfolk: | $938 |
Male vs Females
| Males: | 3,009 |
| Females: | 3,092 |
Median age
| Males: | 36.3 years |
| Females: | 39.7 years |
Average estimated value of detached houses in 2021 (76.0% of all units):
| Fairmont Park: | $171,795 |
| Norfolk: | $306,640 |
Most popular occupations of males: construction, extraction, and maintenance occupations (21.3%); sales and office occupations (18.6%); service occupations (14.3%); transportation occupations (6.5%); business and financial operations occupations (6.1%); production occupations (6.0%); material moving occupations (4.5%)
Most popular occupations of females: sales and office occupations (31.4%); service occupations (25.4%); healthcare practitioners and technical occupations (11.9%); business and financial operations occupations (6.2%); management occupations (except farmers) (5.2%); computer and mathematical occupations (4.1%); architecture and engineering occupations (4.1%)
Highways in this neighborhood: State Rte 247 (Lafayette Blvd); State Rte 247.
Roads and streets: Somme Ave; Argonne Ave; Chesapeake Blvd; Dunkirk Ave; Bapaume Ave; Vimy Ridge Ave; Lens Ave; Cromwell Dr; Peronne Ave; Pershing Ave; Saint Mihiel Ave; Brest Ave; Verdun Ave; Marne Ave; Columbia Ave; Pope Ave; Shoop Ave; Alsace Ave; Lyons Ave; Silbert Rd; Tait Ter; Bellevue Ave; Abbey Rd; Saint Denis Ave; Willowwood Dr; Kitchener Ave; Fearer Ave; Beckner St; Douglas St; Flanders Ave; Gornto Ave; Ballentine Blvd; Atwater Cir.
Railroad features: Norfolk Southern Rlwy.
Other features: Wayne Crk.
Fairmont Park neighborhood detailed profile
First Oakmont North Townhouse Association neighborhood in Norfolk statistics: (Find on map)
Area: 0.011 square miles
Population: 40
Population density:
Median household income in 2021:
Median rent in in 2021:
Male vs Females
Median age
Most popular occupations of males: service occupations (42.8%); construction, extraction, and maintenance occupations (21.8%); material moving occupations (17.1%); management occupations (except farmers) (15.1%); transportation occupations (13.2%); sales and office occupations (7.6%); business and financial operations occupations (5.1%)
Most popular occupations of females: sales and office occupations (62.4%); service occupations (23.5%); computer and mathematical occupations (14.1%); architecture and engineering occupations (6.5%); healthcare practitioners and technical occupations (6.5%); material moving occupations (5.2%); business and financial operations occupations (4.7%)
Roads and streets: N Rosemont Dr; Johnstons Rd; Rosemont Ct.
First Oakmont North Townhouse Association neighborhood detailed profile
Area: 0.011 square miles
Population: 40
Population density:
| First Oakmont North Townhouse Association: | 3,584 people per square mile |
| Norfolk: | 4,376 people per square mile |
Median household income in 2021:
| First Oakmont North Townhouse Association: | $39,958 |
| Norfolk: | $58,591 |
Median rent in in 2021:
| First Oakmont North Townhouse Association: | $861 |
| Norfolk: | $938 |
Male vs Females
| Males: | 16 |
| Females: | 23 |
Median age
| Males: | 18.0 years |
| Females: | 25.7 years |
Most popular occupations of males: service occupations (42.8%); construction, extraction, and maintenance occupations (21.8%); material moving occupations (17.1%); management occupations (except farmers) (15.1%); transportation occupations (13.2%); sales and office occupations (7.6%); business and financial operations occupations (5.1%)
Most popular occupations of females: sales and office occupations (62.4%); service occupations (23.5%); computer and mathematical occupations (14.1%); architecture and engineering occupations (6.5%); healthcare practitioners and technical occupations (6.5%); material moving occupations (5.2%); business and financial operations occupations (4.7%)
Roads and streets: N Rosemont Dr; Johnstons Rd; Rosemont Ct.
First Oakmont North Townhouse Association neighborhood detailed profile
Ford Plant neighborhood in Norfolk statistics: (Find on map)
Area: 0.177 square miles
Population: 140
Population density:
Median household income in 2021:
Median rent in in 2021:
Male vs Females
Median age
Average estimated value of detached houses in 2021 (86.7% of all units):
Most popular occupations of males: service occupations (27.6%); education, training, and library occupations (20.9%); production occupations (19.4%); computer and mathematical occupations (16.4%); material moving occupations (11.6%); sales and office occupations (9.0%); transportation occupations (6.7%)
Most popular occupations of females: service occupations (27.2%); computer and mathematical occupations (20.6%); production occupations (20.2%); sales and office occupations (19.1%); healthcare practitioners and technical occupations (15.8%); community and social services occupations (13.9%); education, training, and library occupations (9.2%)
Roads and streets: E Indian River Rd; Ford Dr; Poppleton St; Canton Ave; Springfield Ave.
Railroad features: Norfolk Southern Rlwy.
Ford Plant neighborhood detailed profile
Area: 0.177 square miles
Population: 140
Population density:
| Ford Plant: | 792 people per square mile |
| Norfolk: | 4,376 people per square mile |
Median household income in 2021:
| Ford Plant: | $48,894 |
| Norfolk: | $58,591 |
Median rent in in 2021:
| Ford Plant: | $960 |
| Norfolk: | $938 |
Male vs Females
| Males: | 49 |
| Females: | 90 |
Median age
| Males: | 21.6 years |
| Females: | 50.1 years |
Average estimated value of detached houses in 2021 (86.7% of all units):
| Ford Plant: | $149,377 |
| Norfolk: | $306,640 |
Most popular occupations of males: service occupations (27.6%); education, training, and library occupations (20.9%); production occupations (19.4%); computer and mathematical occupations (16.4%); material moving occupations (11.6%); sales and office occupations (9.0%); transportation occupations (6.7%)
Most popular occupations of females: service occupations (27.2%); computer and mathematical occupations (20.6%); production occupations (20.2%); sales and office occupations (19.1%); healthcare practitioners and technical occupations (15.8%); community and social services occupations (13.9%); education, training, and library occupations (9.2%)
Roads and streets: E Indian River Rd; Ford Dr; Poppleton St; Canton Ave; Springfield Ave.
Railroad features: Norfolk Southern Rlwy.
Ford Plant neighborhood detailed profile
Foxhall neighborhood in Norfolk statistics: (Find on map)
Area: 0.564 square miles
Population: 1,418
Population density:
Median household income in 2021:
Median rent in in 2021:
Male vs Females
Median age
Average estimated value of detached houses in 2021 (67.6% of all units):
Most popular occupations of males: service occupations (20.7%); sales and office occupations (13.6%); arts, design, entertainment, sports, and media occupations (11.6%); material moving occupations (8.2%); construction, extraction, and maintenance occupations (7.4%); management occupations (except farmers) (6.7%); production occupations (5.1%)
Most popular occupations of females: sales and office occupations (41.0%); service occupations (21.7%); healthcare practitioners and technical occupations (13.1%); management occupations (except farmers) (6.3%); business and financial operations occupations (3.9%); production occupations (3.7%); arts, design, entertainment, sports, and media occupations (3.0%)
Highways in this neighborhood: E Princess Anne Rd (State Rte 166); State Rte 165 (N Military Hwy).
Roads and streets: Cape Henry Ave; Robin Hood Rd; Henneman Dr; S Cape Henry Ave; Ashby St; Walmer Ave; Almeda Ave; Cowand Ave; Elizabeth Ave; Norcova Ave; Arthur Cir; Bartin St; Eltham Ave; Ellsmere Ave; Miltate Ave; Kerrey Ave; Shelton Ave; Kilmer Ln; Halstead Ave; Mc Neal Ave; Fleetwood Ave; Nelms Ave; Beekman St; Woolsey St; Wolfe St; Bruce St; Darden St; Shafer St; Sigmon St; Ashby Ct; Mohawk St.
Railroad features: Norfolk Southern Rlwy.
Foxhall neighborhood detailed profile
Area: 0.564 square miles
Population: 1,418
Population density:
| Foxhall: | 2,516 people per square mile |
| Norfolk: | 4,376 people per square mile |
Median household income in 2021:
| Foxhall: | $56,325 |
| Norfolk: | $58,591 |
Median rent in in 2021:
| Foxhall: | $861 |
| Norfolk: | $938 |
Male vs Females
| Males: | 662 |
| Females: | 756 |
Median age
| Males: | 39.4 years |
| Females: | 42.5 years |
Average estimated value of detached houses in 2021 (67.6% of all units):
| Foxhall: | $192,141 |
| Norfolk: | $306,640 |
Most popular occupations of males: service occupations (20.7%); sales and office occupations (13.6%); arts, design, entertainment, sports, and media occupations (11.6%); material moving occupations (8.2%); construction, extraction, and maintenance occupations (7.4%); management occupations (except farmers) (6.7%); production occupations (5.1%)
Most popular occupations of females: sales and office occupations (41.0%); service occupations (21.7%); healthcare practitioners and technical occupations (13.1%); management occupations (except farmers) (6.3%); business and financial operations occupations (3.9%); production occupations (3.7%); arts, design, entertainment, sports, and media occupations (3.0%)
Highways in this neighborhood: E Princess Anne Rd (State Rte 166); State Rte 165 (N Military Hwy).
Roads and streets: Cape Henry Ave; Robin Hood Rd; Henneman Dr; S Cape Henry Ave; Ashby St; Walmer Ave; Almeda Ave; Cowand Ave; Elizabeth Ave; Norcova Ave; Arthur Cir; Bartin St; Eltham Ave; Ellsmere Ave; Miltate Ave; Kerrey Ave; Shelton Ave; Kilmer Ln; Halstead Ave; Mc Neal Ave; Fleetwood Ave; Nelms Ave; Beekman St; Woolsey St; Wolfe St; Bruce St; Darden St; Shafer St; Sigmon St; Ashby Ct; Mohawk St.
Railroad features: Norfolk Southern Rlwy.
Foxhall neighborhood detailed profile
Freemason Street Area Association neighborhood in Norfolk statistics: (Find on map)
Area: 0.113 square miles
Population: 408
Population density:
Median household income in 2021:
Median rent in in 2021:
Male vs Females
Median age
Housing prices:
Average estimated value of detached houses in 2021 (3.1% of all units):
Average estimated value of townhouses or other attached units in 2021 (8.0% of all units):
Average estimated '21 value of housing units in 5-or-more-unit structures (37.4% of all units):
Most popular occupations of males: sales and office occupations (25.9%); computer and mathematical occupations (20.8%); business and financial operations occupations (20.0%); arts, design, entertainment, sports, and media occupations (17.3%); construction, extraction, and maintenance occupations (17.3%); education, training, and library occupations (17.2%); healthcare practitioners and technical occupations (16.8%)
Most popular occupations of females: education, training, and library occupations (27.5%); management occupations (except farmers) (25.1%); sales and office occupations (18.7%); community and social services occupations (13.3%); business and financial operations occupations (12.8%); healthcare practitioners and technical occupations (12.1%); service occupations (8.8%)
Highways in this neighborhood: State Rte 337 Alt (Boush St); State Rte 337 Alt (Duke St).
Roads and streets: W Bute St; College Pl; W Freemason St; Brooke Ave; Dunmore St; W Tazewell St; Yarmouth St; Freemason Mews; College Cross; Harbour Mews; Botetourt St.
Freemason Street Area Association neighborhood detailed profile
Area: 0.113 square miles
Population: 408
Population density:
| Freemason Street Area Association: | 3,610 people per square mile |
| Norfolk: | 4,376 people per square mile |
Median household income in 2021:
| Freemason Street Area Association: | $119,634 |
| Norfolk: | $58,591 |
Median rent in in 2021:
| Freemason Street Area Association: | $1,568 |
| Norfolk: | $938 |
Male vs Females
| Males: | 275 |
| Females: | 133 |
Median age
| Males: | 36.3 years |
| Females: | 41.6 years |
Housing prices:
Average estimated value of detached houses in 2021 (3.1% of all units):
| Freemason Street Area Association: | $1,277,875 |
| Norfolk: | $306,640 |
Average estimated value of townhouses or other attached units in 2021 (8.0% of all units):
| This neighborhood: | $698,295 |
| city: | $267,013 |
Average estimated '21 value of housing units in 5-or-more-unit structures (37.4% of all units):
| Freemason Street Area Association: | $330,379 |
| Norfolk: | $260,910 |
Most popular occupations of males: sales and office occupations (25.9%); computer and mathematical occupations (20.8%); business and financial operations occupations (20.0%); arts, design, entertainment, sports, and media occupations (17.3%); construction, extraction, and maintenance occupations (17.3%); education, training, and library occupations (17.2%); healthcare practitioners and technical occupations (16.8%)
Most popular occupations of females: education, training, and library occupations (27.5%); management occupations (except farmers) (25.1%); sales and office occupations (18.7%); community and social services occupations (13.3%); business and financial operations occupations (12.8%); healthcare practitioners and technical occupations (12.1%); service occupations (8.8%)
Highways in this neighborhood: State Rte 337 Alt (Boush St); State Rte 337 Alt (Duke St).
Roads and streets: W Bute St; College Pl; W Freemason St; Brooke Ave; Dunmore St; W Tazewell St; Yarmouth St; Freemason Mews; College Cross; Harbour Mews; Botetourt St.
Freemason Street Area Association neighborhood detailed profile
Ghent Neighborhood League neighborhood in Norfolk statistics: (Find on map)
Area: 0.457 square miles
Population: 5,870
Population density:
Median household income in 2021:
Median rent in in 2021:
Male vs Females
Median age
Housing prices:
Average estimated value of detached houses in 2021 (17.9% of all units):
Average estimated value of townhouses or other attached units in 2021 (4.7% of all units):
Average estimated '21 value of housing units in 5-or-more-unit structures (25.7% of all units):
Most popular occupations of males: computer and mathematical occupations (15.7%); service occupations (14.4%); management occupations (except farmers) (11.2%); healthcare practitioners and technical occupations (10.9%); sales and office occupations (6.9%); education, training, and library occupations (6.8%); business and financial operations occupations (6.4%)
Most popular occupations of females: service occupations (22.0%); sales and office occupations (19.4%); education, training, and library occupations (15.5%); healthcare practitioners and technical occupations (11.6%); management occupations (except farmers) (7.7%); business and financial operations occupations (7.0%); arts, design, entertainment, sports, and media occupations (6.0%)
Highways in this neighborhood: US Hwy 58 (State Rte 337, W Brambleton Ave).
Roads and streets: Colley Ave; W Olney Rd; Graydon Ave; Colonial Ave; Washington Park; Stockley Gardens; Raleigh Ave; Manteo St; Shirley Ave; Spotswood Ave; Baldwin Ave; Westover Ave; W Princess Anne Rd; Redgate Ave; Boissevain Ave; Maury Ave; Gresham Dr; Fairfax Ave; Core Ave; Mowbray Arch; Pembroke Ave; Blow St; Dundaff St; Warren Cres; Gates Ave; Brandon Ave; Childrens Ln; Wagner Rd; Mill St; Beechwood Pl.
Ghent Neighborhood League neighborhood detailed profile
Area: 0.457 square miles
Population: 5,870
Population density:
| Ghent Neighborhood League: | 12,842 people per square mile |
| Norfolk: | 4,376 people per square mile |
Median household income in 2021:
| Ghent Neighborhood League: | $87,738 |
| Norfolk: | $58,591 |
Median rent in in 2021:
| Ghent Neighborhood League: | $1,126 |
| Norfolk: | $938 |
Male vs Females
| Males: | 2,997 |
| Females: | 2,872 |
Median age
| Males: | 34.7 years |
| Females: | 36.6 years |
Housing prices:
Average estimated value of detached houses in 2021 (17.9% of all units):
| Ghent Neighborhood League: | $547,177 |
| Norfolk: | $306,640 |
Average estimated value of townhouses or other attached units in 2021 (4.7% of all units):
| This neighborhood: | $403,356 |
| city: | $267,013 |
Average estimated '21 value of housing units in 5-or-more-unit structures (25.7% of all units):
| Ghent Neighborhood League: | $175,511 |
| Norfolk: | $260,910 |
Most popular occupations of males: computer and mathematical occupations (15.7%); service occupations (14.4%); management occupations (except farmers) (11.2%); healthcare practitioners and technical occupations (10.9%); sales and office occupations (6.9%); education, training, and library occupations (6.8%); business and financial operations occupations (6.4%)
Most popular occupations of females: service occupations (22.0%); sales and office occupations (19.4%); education, training, and library occupations (15.5%); healthcare practitioners and technical occupations (11.6%); management occupations (except farmers) (7.7%); business and financial operations occupations (7.0%); arts, design, entertainment, sports, and media occupations (6.0%)
Highways in this neighborhood: US Hwy 58 (State Rte 337, W Brambleton Ave).
Roads and streets: Colley Ave; W Olney Rd; Graydon Ave; Colonial Ave; Washington Park; Stockley Gardens; Raleigh Ave; Manteo St; Shirley Ave; Spotswood Ave; Baldwin Ave; Westover Ave; W Princess Anne Rd; Redgate Ave; Boissevain Ave; Maury Ave; Gresham Dr; Fairfax Ave; Core Ave; Mowbray Arch; Pembroke Ave; Blow St; Dundaff St; Warren Cres; Gates Ave; Brandon Ave; Childrens Ln; Wagner Rd; Mill St; Beechwood Pl.
Ghent Neighborhood League neighborhood detailed profile
Ghent Square neighborhood in Norfolk statistics: (Find on map)
Area: 0.139 square miles
Population: 1,149
Population density:
Median household income in 2021:
Median rent in in 2021:
Male vs Females
Median age
Housing prices:
Average estimated value of detached houses in 2021 (22.5% of all units):
Average estimated value of townhouses or other attached units in 2021 (17.9% of all units):
Average estimated '21 value of housing units in 5-or-more-unit structures (29.5% of all units):
Most popular occupations of males: management occupations (except farmers) (16.4%); business and financial operations occupations (14.8%); healthcare practitioners and technical occupations (11.6%); life, physical, and social science occupations (10.4%); architecture and engineering occupations (9.0%); sales and office occupations (7.1%); education, training, and library occupations (6.1%)
Most popular occupations of females: healthcare practitioners and technical occupations (26.2%); education, training, and library occupations (19.2%); sales and office occupations (18.5%); management occupations (except farmers) (10.8%); computer and mathematical occupations (5.2%); legal occupations (4.1%); life, physical, and social science occupations (4.0%)
Roads and streets: Botetourt Gardens; Botetourt Gardens (Westover Ave); Pender Ct; Van Wyck Mews; Llewellyn Ave; W Princess Anne Rd; Mowbray Arch; Shirley Ave; Raleigh Ave; de Bree Ave; W Olney Rd; E Mowbray Ct; W Botetourt Ct; W Mowbray Ct; S Botetourt Ct; N Botetourt Ct; Llewellyn Mews; N Mowbray Ct; E Botetourt Ct; Westover Mews; S Mowbray Ct; Boissevain Ave.
Ghent Square neighborhood detailed profile
Area: 0.139 square miles
Population: 1,149
Population density:
| Ghent Square: | 8,269 people per square mile |
| Norfolk: | 4,376 people per square mile |
Median household income in 2021:
| Ghent Square: | $86,465 |
| Norfolk: | $58,591 |
Median rent in in 2021:
| Ghent Square: | $1,513 |
| Norfolk: | $938 |
Male vs Females
| Males: | 585 |
| Females: | 564 |
Median age
| Males: | 34.7 years |
| Females: | 35.4 years |
Housing prices:
Average estimated value of detached houses in 2021 (22.5% of all units):
| Ghent Square: | $288,125 |
| Norfolk: | $306,640 |
Average estimated value of townhouses or other attached units in 2021 (17.9% of all units):
| This neighborhood: | $403,356 |
| city: | $267,013 |
Average estimated '21 value of housing units in 5-or-more-unit structures (29.5% of all units):
| Ghent Square: | $100,107 |
| Norfolk: | $260,910 |
Most popular occupations of males: management occupations (except farmers) (16.4%); business and financial operations occupations (14.8%); healthcare practitioners and technical occupations (11.6%); life, physical, and social science occupations (10.4%); architecture and engineering occupations (9.0%); sales and office occupations (7.1%); education, training, and library occupations (6.1%)
Most popular occupations of females: healthcare practitioners and technical occupations (26.2%); education, training, and library occupations (19.2%); sales and office occupations (18.5%); management occupations (except farmers) (10.8%); computer and mathematical occupations (5.2%); legal occupations (4.1%); life, physical, and social science occupations (4.0%)
Roads and streets: Botetourt Gardens; Botetourt Gardens (Westover Ave); Pender Ct; Van Wyck Mews; Llewellyn Ave; W Princess Anne Rd; Mowbray Arch; Shirley Ave; Raleigh Ave; de Bree Ave; W Olney Rd; E Mowbray Ct; W Botetourt Ct; W Mowbray Ct; S Botetourt Ct; N Botetourt Ct; Llewellyn Mews; N Mowbray Ct; E Botetourt Ct; Westover Mews; S Mowbray Ct; Boissevain Ave.
Ghent Square neighborhood detailed profile
Glengariff neighborhood in Norfolk statistics: (Find on map)
Area: 0.206 square miles
Population: 541
Population density:
Median household income in 2021:
Median rent in in 2021:
Male vs Females
Median age
Average estimated value of detached houses in 2021 (84.3% of all units):
Most popular occupations of males: material moving occupations (41.4%); construction, extraction, and maintenance occupations (11.0%); production occupations (11.0%); transportation occupations (8.1%); service occupations (6.1%); architecture and engineering occupations (5.7%); business and financial operations occupations (4.9%)
Most popular occupations of females: sales and office occupations (46.5%); business and financial operations occupations (15.5%); education, training, and library occupations (13.8%); service occupations (9.1%); material moving occupations (5.6%); healthcare practitioners and technical occupations (4.8%); management occupations (except farmers) (3.5%)
Highways in this neighborhood: Azalea Garden Rd (State Rte 192).
Roads and streets: Bridle Way; Hollybriar Pt; Norview Ave; Carriage Ln; Powder Horn Dr; Tallyho Ter.
Glengariff neighborhood detailed profile
Area: 0.206 square miles
Population: 541
Population density:
| Glengariff: | 2,623 people per square mile |
| Norfolk: | 4,376 people per square mile |
Median household income in 2021:
| Glengariff: | $71,834 |
| Norfolk: | $58,591 |
Median rent in in 2021:
| Glengariff: | $745 |
| Norfolk: | $938 |
Male vs Females
| Males: | 268 |
| Females: | 273 |
Median age
| Males: | 38.8 years |
| Females: | 44.8 years |
Average estimated value of detached houses in 2021 (84.3% of all units):
| Glengariff: | $218,285 |
| Norfolk: | $306,640 |
Most popular occupations of males: material moving occupations (41.4%); construction, extraction, and maintenance occupations (11.0%); production occupations (11.0%); transportation occupations (8.1%); service occupations (6.1%); architecture and engineering occupations (5.7%); business and financial operations occupations (4.9%)
Most popular occupations of females: sales and office occupations (46.5%); business and financial operations occupations (15.5%); education, training, and library occupations (13.8%); service occupations (9.1%); material moving occupations (5.6%); healthcare practitioners and technical occupations (4.8%); management occupations (except farmers) (3.5%)
Highways in this neighborhood: Azalea Garden Rd (State Rte 192).
Roads and streets: Bridle Way; Hollybriar Pt; Norview Ave; Carriage Ln; Powder Horn Dr; Tallyho Ter.
Glengariff neighborhood detailed profile
Glenrock neighborhood in Norfolk statistics: (Find on map)
Area: 0.197 square miles
Population: 197
Population density:
Median household income in 2021:
Median rent in in 2021:
Male vs Females
Median age
Average estimated value of detached houses in 2021 (61.3% of all units):
Most popular occupations of males: construction, extraction, and maintenance occupations (15.1%); community and social services occupations (12.0%); education, training, and library occupations (11.8%); service occupations (11.4%); management occupations (except farmers) (10.8%); production occupations (10.8%); computer and mathematical occupations (5.2%)
Most popular occupations of females: service occupations (41.0%); sales and office occupations (27.0%); management occupations (except farmers) (20.0%); education, training, and library occupations (4.9%); business and financial operations occupations (3.8%); material moving occupations (3.4%); community and social services occupations (3.2%)
Roads and streets: Bartee St; Chambers St; Finney St; Benton St; Honaker Ave; Hicks Ave; Wellman St; Glenrock Rd; Frizzell Ave; Lucas Ave; Brockwell Ave; Yoder Ave.
Glenrock neighborhood detailed profile
Area: 0.197 square miles
Population: 197
Population density:
| Glenrock: | 998 people per square mile |
| Norfolk: | 4,376 people per square mile |
Median household income in 2021:
| Glenrock: | $73,644 |
| Norfolk: | $58,591 |
Median rent in in 2021:
| Glenrock: | $803 |
| Norfolk: | $938 |
Male vs Females
| Males: | 103 |
| Females: | 94 |
Median age
| Males: | 39.6 years |
| Females: | 48.9 years |
Average estimated value of detached houses in 2021 (61.3% of all units):
| Glenrock: | $208,238 |
| Norfolk: | $306,640 |
Most popular occupations of males: construction, extraction, and maintenance occupations (15.1%); community and social services occupations (12.0%); education, training, and library occupations (11.8%); service occupations (11.4%); management occupations (except farmers) (10.8%); production occupations (10.8%); computer and mathematical occupations (5.2%)
Most popular occupations of females: service occupations (41.0%); sales and office occupations (27.0%); management occupations (except farmers) (20.0%); education, training, and library occupations (4.9%); business and financial operations occupations (3.8%); material moving occupations (3.4%); community and social services occupations (3.2%)
Roads and streets: Bartee St; Chambers St; Finney St; Benton St; Honaker Ave; Hicks Ave; Wellman St; Glenrock Rd; Frizzell Ave; Lucas Ave; Brockwell Ave; Yoder Ave.
Glenrock neighborhood detailed profile
Glenwood Park neighborhood in Norfolk statistics: (Find on map)
Area: 0.186 square miles
Population: 1,356
Population density:
Median household income in 2021:
Median rent in in 2021:
Male vs Females
Median age
Average estimated value of detached houses in 2021 (29.5% of all units):
Most popular occupations of males: service occupations (33.2%); construction, extraction, and maintenance occupations (19.6%); computer and mathematical occupations (14.5%); education, training, and library occupations (10.1%); transportation occupations (8.2%); sales and office occupations (6.3%); production occupations (2.9%)
Most popular occupations of females: sales and office occupations (43.6%); service occupations (23.7%); material moving occupations (9.5%); healthcare practitioners and technical occupations (9.1%); education, training, and library occupations (5.3%); community and social services occupations (4.1%); business and financial operations occupations (3.2%)
Roads and streets: Forrest Ave; Woodview Ave; Glendale Ave; Rogers Ave; Greenbrier Ave; Beechwood Ave; Glen Myrtle Ave; Laurel Ave; Evergreen Ave; Mapleshade Ave; Boush Creek Ave.
Glenwood Park neighborhood detailed profile
Area: 0.186 square miles
Population: 1,356
Population density:
| Glenwood Park: | 7,292 people per square mile |
| Norfolk: | 4,376 people per square mile |
Median household income in 2021:
| Glenwood Park: | $45,019 |
| Norfolk: | $58,591 |
Median rent in in 2021:
| Glenwood Park: | $910 |
| Norfolk: | $938 |
Male vs Females
| Males: | 904 |
| Females: | 452 |
Median age
| Males: | 26.9 years |
| Females: | 37.2 years |
Average estimated value of detached houses in 2021 (29.5% of all units):
| Glenwood Park: | $148,154 |
| Norfolk: | $306,640 |
Most popular occupations of males: service occupations (33.2%); construction, extraction, and maintenance occupations (19.6%); computer and mathematical occupations (14.5%); education, training, and library occupations (10.1%); transportation occupations (8.2%); sales and office occupations (6.3%); production occupations (2.9%)
Most popular occupations of females: sales and office occupations (43.6%); service occupations (23.7%); material moving occupations (9.5%); healthcare practitioners and technical occupations (9.1%); education, training, and library occupations (5.3%); community and social services occupations (4.1%); business and financial operations occupations (3.2%)
Roads and streets: Forrest Ave; Woodview Ave; Glendale Ave; Rogers Ave; Greenbrier Ave; Beechwood Ave; Glen Myrtle Ave; Laurel Ave; Evergreen Ave; Mapleshade Ave; Boush Creek Ave.
Glenwood Park neighborhood detailed profile
Grandy Village neighborhood in Norfolk statistics: (Find on map)
Area: 0.071 square miles
Population: 181
Population density:
Median household income in 2021:
Median rent in in 2021:
Male vs Females
Median age
Average estimated value of detached houses in 2021 (11.8% of all units):
Most popular occupations of males: service occupations (75.0%); management occupations (except farmers) (71.0%); construction, extraction, and maintenance occupations (47.4%); architecture and engineering occupations (44.2%); sales and office occupations (25.3%); transportation occupations (25.0%); material moving occupations (22.1%)
Most popular occupations of females: service occupations (38.4%); sales and office occupations (29.9%); material moving occupations (12.2%); education, training, and library occupations (11.9%); healthcare practitioners and technical occupations (9.6%); architecture and engineering occupations (8.7%); business and financial operations occupations (7.9%)
Roads and streets: Kimball Ter; Wiley Dr; Kimball Ct; E End Ave.
Grandy Village neighborhood detailed profile
Area: 0.071 square miles
Population: 181
Population density:
| Grandy Village: | 2,552 people per square mile |
| Norfolk: | 4,376 people per square mile |
Median household income in 2021:
| Grandy Village: | $20,497 |
| Norfolk: | $58,591 |
Median rent in in 2021:
| Grandy Village: | $299 |
| Norfolk: | $938 |
Male vs Females
| Males: | 81 |
| Females: | 100 |
Median age
| Males: | 9.5 years |
| Females: | 30.3 years |
Average estimated value of detached houses in 2021 (11.8% of all units):
| Grandy Village: | $181,546 |
| Norfolk: | $306,640 |
Most popular occupations of males: service occupations (75.0%); management occupations (except farmers) (71.0%); construction, extraction, and maintenance occupations (47.4%); architecture and engineering occupations (44.2%); sales and office occupations (25.3%); transportation occupations (25.0%); material moving occupations (22.1%)
Most popular occupations of females: service occupations (38.4%); sales and office occupations (29.9%); material moving occupations (12.2%); education, training, and library occupations (11.9%); healthcare practitioners and technical occupations (9.6%); architecture and engineering occupations (8.7%); business and financial operations occupations (7.9%)
Roads and streets: Kimball Ter; Wiley Dr; Kimball Ct; E End Ave.
Grandy Village neighborhood detailed profile
Greenhill Farms neighborhood in Norfolk statistics: (Find on map)
Area: 0.223 square miles
Population: 1,202
Population density:
Median household income in 2021:
Median rent in in 2021:
Male vs Females
Median age
Average estimated value of detached houses in 2021 (82.1% of all units):
Most popular occupations of males: service occupations (17.8%); education, training, and library occupations (16.1%); sales and office occupations (9.2%); management occupations (except farmers) (8.7%); transportation occupations (8.5%); business and financial operations occupations (7.2%); material moving occupations (7.0%)
Most popular occupations of females: sales and office occupations (36.2%); service occupations (14.0%); education, training, and library occupations (8.8%); healthcare practitioners and technical occupations (7.7%); legal occupations (7.4%); management occupations (except farmers) (4.0%); community and social services occupations (3.9%)
Roads and streets: Sedgefield Dr; Glenoak Dr; Norview Ave; Lowell Ave; Avon Rd; Knox Rd; Sunshine Ave; Maymont Ave; Whittier Dr; Elon Ct.
Railroad features: Norfolk Southern Rlwy.
Other features: Branch Wayne Crk.
Greenhill Farms neighborhood detailed profile
Area: 0.223 square miles
Population: 1,202
Population density:
| Greenhill Farms: | 5,392 people per square mile |
| Norfolk: | 4,376 people per square mile |
Median household income in 2021:
| Greenhill Farms: | $70,338 |
| Norfolk: | $58,591 |
Median rent in in 2021:
| Greenhill Farms: | $1,343 |
| Norfolk: | $938 |
Male vs Females
| Males: | 562 |
| Females: | 640 |
Median age
| Males: | 35.7 years |
| Females: | 38.4 years |
Average estimated value of detached houses in 2021 (82.1% of all units):
| Greenhill Farms: | $165,102 |
| Norfolk: | $306,640 |
Most popular occupations of males: service occupations (17.8%); education, training, and library occupations (16.1%); sales and office occupations (9.2%); management occupations (except farmers) (8.7%); transportation occupations (8.5%); business and financial operations occupations (7.2%); material moving occupations (7.0%)
Most popular occupations of females: sales and office occupations (36.2%); service occupations (14.0%); education, training, and library occupations (8.8%); healthcare practitioners and technical occupations (7.7%); legal occupations (7.4%); management occupations (except farmers) (4.0%); community and social services occupations (3.9%)
Roads and streets: Sedgefield Dr; Glenoak Dr; Norview Ave; Lowell Ave; Avon Rd; Knox Rd; Sunshine Ave; Maymont Ave; Whittier Dr; Elon Ct.
Railroad features: Norfolk Southern Rlwy.
Other features: Branch Wayne Crk.
Greenhill Farms neighborhood detailed profile
Greenwood neighborhood in Norfolk statistics: (Find on map)
Area: 0.159 square miles
Population: 958
Population density:
Median household income in 2021:
Median rent in in 2021:
Male vs Females
Median age
Average estimated value of detached houses in 2021 (84.0% of all units):
Most popular occupations of males: production occupations (32.6%); construction, extraction, and maintenance occupations (16.3%); service occupations (13.7%); transportation occupations (10.6%); material moving occupations (5.3%); business and financial operations occupations (4.2%); sales and office occupations (3.3%)
Most popular occupations of females: sales and office occupations (38.2%); management occupations (except farmers) (14.5%); healthcare practitioners and technical occupations (10.9%); service occupations (10.1%); production occupations (9.9%); arts, design, entertainment, sports, and media occupations (7.3%); material moving occupations (3.0%)
Highways in this neighborhood: Sewells Point Rd (State Rte 194).
Roads and streets: Kennebeck Ave; Little John Dr; Chalfin Ave; Elmhurst Ave; Locust Ave; Pinehurst Ave; Shoshone Ct; Hyde Cir; McNutt Ct; Blackwood Ave; Kirkland Ave; Sherwood Forest Ln (Early St); Sherwood Forest Ln; Kennebeck Cir; Inca Ct.
Other features: Wayne Crk.
Greenwood neighborhood detailed profile
Area: 0.159 square miles
Population: 958
Population density:
| Greenwood: | 6,010 people per square mile |
| Norfolk: | 4,376 people per square mile |
Median household income in 2021:
| Greenwood: | $59,199 |
| Norfolk: | $58,591 |
Median rent in in 2021:
| Greenwood: | $995 |
| Norfolk: | $938 |
Male vs Females
| Males: | 467 |
| Females: | 490 |
Median age
| Males: | 33.1 years |
| Females: | 38.3 years |
Average estimated value of detached houses in 2021 (84.0% of all units):
| Greenwood: | $151,722 |
| Norfolk: | $306,640 |
Most popular occupations of males: production occupations (32.6%); construction, extraction, and maintenance occupations (16.3%); service occupations (13.7%); transportation occupations (10.6%); material moving occupations (5.3%); business and financial operations occupations (4.2%); sales and office occupations (3.3%)
Most popular occupations of females: sales and office occupations (38.2%); management occupations (except farmers) (14.5%); healthcare practitioners and technical occupations (10.9%); service occupations (10.1%); production occupations (9.9%); arts, design, entertainment, sports, and media occupations (7.3%); material moving occupations (3.0%)
Highways in this neighborhood: Sewells Point Rd (State Rte 194).
Roads and streets: Kennebeck Ave; Little John Dr; Chalfin Ave; Elmhurst Ave; Locust Ave; Pinehurst Ave; Shoshone Ct; Hyde Cir; McNutt Ct; Blackwood Ave; Kirkland Ave; Sherwood Forest Ln (Early St); Sherwood Forest Ln; Kennebeck Cir; Inca Ct.
Other features: Wayne Crk.
Greenwood neighborhood detailed profile
Hardy Field neighborhood in Norfolk statistics: (Find on map)
Area: 0.192 square miles
Population: 171
Population density:
Median household income in 2021:
Median rent in in 2021:
Male vs Females
Median age
Average estimated value of detached houses in 2021 (43.0% of all units):
Most popular occupations of males: material moving occupations (25.5%); management occupations (except farmers) (24.2%); production occupations (12.1%); arts, design, entertainment, sports, and media occupations (9.7%); business and financial operations occupations (8.1%); construction, extraction, and maintenance occupations (5.7%); sales and office occupations (4.4%)
Most popular occupations of females: material moving occupations (25.9%); education, training, and library occupations (19.7%); service occupations (18.9%); management occupations (except farmers) (15.4%); business and financial operations occupations (10.9%); sales and office occupations (10.1%); production occupations (4.4%)
Roads and streets: E Berkley Ave; S Main St; Fauquier St; W Berkley Ave; Stafford St; E Indian River Rd; Poplar Ave; Hardy Ave; Hough Ave; Bellamy Ave; Clifton St; Patrick St; Pendleton St; Dinwiddie St; W Indian River Rd; Cross St; Frederick St; State St; Whitehead St; Grayson St; W Liberty St.
Hardy Field neighborhood detailed profile
Area: 0.192 square miles
Population: 171
Population density:
| Hardy Field: | 891 people per square mile |
| Norfolk: | 4,376 people per square mile |
Median household income in 2021:
| Hardy Field: | $46,458 |
| Norfolk: | $58,591 |
Median rent in in 2021:
| Hardy Field: | $839 |
| Norfolk: | $938 |
Male vs Females
| Males: | 107 |
| Females: | 63 |
Median age
| Males: | 30.0 years |
| Females: | 38.6 years |
Average estimated value of detached houses in 2021 (43.0% of all units):
| Hardy Field: | $199,931 |
| Norfolk: | $306,640 |
Most popular occupations of males: material moving occupations (25.5%); management occupations (except farmers) (24.2%); production occupations (12.1%); arts, design, entertainment, sports, and media occupations (9.7%); business and financial operations occupations (8.1%); construction, extraction, and maintenance occupations (5.7%); sales and office occupations (4.4%)
Most popular occupations of females: material moving occupations (25.9%); education, training, and library occupations (19.7%); service occupations (18.9%); management occupations (except farmers) (15.4%); business and financial operations occupations (10.9%); sales and office occupations (10.1%); production occupations (4.4%)
Roads and streets: E Berkley Ave; S Main St; Fauquier St; W Berkley Ave; Stafford St; E Indian River Rd; Poplar Ave; Hardy Ave; Hough Ave; Bellamy Ave; Clifton St; Patrick St; Pendleton St; Dinwiddie St; W Indian River Rd; Cross St; Frederick St; State St; Whitehead St; Grayson St; W Liberty St.
Hardy Field neighborhood detailed profile
Hewitt Farms neighborhood in Norfolk statistics: (Find on map)
Area: 0.129 square miles
Population: 273
Population density:
Median household income in 2021:
Median rent in in 2021:
Male vs Females
Median age
Average estimated value of detached houses in 2021 (80.9% of all units):
Most popular occupations of males: transportation occupations (21.4%); sales and office occupations (12.6%); production occupations (10.8%); business and financial operations occupations (9.2%); construction, extraction, and maintenance occupations (7.3%); material moving occupations (6.6%); management occupations (except farmers) (6.2%)
Most popular occupations of females: sales and office occupations (35.7%); education, training, and library occupations (14.7%); service occupations (14.7%); architecture and engineering occupations (8.8%); business and financial operations occupations (6.9%); healthcare practitioners and technical occupations (5.1%); management occupations (except farmers) (4.4%)
Roads and streets: N Oriole Dr; S Oriole Dr; Meadow Creek Rd; Tananger Pkwy; Warbler Ln; Thrasher Ln.
Hewitt Farms neighborhood detailed profile
Area: 0.129 square miles
Population: 273
Population density:
| Hewitt Farms: | 2,123 people per square mile |
| Norfolk: | 4,376 people per square mile |
Median household income in 2021:
| Hewitt Farms: | $79,490 |
| Norfolk: | $58,591 |
Median rent in in 2021:
| Hewitt Farms: | $1,454 |
| Norfolk: | $938 |
Male vs Females
| Males: | 124 |
| Females: | 148 |
Median age
| Males: | 38.8 years |
| Females: | 48.9 years |
Average estimated value of detached houses in 2021 (80.9% of all units):
| Hewitt Farms: | $227,151 |
| Norfolk: | $306,640 |
Most popular occupations of males: transportation occupations (21.4%); sales and office occupations (12.6%); production occupations (10.8%); business and financial operations occupations (9.2%); construction, extraction, and maintenance occupations (7.3%); material moving occupations (6.6%); management occupations (except farmers) (6.2%)
Most popular occupations of females: sales and office occupations (35.7%); education, training, and library occupations (14.7%); service occupations (14.7%); architecture and engineering occupations (8.8%); business and financial operations occupations (6.9%); healthcare practitioners and technical occupations (5.1%); management occupations (except farmers) (4.4%)
Roads and streets: N Oriole Dr; S Oriole Dr; Meadow Creek Rd; Tananger Pkwy; Warbler Ln; Thrasher Ln.
Hewitt Farms neighborhood detailed profile
Highland Park neighborhood in Norfolk statistics: (Find on map)
Area: 0.240 square miles
Population: 2,200
Population density:
Median household income in 2021:
Median rent in in 2021:
Male vs Females
Median age
Most popular occupations of males: service occupations (27.7%); sales and office occupations (25.8%); education, training, and library occupations (10.7%); material moving occupations (7.6%); computer and mathematical occupations (6.8%); arts, design, entertainment, sports, and media occupations (4.4%); life, physical, and social science occupations (3.4%)
Most popular occupations of females: service occupations (38.9%); sales and office occupations (30.2%); education, training, and library occupations (13.4%); management occupations (except farmers) (5.3%); healthcare practitioners and technical occupations (5.2%); production occupations (2.8%); computer and mathematical occupations (1.4%)
Roads and streets: Colley Ave; W 49th St; W 48th St; W 50th St; W 51st St; W 52nd St; Killam Ave; Mayflower Rd; W 46th St; W 41st St; W 45th St; W 53rd St; Waterfront Dr; W 40th St; Michigan Ave; W 44th St; W 43rd St; W 47th St.
Highland Park neighborhood detailed profile
Area: 0.240 square miles
Population: 2,200
Population density:
| Highland Park: | 9,171 people per square mile |
| Norfolk: | 4,376 people per square mile |
Median household income in 2021:
| Highland Park: | $48,573 |
| Norfolk: | $58,591 |
Median rent in in 2021:
| Highland Park: | $1,148 |
| Norfolk: | $938 |
Male vs Females
| Males: | 1,095 |
| Females: | 1,105 |
Median age
| Males: | 27.4 years |
| Females: | 27.2 years |
Most popular occupations of males: service occupations (27.7%); sales and office occupations (25.8%); education, training, and library occupations (10.7%); material moving occupations (7.6%); computer and mathematical occupations (6.8%); arts, design, entertainment, sports, and media occupations (4.4%); life, physical, and social science occupations (3.4%)
Most popular occupations of females: service occupations (38.9%); sales and office occupations (30.2%); education, training, and library occupations (13.4%); management occupations (except farmers) (5.3%); healthcare practitioners and technical occupations (5.2%); production occupations (2.8%); computer and mathematical occupations (1.4%)
Roads and streets: Colley Ave; W 49th St; W 48th St; W 50th St; W 51st St; W 52nd St; Killam Ave; Mayflower Rd; W 46th St; W 41st St; W 45th St; W 53rd St; Waterfront Dr; W 40th St; Michigan Ave; W 44th St; W 43rd St; W 47th St.
Highland Park neighborhood detailed profile
Hunter's Square neighborhood in Norfolk statistics: (Find on map)
Area: 0.033 square miles
Population: 206
Population density:
Median household income in 2021:
Median rent in in 2021:
Male vs Females
Median age
Average estimated value of detached houses in 2021 (56.7% of all units):
Most popular occupations of males: education, training, and library occupations (41.6%); management occupations (except farmers) (38.2%); production occupations (35.6%); transportation occupations (32.7%); material moving occupations (16.1%); computer and mathematical occupations (14.7%); construction, extraction, and maintenance occupations (12.9%)
Most popular occupations of females: sales and office occupations (31.4%); service occupations (30.8%); transportation occupations (10.4%); education, training, and library occupations (8.4%); material moving occupations (5.7%); business and financial operations occupations (4.7%); computer and mathematical occupations (4.7%)
Highways in this neighborhood: State Rte 168 (Tidewater Dr).
Roads and streets: Goff St; Chapel St.
Hunter's Square neighborhood detailed profile
Area: 0.033 square miles
Population: 206
Population density:
| Hunter's Square: | 6,329 people per square mile |
| Norfolk: | 4,376 people per square mile |
Median household income in 2021:
| Hunter's Square: | $55,694 |
| Norfolk: | $58,591 |
Median rent in in 2021:
| Hunter's Square: | $946 |
| Norfolk: | $938 |
Male vs Females
| Males: | 92 |
| Females: | 114 |
Median age
| Males: | 34.0 years |
| Females: | 48.7 years |
Average estimated value of detached houses in 2021 (56.7% of all units):
| Hunter's Square: | $241,526 |
| Norfolk: | $306,640 |
Most popular occupations of males: education, training, and library occupations (41.6%); management occupations (except farmers) (38.2%); production occupations (35.6%); transportation occupations (32.7%); material moving occupations (16.1%); computer and mathematical occupations (14.7%); construction, extraction, and maintenance occupations (12.9%)
Most popular occupations of females: sales and office occupations (31.4%); service occupations (30.8%); transportation occupations (10.4%); education, training, and library occupations (8.4%); material moving occupations (5.7%); business and financial operations occupations (4.7%); computer and mathematical occupations (4.7%)
Highways in this neighborhood: State Rte 168 (Tidewater Dr).
Roads and streets: Goff St; Chapel St.
Hunter's Square neighborhood detailed profile
Inglenook Park neighborhood in Norfolk statistics: (Find on map)
Area: 0.092 square miles
Population: 521
Population density:
Median household income in 2021:
Median rent in in 2021:
Male vs Females
Median age
Average estimated value of detached houses in 2021 (97.7% of all units):
Most popular occupations of males: sales and office occupations (20.1%); transportation occupations (18.5%); service occupations (17.3%); life, physical, and social science occupations (10.7%); material moving occupations (10.0%); production occupations (6.1%); arts, design, entertainment, sports, and media occupations (5.9%)
Most popular occupations of females: education, training, and library occupations (27.2%); sales and office occupations (24.6%); healthcare practitioners and technical occupations (16.3%); service occupations (14.5%); business and financial operations occupations (8.3%); legal occupations (6.6%); community and social services occupations (5.7%)
Highways in this neighborhood: .
Roads and streets: Whitehorn Dr; Widgeon Rd; Glenoak Dr; Philpotts Rd; Marietta Ave; Wolcott Ave; Charnwood Ct; Poe Ct.
Inglenook Park neighborhood detailed profile
Area: 0.092 square miles
Population: 521
Population density:
| Inglenook Park: | 5,677 people per square mile |
| Norfolk: | 4,376 people per square mile |
Median household income in 2021:
| Inglenook Park: | $87,985 |
| Norfolk: | $58,591 |
Median rent in in 2021:
| Inglenook Park: | $883 |
| Norfolk: | $938 |
Male vs Females
| Males: | 295 |
| Females: | 225 |
Median age
| Males: | 29.2 years |
| Females: | 42.2 years |
Average estimated value of detached houses in 2021 (97.7% of all units):
| Inglenook Park: | $196,174 |
| Norfolk: | $306,640 |
Most popular occupations of males: sales and office occupations (20.1%); transportation occupations (18.5%); service occupations (17.3%); life, physical, and social science occupations (10.7%); material moving occupations (10.0%); production occupations (6.1%); arts, design, entertainment, sports, and media occupations (5.9%)
Most popular occupations of females: education, training, and library occupations (27.2%); sales and office occupations (24.6%); healthcare practitioners and technical occupations (16.3%); service occupations (14.5%); business and financial operations occupations (8.3%); legal occupations (6.6%); community and social services occupations (5.7%)
Highways in this neighborhood: .
Roads and streets: Whitehorn Dr; Widgeon Rd; Glenoak Dr; Philpotts Rd; Marietta Ave; Wolcott Ave; Charnwood Ct; Poe Ct.
Inglenook Park neighborhood detailed profile
Ingleside neighborhood in Norfolk statistics: (Find on map)
Area: 0.825 square miles
Population: 2,308
Population density:
Median household income in 2021:
Median rent in in 2021:
Male vs Females
Median age
Average estimated value of detached houses in 2021 (58.5% of all units):
Most popular occupations of males: service occupations (22.0%); business and financial operations occupations (16.5%); sales and office occupations (14.4%); construction, extraction, and maintenance occupations (11.0%); management occupations (except farmers) (8.2%); transportation occupations (7.8%); production occupations (6.1%)
Most popular occupations of females: service occupations (33.5%); sales and office occupations (31.8%); healthcare practitioners and technical occupations (7.2%); management occupations (except farmers) (5.4%); transportation occupations (5.1%); material moving occupations (3.6%); education, training, and library occupations (2.9%)
Limited-access highways (interstate or state) in this neighborhood: I- 264.
Roads and streets: Ingleside Rd; Trant Ave; Riverside Dr; N Ingleside Dr; Scott St; Kentucky Ave; Karlin Ave; Mississippi Ave; Seay Ave; Wedgefield Ave; Gatling Ave; Mangrove Ave; Tennessee Ave; Peake Rd; Wakefield Ave; Fontaine Ave; Garfield Ave; Trice Ter; Westminster Ave; Ladd Ave; Elm St; Jasmine Ave; Oak Ave; Utah Ave; Karlin Cir; Etheridge Ave; Dogwood Ter; Townsend Pl; Easton Ave; Townsend Ct; Moffitt St; Weiss Ln; Arcadia St; Evangeline St; Ingle Cir; Foxwell Ln; Elgo St; Wedgefield Ct; Pine Harbor Dr; Hagan Ave; Gilmer Rd; Corbin Rd; Benwood Rd; Brennan Ave; Elm Ct; Hadley Rd; Comstock St; Trant Ct; Elizabeth River Cir; Almond Ave; Steiner Way; Weems Rd; Foxwell Dr; Malbon Ave; Trant Cir; Chandler Ave.
Railroad features: Norfolk Southern Rlwy.
Ingleside neighborhood detailed profile
Area: 0.825 square miles
Population: 2,308
Population density:
| Ingleside: | 2,798 people per square mile |
| Norfolk: | 4,376 people per square mile |
Median household income in 2021:
| Ingleside: | $71,548 |
| Norfolk: | $58,591 |
Median rent in in 2021:
| Ingleside: | $778 |
| Norfolk: | $938 |
Male vs Females
| Males: | 1,198 |
| Females: | 1,110 |
Median age
| Males: | 37.7 years |
| Females: | 45.6 years |
Average estimated value of detached houses in 2021 (58.5% of all units):
| Ingleside: | $189,749 |
| Norfolk: | $306,640 |
Most popular occupations of males: service occupations (22.0%); business and financial operations occupations (16.5%); sales and office occupations (14.4%); construction, extraction, and maintenance occupations (11.0%); management occupations (except farmers) (8.2%); transportation occupations (7.8%); production occupations (6.1%)
Most popular occupations of females: service occupations (33.5%); sales and office occupations (31.8%); healthcare practitioners and technical occupations (7.2%); management occupations (except farmers) (5.4%); transportation occupations (5.1%); material moving occupations (3.6%); education, training, and library occupations (2.9%)
Limited-access highways (interstate or state) in this neighborhood: I- 264.
Roads and streets: Ingleside Rd; Trant Ave; Riverside Dr; N Ingleside Dr; Scott St; Kentucky Ave; Karlin Ave; Mississippi Ave; Seay Ave; Wedgefield Ave; Gatling Ave; Mangrove Ave; Tennessee Ave; Peake Rd; Wakefield Ave; Fontaine Ave; Garfield Ave; Trice Ter; Westminster Ave; Ladd Ave; Elm St; Jasmine Ave; Oak Ave; Utah Ave; Karlin Cir; Etheridge Ave; Dogwood Ter; Townsend Pl; Easton Ave; Townsend Ct; Moffitt St; Weiss Ln; Arcadia St; Evangeline St; Ingle Cir; Foxwell Ln; Elgo St; Wedgefield Ct; Pine Harbor Dr; Hagan Ave; Gilmer Rd; Corbin Rd; Benwood Rd; Brennan Ave; Elm Ct; Hadley Rd; Comstock St; Trant Ct; Elizabeth River Cir; Almond Ave; Steiner Way; Weems Rd; Foxwell Dr; Malbon Ave; Trant Cir; Chandler Ave.
Railroad features: Norfolk Southern Rlwy.
Ingleside neighborhood detailed profile
Janaf neighborhood in Norfolk statistics: (Find on map)
Area: 0.140 square miles
Population: 179
Population density:
Median household income in 2021:
Median rent in in 2021:
Male vs Females
Median age
Housing prices:
Average estimated value of detached houses in 2021 (20.6% of all units):
Average estimated value of townhouses or other attached units in 2021 (70.1% of all units):
Average estimated value of mobile home in 2021 (28.0% of all units):
Most popular occupations of males: production occupations (26.4%); management occupations (except farmers) (24.6%); computer and mathematical occupations (22.4%); service occupations (11.5%); farming, fishing, and forestry occupations (4.7%); legal occupations (4.1%); transportation occupations (3.9%)
Most popular occupations of females: sales and office occupations (35.3%); community and social services occupations (30.2%); healthcare practitioners and technical occupations (16.3%); management occupations (except farmers) (10.6%); service occupations (6.6%); transportation occupations (2.1%)
Highways in this neighborhood: US Hwy 58 (E Virginia Beach Blvd); US Hwy 13 (N Military Hwy).
Janaf neighborhood detailed profile
Area: 0.140 square miles
Population: 179
Population density:
| Janaf: | 1,277 people per square mile |
| Norfolk: | 4,376 people per square mile |
Median household income in 2021:
| Janaf: | $58,704 |
| Norfolk: | $58,591 |
Median rent in in 2021:
| Janaf: | $1,074 |
| Norfolk: | $938 |
Male vs Females
| Males: | 80 |
| Females: | 99 |
Median age
| Males: | 32.6 years |
| Females: | 39.0 years |
Housing prices:
Average estimated value of detached houses in 2021 (20.6% of all units):
| Janaf: | $208,013 |
| Norfolk: | $306,640 |
Average estimated value of townhouses or other attached units in 2021 (70.1% of all units):
| This neighborhood: | $132,485 |
| city: | $267,013 |
Average estimated value of mobile home in 2021 (28.0% of all units):
| Janaf: | $7,231 |
| Norfolk: | $23,245 |
Most popular occupations of males: production occupations (26.4%); management occupations (except farmers) (24.6%); computer and mathematical occupations (22.4%); service occupations (11.5%); farming, fishing, and forestry occupations (4.7%); legal occupations (4.1%); transportation occupations (3.9%)
Most popular occupations of females: sales and office occupations (35.3%); community and social services occupations (30.2%); healthcare practitioners and technical occupations (16.3%); management occupations (except farmers) (10.6%); service occupations (6.6%); transportation occupations (2.1%)
Highways in this neighborhood: US Hwy 58 (E Virginia Beach Blvd); US Hwy 13 (N Military Hwy).
Janaf neighborhood detailed profile
Lafayette neighborhood in Norfolk statistics: (Find on map)
Area: 0.512 square miles
Population: 1,876
Population density:
Median household income in 2021:
Median rent in in 2021:
Male vs Females
Median age
Average estimated value of detached houses in 2021 (84.9% of all units):
Most popular occupations of males: sales and office occupations (24.1%); service occupations (15.3%); management occupations (except farmers) (13.3%); computer and mathematical occupations (8.6%); community and social services occupations (6.2%); material moving occupations (5.9%); production occupations (5.3%)
Most popular occupations of females: service occupations (17.6%); sales and office occupations (17.4%); education, training, and library occupations (16.9%); healthcare practitioners and technical occupations (14.6%); management occupations (except farmers) (11.6%); business and financial operations occupations (5.5%); community and social services occupations (2.9%)
Highways in this neighborhood: State Rte 168 (Tidewater Dr); State Rte 247 (Lafayette Blvd).
Roads and streets: Ashland Ave; Cromwell Dr; Willowwood Dr; Orleans Cir; Morris Ave; la Salle Ave; Elmore Pl; Pope Ave; Bourbon Ave; Racine Ave; Columbia Ave; Dupont Cir; Hancock Ave; Huntington Cres; Blair Ave; Norway Pl; Fontainebleau Cres; Luxembourg St; Saint Denis Ave; Bellevue Ave; Ave de Grasse; Jason Ave; Ave Lorraine; Ashland Cir; Versailles Ave; Holland Ave; Alsace Ave; Whitechapel Rd; Pomroy Ave; Royale Park; Tait Ter; Morris Cres; Clark Cir; Farragut Ave; Gowrie Ave; Webster Ave; Tarrall Ave; Baecher Rd; Willard Pl; Elmere Pl; Saint Louis Ave; Maury Cres; Versailles Pl; Elmore Ave; Ave Racine; Holly Point Rd; Vendome Ter.
Lafayette neighborhood detailed profile
Area: 0.512 square miles
Population: 1,876
Population density:
| Lafayette (Winona): | 3,665 people per square mile |
| Norfolk: | 4,376 people per square mile |
Median household income in 2021:
| Lafayette (Winona): | $69,565 |
| Norfolk: | $58,591 |
Median rent in in 2021:
| Lafayette (Winona): | $987 |
| Norfolk: | $938 |
Male vs Females
| Males: | 796 |
| Females: | 1,080 |
Median age
| Males: | 40.2 years |
| Females: | 45.1 years |
Average estimated value of detached houses in 2021 (84.9% of all units):
| Lafayette (Winona): | $158,700 |
| Norfolk: | $306,640 |
Most popular occupations of males: sales and office occupations (24.1%); service occupations (15.3%); management occupations (except farmers) (13.3%); computer and mathematical occupations (8.6%); community and social services occupations (6.2%); material moving occupations (5.9%); production occupations (5.3%)
Most popular occupations of females: service occupations (17.6%); sales and office occupations (17.4%); education, training, and library occupations (16.9%); healthcare practitioners and technical occupations (14.6%); management occupations (except farmers) (11.6%); business and financial operations occupations (5.5%); community and social services occupations (2.9%)
Highways in this neighborhood: State Rte 168 (Tidewater Dr); State Rte 247 (Lafayette Blvd).
Roads and streets: Ashland Ave; Cromwell Dr; Willowwood Dr; Orleans Cir; Morris Ave; la Salle Ave; Elmore Pl; Pope Ave; Bourbon Ave; Racine Ave; Columbia Ave; Dupont Cir; Hancock Ave; Huntington Cres; Blair Ave; Norway Pl; Fontainebleau Cres; Luxembourg St; Saint Denis Ave; Bellevue Ave; Ave de Grasse; Jason Ave; Ave Lorraine; Ashland Cir; Versailles Ave; Holland Ave; Alsace Ave; Whitechapel Rd; Pomroy Ave; Royale Park; Tait Ter; Morris Cres; Clark Cir; Farragut Ave; Gowrie Ave; Webster Ave; Tarrall Ave; Baecher Rd; Willard Pl; Elmere Pl; Saint Louis Ave; Maury Cres; Versailles Pl; Elmore Ave; Ave Racine; Holly Point Rd; Vendome Ter.
Lafayette neighborhood detailed profile
Lake Taylor neighborhood in Norfolk statistics: (Find on map)
Area: 0.649 square miles
Population: 1,200
Population density:
Median household income in 2021:
Median rent in in 2021:
Male vs Females
Median age
Housing prices:
Average estimated value of detached houses in 2021 (96.1% of all units):
Average estimated value of townhouses or other attached units in 2021 (39.9% of all units):
Average estimated value of mobile home in 2021 (15.2% of all units):
Most popular occupations of males: management occupations (except farmers) (17.7%); service occupations (14.8%); sales and office occupations (12.4%); production occupations (12.0%); computer and mathematical occupations (10.0%); construction, extraction, and maintenance occupations (8.0%); material moving occupations (4.8%)
Most popular occupations of females: sales and office occupations (41.4%); community and social services occupations (14.7%); healthcare practitioners and technical occupations (13.5%); service occupations (11.8%); management occupations (except farmers) (9.1%); education, training, and library occupations (3.0%); business and financial operations occupations (2.8%)
Limited-access highways (interstate or state) in this neighborhood: I- 64.
Highways in this neighborhood: US Hwy 13 (N Military Hwy).
Roads and streets: Kempsville Rd; Georgetown Rd; Janaf Pl; Pascal Pl; Lockamy Ln; Frament Ave; Child Care Ct; Prince Ave; Cornick Rd; Security Ln; Lowery Rd; Old Phillips Rd; Lake Terrace Cir; Jarrett Rd; Gainor Pl; Charlney Ave; Corbell Ave; Dure Rd; Mary Ave; Airway Ln; Greenwich Ave; Monaco Ct; Lowery Ct; Landau Ct; Georgetown Ct; Landau Ln; Tracy St.
Other features: Broad Crk.
Lake Taylor neighborhood detailed profile
Area: 0.649 square miles
Population: 1,200
Population density:
| Lake Taylor: | 1,850 people per square mile |
| Norfolk: | 4,376 people per square mile |
Median household income in 2021:
| Lake Taylor: | $55,441 |
| Norfolk: | $58,591 |
Median rent in in 2021:
| Lake Taylor: | $828 |
| Norfolk: | $938 |
Male vs Females
| Males: | 611 |
| Females: | 588 |
Median age
| Males: | 38.4 years |
| Females: | 38.7 years |
Housing prices:
Average estimated value of detached houses in 2021 (96.1% of all units):
| Lake Taylor: | $191,954 |
| Norfolk: | $306,640 |
Average estimated value of townhouses or other attached units in 2021 (39.9% of all units):
| This neighborhood: | $132,485 |
| city: | $267,013 |
Average estimated value of mobile home in 2021 (15.2% of all units):
| Lake Taylor: | $7,231 |
| Norfolk: | $23,245 |
Most popular occupations of males: management occupations (except farmers) (17.7%); service occupations (14.8%); sales and office occupations (12.4%); production occupations (12.0%); computer and mathematical occupations (10.0%); construction, extraction, and maintenance occupations (8.0%); material moving occupations (4.8%)
Most popular occupations of females: sales and office occupations (41.4%); community and social services occupations (14.7%); healthcare practitioners and technical occupations (13.5%); service occupations (11.8%); management occupations (except farmers) (9.1%); education, training, and library occupations (3.0%); business and financial operations occupations (2.8%)
Limited-access highways (interstate or state) in this neighborhood: I- 64.
Highways in this neighborhood: US Hwy 13 (N Military Hwy).
Roads and streets: Kempsville Rd; Georgetown Rd; Janaf Pl; Pascal Pl; Lockamy Ln; Frament Ave; Child Care Ct; Prince Ave; Cornick Rd; Security Ln; Lowery Rd; Old Phillips Rd; Lake Terrace Cir; Jarrett Rd; Gainor Pl; Charlney Ave; Corbell Ave; Dure Rd; Mary Ave; Airway Ln; Greenwich Ave; Monaco Ct; Lowery Ct; Landau Ct; Georgetown Ct; Landau Ln; Tracy St.
Other features: Broad Crk.
Lake Taylor neighborhood detailed profile
Lambert's Point neighborhood in Norfolk statistics: (Find on map)
Area: 0.449 square miles
Population: 5,631
Population density:
Median household income in 2021:
Median rent in in 2021:
Male vs Females
Median age
Average estimated value of detached houses in 2021 (49.7% of all units):
Most popular occupations of males: sales and office occupations (31.2%); service occupations (30.5%); transportation occupations (6.3%); arts, design, entertainment, sports, and media occupations (4.3%); education, training, and library occupations (3.5%); life, physical, and social science occupations (2.6%); production occupations (2.6%)
Most popular occupations of females: service occupations (43.2%); sales and office occupations (33.6%); education, training, and library occupations (8.2%); management occupations (except farmers) (3.0%); community and social services occupations (2.9%); farming, fishing, and forestry occupations (1.8%); business and financial operations occupations (1.6%)
Highways in this neighborhood: Hampton Blvd (State Rte 337).
Roads and streets: W 38th St; Elkhorn Ave; W 39th St; W 40th St; W 43rd St; W 42nd St; Parker Ave; W 41st St; W 49th St; Bowdens Ferry Rd; W 37th St; Bluestone Ave; W 27th St; Powhatan Ave; W 26th St; W 45th St; W 25th St; W 46th St; 44th St; Campbell Ave; W 35th St.
Railroad features: Norfolk Southern Rlwy.
Lambert's Point neighborhood detailed profile
Area: 0.449 square miles
Population: 5,631
Population density:
| Lambert's Point: | 12,539 people per square mile |
| Norfolk: | 4,376 people per square mile |
Median household income in 2021:
| Lambert's Point: | $41,237 |
| Norfolk: | $58,591 |
Median rent in in 2021:
| Lambert's Point: | $879 |
| Norfolk: | $938 |
Male vs Females
| Males: | 2,822 |
| Females: | 2,808 |
Median age
| Males: | 22.5 years |
| Females: | 24.1 years |
Average estimated value of detached houses in 2021 (49.7% of all units):
| Lambert's Point: | $207,602 |
| Norfolk: | $306,640 |
Most popular occupations of males: sales and office occupations (31.2%); service occupations (30.5%); transportation occupations (6.3%); arts, design, entertainment, sports, and media occupations (4.3%); education, training, and library occupations (3.5%); life, physical, and social science occupations (2.6%); production occupations (2.6%)
Most popular occupations of females: service occupations (43.2%); sales and office occupations (33.6%); education, training, and library occupations (8.2%); management occupations (except farmers) (3.0%); community and social services occupations (2.9%); farming, fishing, and forestry occupations (1.8%); business and financial operations occupations (1.6%)
Highways in this neighborhood: Hampton Blvd (State Rte 337).
Roads and streets: W 38th St; Elkhorn Ave; W 39th St; W 40th St; W 43rd St; W 42nd St; Parker Ave; W 41st St; W 49th St; Bowdens Ferry Rd; W 37th St; Bluestone Ave; W 27th St; Powhatan Ave; W 26th St; W 45th St; W 25th St; W 46th St; 44th St; Campbell Ave; W 35th St.
Railroad features: Norfolk Southern Rlwy.
Lambert's Point neighborhood detailed profile
Larrymore Lawns neighborhood in Norfolk statistics: (Find on map)
Area: 0.509 square miles
Population: 2,162
Population density:
Median household income in 2021:
Median rent in in 2021:
Male vs Females
Median age
Housing prices:
Average estimated value of detached houses in 2021 (27.0% of all units):
Average estimated value of mobile home in 2021 (6.5% of all units):
Most popular occupations of males: construction, extraction, and maintenance occupations (15.2%); material moving occupations (14.9%); sales and office occupations (14.7%); business and financial operations occupations (11.8%); transportation occupations (11.6%); service occupations (10.4%); architecture and engineering occupations (4.8%)
Most popular occupations of females: service occupations (38.2%); sales and office occupations (29.1%); healthcare practitioners and technical occupations (10.4%); community and social services occupations (8.0%); education, training, and library occupations (6.2%); business and financial operations occupations (4.1%); production occupations (1.3%)
Highways in this neighborhood: State Rte 170 (E Little Creek Rd).
Roads and streets: Johnstons Rd; Doummar Dr; Kingsway Rd; Skyline Dr; Adele Dr; Red Brook Rd; Wildwood Dr; Old Mill Rd; Harmon St; Halprin Dr; Spartan Ave; Hilton St; Gifford St; Patrician Rd; Riddick St; Rich Ave; Stony Rd (Stoney Run Rd); Gail Dr; Gardner Dr; Bergen St; Maurice Dr; Lisa Dr; Winn Ln; Red Brook Ct; Rigby St; Doummar Ct; Adele Ct; Anita Ct.
Larrymore Lawns neighborhood detailed profile
Area: 0.509 square miles
Population: 2,162
Population density:
| Larrymore Lawns: | 4,249 people per square mile |
| Norfolk: | 4,376 people per square mile |
Median household income in 2021:
| Larrymore Lawns: | $60,592 |
| Norfolk: | $58,591 |
Median rent in in 2021:
| Larrymore Lawns: | $1,098 |
| Norfolk: | $938 |
Male vs Females
| Males: | 1,134 |
| Females: | 1,027 |
Median age
| Males: | 33.5 years |
| Females: | 38.8 years |
Housing prices:
Average estimated value of detached houses in 2021 (27.0% of all units):
| Larrymore Lawns: | $222,921 |
| Norfolk: | $306,640 |
Average estimated value of mobile home in 2021 (6.5% of all units):
| Larrymore Lawns: | $12,746 |
| Norfolk: | $23,245 |
Most popular occupations of males: construction, extraction, and maintenance occupations (15.2%); material moving occupations (14.9%); sales and office occupations (14.7%); business and financial operations occupations (11.8%); transportation occupations (11.6%); service occupations (10.4%); architecture and engineering occupations (4.8%)
Most popular occupations of females: service occupations (38.2%); sales and office occupations (29.1%); healthcare practitioners and technical occupations (10.4%); community and social services occupations (8.0%); education, training, and library occupations (6.2%); business and financial operations occupations (4.1%); production occupations (1.3%)
Highways in this neighborhood: State Rte 170 (E Little Creek Rd).
Roads and streets: Johnstons Rd; Doummar Dr; Kingsway Rd; Skyline Dr; Adele Dr; Red Brook Rd; Wildwood Dr; Old Mill Rd; Harmon St; Halprin Dr; Spartan Ave; Hilton St; Gifford St; Patrician Rd; Riddick St; Rich Ave; Stony Rd (Stoney Run Rd); Gail Dr; Gardner Dr; Bergen St; Maurice Dr; Lisa Dr; Winn Ln; Red Brook Ct; Rigby St; Doummar Ct; Adele Ct; Anita Ct.
Larrymore Lawns neighborhood detailed profile
Lochhaven neighborhood in Norfolk statistics: (Find on map)
Area: 0.297 square miles
Population: 409
Population density:
Median household income in 2021:
Median rent in in 2021:
Male vs Females
Median age
Most popular occupations of males: sales and office occupations (18.7%); management occupations (except farmers) (12.7%); computer and mathematical occupations (12.7%); education, training, and library occupations (9.2%); healthcare practitioners and technical occupations (9.2%); legal occupations (8.6%); service occupations (8.6%)
Most popular occupations of females: sales and office occupations (43.0%); business and financial operations occupations (12.5%); education, training, and library occupations (12.5%); management occupations (except farmers) (6.9%); service occupations (5.1%); arts, design, entertainment, sports, and media occupations (4.8%); legal occupations (4.6%)
Highways in this neighborhood: Hampton Blvd (State Rte 337).
Roads and streets: Cloncurry Rd; N Shore Rd; Gleneagles Rd; Daniel Ave; Blanford Cir; Maury Arch; Argyle Ave; Muirfield Rd; Glencove Pl; St Francis Ln; Commonwealth Ave; Milson Ave; Blanford Rd.
Lochhaven neighborhood detailed profile
Area: 0.297 square miles
Population: 409
Population density:
| Lochhaven: | 1,377 people per square mile |
| Norfolk: | 4,376 people per square mile |
Median household income in 2021:
| Lochhaven: | $97,413 |
| Norfolk: | $58,591 |
Median rent in in 2021:
| Lochhaven: | $996 |
| Norfolk: | $938 |
Male vs Females
| Males: | 212 |
| Females: | 196 |
Median age
| Males: | 48.8 years |
| Females: | 53.7 years |
Most popular occupations of males: sales and office occupations (18.7%); management occupations (except farmers) (12.7%); computer and mathematical occupations (12.7%); education, training, and library occupations (9.2%); healthcare practitioners and technical occupations (9.2%); legal occupations (8.6%); service occupations (8.6%)
Most popular occupations of females: sales and office occupations (43.0%); business and financial operations occupations (12.5%); education, training, and library occupations (12.5%); management occupations (except farmers) (6.9%); service occupations (5.1%); arts, design, entertainment, sports, and media occupations (4.8%); legal occupations (4.6%)
Highways in this neighborhood: Hampton Blvd (State Rte 337).
Roads and streets: Cloncurry Rd; N Shore Rd; Gleneagles Rd; Daniel Ave; Blanford Cir; Maury Arch; Argyle Ave; Muirfield Rd; Glencove Pl; St Francis Ln; Commonwealth Ave; Milson Ave; Blanford Rd.
Lochhaven neighborhood detailed profile
Maple Hall neighborhood in Norfolk statistics: (Find on map)
Area: 0.402 square miles
Population: 1,067
Population density:
Median household income in 2021:
Median rent in in 2021:
Male vs Females
Median age
Most popular occupations of males: sales and office occupations (20.4%); service occupations (19.6%); construction, extraction, and maintenance occupations (16.2%); management occupations (except farmers) (12.5%); material moving occupations (9.5%); business and financial operations occupations (3.6%); architecture and engineering occupations (3.4%)
Most popular occupations of females: sales and office occupations (50.2%); service occupations (17.9%); healthcare practitioners and technical occupations (9.1%); management occupations (except farmers) (6.2%); construction, extraction, and maintenance occupations (3.9%); community and social services occupations (3.6%); transportation occupations (3.6%)
Roads and streets: Hudson Ave; Wailes Ave; Cabot Ave; Adair Ave; Winburne Ln; Land St; George St; Taylor Dr; Clarence St; Whaley Ave; Lake Taylor Dr; Wade St; Layton St; Reel St; Tuttle Ave; Newtown Rd; Joan Dr; Dewberry Ln; Cloverleaf St; Boush Way; Whaley Ct.
Maple Hall neighborhood detailed profile
Area: 0.402 square miles
Population: 1,067
Population density:
| Maple Hall (Hollywood Homes): | 2,656 people per square mile |
| Norfolk: | 4,376 people per square mile |
Median household income in 2021:
| Maple Hall (Hollywood Homes): | $64,387 |
| Norfolk: | $58,591 |
Median rent in in 2021:
| Maple Hall (Hollywood Homes): | $1,110 |
| Norfolk: | $938 |
Male vs Females
| Males: | 610 |
| Females: | 457 |
Median age
| Males: | 39.3 years |
| Females: | 40.6 years |
Most popular occupations of males: sales and office occupations (20.4%); service occupations (19.6%); construction, extraction, and maintenance occupations (16.2%); management occupations (except farmers) (12.5%); material moving occupations (9.5%); business and financial operations occupations (3.6%); architecture and engineering occupations (3.4%)
Most popular occupations of females: sales and office occupations (50.2%); service occupations (17.9%); healthcare practitioners and technical occupations (9.1%); management occupations (except farmers) (6.2%); construction, extraction, and maintenance occupations (3.9%); community and social services occupations (3.6%); transportation occupations (3.6%)
Roads and streets: Hudson Ave; Wailes Ave; Cabot Ave; Adair Ave; Winburne Ln; Land St; George St; Taylor Dr; Clarence St; Whaley Ave; Lake Taylor Dr; Wade St; Layton St; Reel St; Tuttle Ave; Newtown Rd; Joan Dr; Dewberry Ln; Cloverleaf St; Boush Way; Whaley Ct.
Maple Hall neighborhood detailed profile
Meadowbrook neighborhood in Norfolk statistics: (Find on map)
Area: 0.091 square miles
Population: 412
Population density:
Median household income in 2021:
Median rent in in 2021:
Male vs Females
Median age
Most popular occupations of males: sales and office occupations (27.3%); construction, extraction, and maintenance occupations (22.1%); production occupations (10.8%); material moving occupations (9.2%); service occupations (7.1%); computer and mathematical occupations (4.5%); transportation occupations (3.2%)
Most popular occupations of females: sales and office occupations (38.4%); education, training, and library occupations (23.6%); business and financial operations occupations (14.2%); service occupations (11.2%); management occupations (except farmers) (3.4%); healthcare practitioners and technical occupations (2.5%); production occupations (2.3%)
Roads and streets: Shirland Ave; Cortlandt Pl; N Shore Rd; Trouville Ave; Runnymede Rd; Meadow Brook Pt; Helena Ave.
Meadowbrook neighborhood detailed profile
Area: 0.091 square miles
Population: 412
Population density:
| Meadowbrook: | 4,523 people per square mile |
| Norfolk: | 4,376 people per square mile |
Median household income in 2021:
| Meadowbrook: | $64,731 |
| Norfolk: | $58,591 |
Median rent in in 2021:
| Meadowbrook: | $984 |
| Norfolk: | $938 |
Male vs Females
| Males: | 240 |
| Females: | 171 |
Median age
| Males: | 34.7 years |
| Females: | 38.1 years |
Most popular occupations of males: sales and office occupations (27.3%); construction, extraction, and maintenance occupations (22.1%); production occupations (10.8%); material moving occupations (9.2%); service occupations (7.1%); computer and mathematical occupations (4.5%); transportation occupations (3.2%)
Most popular occupations of females: sales and office occupations (38.4%); education, training, and library occupations (23.6%); business and financial operations occupations (14.2%); service occupations (11.2%); management occupations (except farmers) (3.4%); healthcare practitioners and technical occupations (2.5%); production occupations (2.3%)
Roads and streets: Shirland Ave; Cortlandt Pl; N Shore Rd; Trouville Ave; Runnymede Rd; Meadow Brook Pt; Helena Ave.
Meadowbrook neighborhood detailed profile
Meadowbrook Forest neighborhood in Norfolk statistics: (Find on map)
Area: 0.496 square miles
Population: 1,107
Population density:
Median household income in 2021:
Median rent in in 2021:
Male vs Females
Median age
Housing prices:
Average estimated value of detached houses in 2021 (85.4% of all units):
Average estimated value of mobile home in 2021 (3.5% of all units):
Most popular occupations of males: material moving occupations (18.8%); production occupations (16.8%); sales and office occupations (11.7%); construction, extraction, and maintenance occupations (8.4%); transportation occupations (7.9%); arts, design, entertainment, sports, and media occupations (7.5%); business and financial operations occupations (4.8%)
Most popular occupations of females: sales and office occupations (34.4%); education, training, and library occupations (15.7%); service occupations (13.7%); management occupations (except farmers) (11.8%); business and financial operations occupations (10.0%); healthcare practitioners and technical occupations (4.5%); community and social services occupations (4.2%)
Roads and streets: Hunters Trl; Springmeadow Blvd; Banning Rd; Meadow Lake Dr; Gardner Dr; Tulane Rd; Longdale Dr; While Ln; Keswick Dr; Pallister Rd; Meadow Lake Ct; Paddock Rd; Fordwick Dr; Kenlake Pl; Foxhound Ln; Woodridge Dr; Colane Rd; Meadowlawn Dr; Citadel Rd; Chironna Pl; Aldow Dr; Chenman St; Hunt Rd; Grimes Ave; Ball Ave; Crafford Ave; Coinbrook Ave; White Hall Rd; Clemson Ave; Trinity Ave; Hunters Ct; Kenlake Ct; Ball Ct.
Meadowbrook Forest neighborhood detailed profile
Area: 0.496 square miles
Population: 1,107
Population density:
| Meadowbrook Forest (Hunt Club): | 2,230 people per square mile |
| Norfolk: | 4,376 people per square mile |
Median household income in 2021:
| Meadowbrook Forest (Hunt Club): | $70,701 |
| Norfolk: | $58,591 |
Median rent in in 2021:
| Meadowbrook Forest (Hunt Club): | $873 |
| Norfolk: | $938 |
Male vs Females
| Males: | 541 |
| Females: | 566 |
Median age
| Males: | 41.6 years |
| Females: | 49.9 years |
Housing prices:
Average estimated value of detached houses in 2021 (85.4% of all units):
| Meadowbrook Forest (Hunt Club): | $276,275 |
| Norfolk: | $306,640 |
Average estimated value of mobile home in 2021 (3.5% of all units):
| Meadowbrook Forest (Hunt Club): | $12,746 |
| Norfolk: | $23,245 |
Most popular occupations of males: material moving occupations (18.8%); production occupations (16.8%); sales and office occupations (11.7%); construction, extraction, and maintenance occupations (8.4%); transportation occupations (7.9%); arts, design, entertainment, sports, and media occupations (7.5%); business and financial operations occupations (4.8%)
Most popular occupations of females: sales and office occupations (34.4%); education, training, and library occupations (15.7%); service occupations (13.7%); management occupations (except farmers) (11.8%); business and financial operations occupations (10.0%); healthcare practitioners and technical occupations (4.5%); community and social services occupations (4.2%)
Roads and streets: Hunters Trl; Springmeadow Blvd; Banning Rd; Meadow Lake Dr; Gardner Dr; Tulane Rd; Longdale Dr; While Ln; Keswick Dr; Pallister Rd; Meadow Lake Ct; Paddock Rd; Fordwick Dr; Kenlake Pl; Foxhound Ln; Woodridge Dr; Colane Rd; Meadowlawn Dr; Citadel Rd; Chironna Pl; Aldow Dr; Chenman St; Hunt Rd; Grimes Ave; Ball Ave; Crafford Ave; Coinbrook Ave; White Hall Rd; Clemson Ave; Trinity Ave; Hunters Ct; Kenlake Ct; Ball Ct.
Meadowbrook Forest neighborhood detailed profile
Middle Towne Arch neighborhood in Norfolk statistics: (Find on map)
Area: 0.099 square miles
Population: 602
Population density:
Median household income in 2021:
Median rent in in 2021:
Male vs Females
Median age
Most popular occupations of males: sales and office occupations (20.2%); service occupations (19.7%); management occupations (except farmers) (6.6%); transportation occupations (4.7%); construction, extraction, and maintenance occupations (4.4%); business and financial operations occupations (2.4%); community and social services occupations (2.2%)
Most popular occupations of females: sales and office occupations (46.4%); service occupations (19.1%); education, training, and library occupations (13.2%); material moving occupations (5.5%); management occupations (except farmers) (4.6%); healthcare practitioners and technical occupations (3.8%); life, physical, and social science occupations (3.0%)
Roads and streets: Middle Towne Cres; Middle Towne Mews; Cochise Cres (Colchester Cres); Gate House Rd; Ballentine Blvd; Park Cres; Merrimac Ave; Norchester St; Godfrey Ave; Downham Way; Lakebridge Dr.
Middle Towne Arch neighborhood detailed profile
Area: 0.099 square miles
Population: 602
Population density:
| Middle Towne Arch: | 6,056 people per square mile |
| Norfolk: | 4,376 people per square mile |
Median household income in 2021:
| Middle Towne Arch: | $75,865 |
| Norfolk: | $58,591 |
Median rent in in 2021:
| Middle Towne Arch: | $1,018 |
| Norfolk: | $938 |
Male vs Females
| Males: | 293 |
| Females: | 308 |
Median age
| Males: | 25.5 years |
| Females: | 41.1 years |
Most popular occupations of males: sales and office occupations (20.2%); service occupations (19.7%); management occupations (except farmers) (6.6%); transportation occupations (4.7%); construction, extraction, and maintenance occupations (4.4%); business and financial operations occupations (2.4%); community and social services occupations (2.2%)
Most popular occupations of females: sales and office occupations (46.4%); service occupations (19.1%); education, training, and library occupations (13.2%); material moving occupations (5.5%); management occupations (except farmers) (4.6%); healthcare practitioners and technical occupations (3.8%); life, physical, and social science occupations (3.0%)
Roads and streets: Middle Towne Cres; Middle Towne Mews; Cochise Cres (Colchester Cres); Gate House Rd; Ballentine Blvd; Park Cres; Merrimac Ave; Norchester St; Godfrey Ave; Downham Way; Lakebridge Dr.
Middle Towne Arch neighborhood detailed profile
Military Circle neighborhood in Norfolk statistics: (Find on map)
Area: 0.207 square miles
Population: 217
Population density:
Median household income in 2021:
Median rent in in 2021:
Male vs Females
Median age
Average estimated value of detached houses in 2021 (61.8% of all units):
Most popular occupations of males: construction, extraction, and maintenance occupations (14.4%); community and social services occupations (11.8%); service occupations (11.6%); education, training, and library occupations (11.2%); production occupations (11.0%); management occupations (except farmers) (10.2%); computer and mathematical occupations (5.0%)
Most popular occupations of females: service occupations (40.8%); sales and office occupations (26.8%); management occupations (except farmers) (19.2%); education, training, and library occupations (5.1%); production occupations (5.1%); business and financial operations occupations (4.0%); community and social services occupations (3.1%)
Highways in this neighborhood: US Hwy 13 (N Military Hwy).
Roads and streets: Poplar Hall Dr; Glenrock Rd.
Military Circle neighborhood detailed profile
Area: 0.207 square miles
Population: 217
Population density:
| Military Circle: | 1,048 people per square mile |
| Norfolk: | 4,376 people per square mile |
Median household income in 2021:
| Military Circle: | $64,301 |
| Norfolk: | $58,591 |
Median rent in in 2021:
| Military Circle: | $815 |
| Norfolk: | $938 |
Male vs Females
| Males: | 114 |
| Females: | 102 |
Median age
| Males: | 30.9 years |
| Females: | 45.6 years |
Average estimated value of detached houses in 2021 (61.8% of all units):
| Military Circle: | $208,013 |
| Norfolk: | $306,640 |
Most popular occupations of males: construction, extraction, and maintenance occupations (14.4%); community and social services occupations (11.8%); service occupations (11.6%); education, training, and library occupations (11.2%); production occupations (11.0%); management occupations (except farmers) (10.2%); computer and mathematical occupations (5.0%)
Most popular occupations of females: service occupations (40.8%); sales and office occupations (26.8%); management occupations (except farmers) (19.2%); education, training, and library occupations (5.1%); production occupations (5.1%); business and financial operations occupations (4.0%); community and social services occupations (3.1%)
Highways in this neighborhood: US Hwy 13 (N Military Hwy).
Roads and streets: Poplar Hall Dr; Glenrock Rd.
Military Circle neighborhood detailed profile
Monticello Village neighborhood in Norfolk statistics: (Find on map)
Area: 0.151 square miles
Population: 1,455
Population density:
Median household income in 2021:
Median rent in in 2021:
Male vs Females
Median age
Average estimated value of detached houses in 2021 (59.0% of all units):
Most popular occupations of males: sales and office occupations (45.5%); production occupations (14.7%); transportation occupations (11.9%); management occupations (except farmers) (11.7%); business and financial operations occupations (3.3%); healthcare practitioners and technical occupations (1.8%); computer and mathematical occupations (1.4%)
Most popular occupations of females: sales and office occupations (43.3%); service occupations (24.3%); education, training, and library occupations (15.5%); production occupations (5.7%); material moving occupations (4.4%); transportation occupations (3.9%); healthcare practitioners and technical occupations (2.5%)
Highways in this neighborhood: State Rte 165 (E Little Creek Rd).
Roads and streets: W Glen Rd; E Glen Rd; Ashlawn Dr; Galveston Blvd; Crescent Rd; Dixie Dr; Keene Rd; Roxboro Rd; Bee Pl; Cee Pl; Fort Worth Ave.
Monticello Village neighborhood detailed profile
Area: 0.151 square miles
Population: 1,455
Population density:
| Monticello Village: | 9,664 people per square mile |
| Norfolk: | 4,376 people per square mile |
Median household income in 2021:
| Monticello Village: | $50,425 |
| Norfolk: | $58,591 |
Median rent in in 2021:
| Monticello Village: | $894 |
| Norfolk: | $938 |
Male vs Females
| Males: | 702 |
| Females: | 753 |
Median age
| Males: | 41.0 years |
| Females: | 26.8 years |
Average estimated value of detached houses in 2021 (59.0% of all units):
| Monticello Village: | $125,714 |
| Norfolk: | $306,640 |
Most popular occupations of males: sales and office occupations (45.5%); production occupations (14.7%); transportation occupations (11.9%); management occupations (except farmers) (11.7%); business and financial operations occupations (3.3%); healthcare practitioners and technical occupations (1.8%); computer and mathematical occupations (1.4%)
Most popular occupations of females: sales and office occupations (43.3%); service occupations (24.3%); education, training, and library occupations (15.5%); production occupations (5.7%); material moving occupations (4.4%); transportation occupations (3.9%); healthcare practitioners and technical occupations (2.5%)
Highways in this neighborhood: State Rte 165 (E Little Creek Rd).
Roads and streets: W Glen Rd; E Glen Rd; Ashlawn Dr; Galveston Blvd; Crescent Rd; Dixie Dr; Keene Rd; Roxboro Rd; Bee Pl; Cee Pl; Fort Worth Ave.
Monticello Village neighborhood detailed profile
Newtown neighborhood in Norfolk statistics: (Find on map)
Area: 0.122 square miles
Population: 543
Population density:
Median household income in 2021:
Median rent in in 2021:
Male vs Females
Median age
Housing prices:
Average estimated value of detached houses in 2021 (41.1% of all units):
Average estimated value of townhouses or other attached units in 2021 (32.9% of all units):
Most popular occupations of males: community and social services occupations (21.5%); material moving occupations (15.7%); sales and office occupations (14.6%); service occupations (12.2%); production occupations (7.8%); management occupations (except farmers) (3.2%); architecture and engineering occupations (2.0%)
Most popular occupations of females: sales and office occupations (35.1%); service occupations (33.1%); production occupations (7.7%); management occupations (except farmers) (6.9%); material moving occupations (5.4%); business and financial operations occupations (5.2%); education, training, and library occupations (2.8%)
Roads and streets: Stoney Pt S; Monmouth Ln; Cornwallis Ln; Paul Jones Ln; State Rte 403 (N Newtown Rd, Newtown Rd); Stoney Pt N; Brandywine Ln; Nevell Dr; Stanwix Sq; John Hancock Ln; Taft St; Dolly Madison Ln; Pawnee Dr; Ethan Allen Ln; Lear St; Heber St; James Madison Ln; Ventura Dr; Napa St; Yuma St; Hawk St; Seal St.
Roads and streets: State Rte 403 (N Newtown Rd, Newtown Rd).
Newtown neighborhood detailed profile
Area: 0.122 square miles
Population: 543
Population density:
| Newtown: | 4,443 people per square mile |
| Norfolk: | 4,376 people per square mile |
Median household income in 2021:
| Newtown: | $62,166 |
| Norfolk: | $58,591 |
Median rent in in 2021:
| Newtown: | $1,316 |
| Norfolk: | $938 |
Male vs Females
| Males: | 298 |
| Females: | 245 |
Median age
| Males: | 29.2 years |
| Females: | 31.1 years |
Housing prices:
Average estimated value of detached houses in 2021 (41.1% of all units):
| Newtown: | $226,441 |
| Norfolk: | $306,640 |
Average estimated value of townhouses or other attached units in 2021 (32.9% of all units):
| This neighborhood: | $141,068 |
| city: | $267,013 |
Most popular occupations of males: community and social services occupations (21.5%); material moving occupations (15.7%); sales and office occupations (14.6%); service occupations (12.2%); production occupations (7.8%); management occupations (except farmers) (3.2%); architecture and engineering occupations (2.0%)
Most popular occupations of females: sales and office occupations (35.1%); service occupations (33.1%); production occupations (7.7%); management occupations (except farmers) (6.9%); material moving occupations (5.4%); business and financial operations occupations (5.2%); education, training, and library occupations (2.8%)
Roads and streets: Stoney Pt S; Monmouth Ln; Cornwallis Ln; Paul Jones Ln; State Rte 403 (N Newtown Rd, Newtown Rd); Stoney Pt N; Brandywine Ln; Nevell Dr; Stanwix Sq; John Hancock Ln; Taft St; Dolly Madison Ln; Pawnee Dr; Ethan Allen Ln; Lear St; Heber St; James Madison Ln; Ventura Dr; Napa St; Yuma St; Hawk St; Seal St.
Roads and streets: State Rte 403 (N Newtown Rd, Newtown Rd).
Newtown neighborhood detailed profile
Norfolk Crossing neighborhood in Norfolk statistics: (Find on map)
Area: 0.033 square miles
Roads and streets: Norfolk Crossing Ave; Wherry Rd (N Bristol Ct, Walsingham Way); Guestwick Cres; Royal Windsor Loop; Fechteller Rd.
Norfolk Crossing neighborhood detailed profile
Area: 0.033 square miles
Roads and streets: Norfolk Crossing Ave; Wherry Rd (N Bristol Ct, Walsingham Way); Guestwick Cres; Royal Windsor Loop; Fechteller Rd.
Norfolk Crossing neighborhood detailed profile
Norfolk Garden neighborhood in Norfolk statistics: (Find on map)
Area: 0.141 square miles
Population: 870
Population density:
Median household income in 2021:
Median rent in in 2021:
Male vs Females
Median age
Average estimated value of detached houses in 2021 (90.5% of all units):
Most popular occupations of males: service occupations (70.1%); production occupations (15.6%); architecture and engineering occupations (7.2%); construction, extraction, and maintenance occupations (4.5%); material moving occupations (1.8%); arts, design, entertainment, sports, and media occupations (1.4%)
Most popular occupations of females: sales and office occupations (29.6%); education, training, and library occupations (24.0%); production occupations (19.9%); healthcare practitioners and technical occupations (11.0%); service occupations (5.4%); community and social services occupations (4.9%); material moving occupations (4.9%)
Roads and streets: Hugo St; Bland St; Green St; Norview Ave; Ivaloo St; Pamlico Cir; Defoe Ave; Wayne Cir; Sewells Point Rd; Garden St; Hyde Cir; Lenoir Cir; Vaiden St.
Norfolk Garden neighborhood detailed profile
Area: 0.141 square miles
Population: 870
Population density:
| Norfolk Garden: | 6,159 people per square mile |
| Norfolk: | 4,376 people per square mile |
Median household income in 2021:
| Norfolk Garden: | $37,856 |
| Norfolk: | $58,591 |
Median rent in in 2021:
| Norfolk Garden: | $775 |
| Norfolk: | $938 |
Male vs Females
| Males: | 363 |
| Females: | 507 |
Median age
| Males: | 38.1 years |
| Females: | 31.3 years |
Average estimated value of detached houses in 2021 (90.5% of all units):
| Norfolk Garden: | $146,000 |
| Norfolk: | $306,640 |
Most popular occupations of males: service occupations (70.1%); production occupations (15.6%); architecture and engineering occupations (7.2%); construction, extraction, and maintenance occupations (4.5%); material moving occupations (1.8%); arts, design, entertainment, sports, and media occupations (1.4%)
Most popular occupations of females: sales and office occupations (29.6%); education, training, and library occupations (24.0%); production occupations (19.9%); healthcare practitioners and technical occupations (11.0%); service occupations (5.4%); community and social services occupations (4.9%); material moving occupations (4.9%)
Roads and streets: Hugo St; Bland St; Green St; Norview Ave; Ivaloo St; Pamlico Cir; Defoe Ave; Wayne Cir; Sewells Point Rd; Garden St; Hyde Cir; Lenoir Cir; Vaiden St.
Norfolk Garden neighborhood detailed profile
Norfolk Industrial Park neighborhood in Norfolk statistics: (Find on map)
Area: 0.875 square miles
Population: 2,000
Population density:
Median household income in 2021:
Median rent in in 2021:
Male vs Females
Median age
Average estimated value of detached houses in 2021 (73.4% of all units):
Most popular occupations of males: business and financial operations occupations (18.0%); service occupations (17.0%); sales and office occupations (16.6%); construction, extraction, and maintenance occupations (9.0%); management occupations (except farmers) (5.1%); material moving occupations (4.7%); architecture and engineering occupations (3.8%)
Most popular occupations of females: service occupations (28.5%); sales and office occupations (21.5%); healthcare practitioners and technical occupations (8.8%); production occupations (7.4%); business and financial operations occupations (6.5%); transportation occupations (5.6%); management occupations (except farmers) (5.4%)
Highways in this neighborhood: US Hwy 58 (E Virginia Beach Blvd).
Roads and streets: Village Ave; Progress Rd; Ingleside Rd; Azalea Garden Rd; Production Rd; Norfolk Sq; Brookside Ct; Kingwood Ave; Patent Rd; Inventors Rd; Gondola Rd; Sewells Point Rd; Pineridge Rd; Enterprise Rd.
Other features: Broad Crk.
Norfolk Industrial Park neighborhood detailed profile
Area: 0.875 square miles
Population: 2,000
Population density:
| Norfolk Industrial Park: | 2,285 people per square mile |
| Norfolk: | 4,376 people per square mile |
Median household income in 2021:
| Norfolk Industrial Park: | $56,522 |
| Norfolk: | $58,591 |
Median rent in in 2021:
| Norfolk Industrial Park: | $849 |
| Norfolk: | $938 |
Male vs Females
| Males: | 1,052 |
| Females: | 947 |
Median age
| Males: | 38.3 years |
| Females: | 38.5 years |
Average estimated value of detached houses in 2021 (73.4% of all units):
| Norfolk Industrial Park: | $191,651 |
| Norfolk: | $306,640 |
Most popular occupations of males: business and financial operations occupations (18.0%); service occupations (17.0%); sales and office occupations (16.6%); construction, extraction, and maintenance occupations (9.0%); management occupations (except farmers) (5.1%); material moving occupations (4.7%); architecture and engineering occupations (3.8%)
Most popular occupations of females: service occupations (28.5%); sales and office occupations (21.5%); healthcare practitioners and technical occupations (8.8%); production occupations (7.4%); business and financial operations occupations (6.5%); transportation occupations (5.6%); management occupations (except farmers) (5.4%)
Highways in this neighborhood: US Hwy 58 (E Virginia Beach Blvd).
Roads and streets: Village Ave; Progress Rd; Ingleside Rd; Azalea Garden Rd; Production Rd; Norfolk Sq; Brookside Ct; Kingwood Ave; Patent Rd; Inventors Rd; Gondola Rd; Sewells Point Rd; Pineridge Rd; Enterprise Rd.
Other features: Broad Crk.
Norfolk Industrial Park neighborhood detailed profile
North Camellia Acres neighborhood in Norfolk statistics: (Find on map)
Area: 0.362 square miles
Population: 987
Population density:
Median household income in 2021:
Median rent in in 2021:
Male vs Females
Median age
Housing prices:
Average estimated value of detached houses in 2021 (96.1% of all units):
Average estimated value of townhouses or other attached units in 2021 (4.3% of all units):
Most popular occupations of males: sales and office occupations (21.8%); management occupations (except farmers) (12.7%); service occupations (10.7%); healthcare practitioners and technical occupations (9.5%); education, training, and library occupations (7.1%); construction, extraction, and maintenance occupations (6.6%); material moving occupations (5.5%)
Most popular occupations of females: sales and office occupations (36.2%); service occupations (20.2%); healthcare practitioners and technical occupations (14.2%); business and financial operations occupations (10.7%); education, training, and library occupations (5.6%); management occupations (except farmers) (5.1%); architecture and engineering occupations (2.7%)
Highways in this neighborhood: State Rte 170 (E Little Creek Rd).
Roads and streets: Dominion Ave; Walters Dr; Ridgefield Dr; Jerrylee Dr; Tarpon Pl; Malden Ave; Rankin Ave; Creekwood Rd; Lynnbrook Dr; David Ave; Deerfield Rd; E Malden Ave; Ferncliff Rd; Nancy Dr; Alida Dr; Azalea Garden Rd; Kirby Haigh Cir; Brookfield Rd; Somerset Ln; Tarpon Ct; Winstead Ct; Winstead Rd; Walters Ct; Cavern Ct; Webb Ct; Lynnbrook Ct; Rankin Ct; Alida Ct; Creekwood Ct; Jerrylee Ct; Nancy Ct; David Ct; Ridgefield Ct; Jolliff Ct.
North Camellia Acres neighborhood detailed profile
Area: 0.362 square miles
Population: 987
Population density:
| North Camellia Acres: | 2,725 people per square mile |
| Norfolk: | 4,376 people per square mile |
Median household income in 2021:
| North Camellia Acres: | $76,008 |
| Norfolk: | $58,591 |
Median rent in in 2021:
| North Camellia Acres: | $1,227 |
| Norfolk: | $938 |
Male vs Females
| Males: | 492 |
| Females: | 495 |
Median age
| Males: | 41.7 years |
| Females: | 43.4 years |
Housing prices:
Average estimated value of detached houses in 2021 (96.1% of all units):
| North Camellia Acres: | $265,632 |
| Norfolk: | $306,640 |
Average estimated value of townhouses or other attached units in 2021 (4.3% of all units):
| This neighborhood: | $235,600 |
| city: | $267,013 |
Most popular occupations of males: sales and office occupations (21.8%); management occupations (except farmers) (12.7%); service occupations (10.7%); healthcare practitioners and technical occupations (9.5%); education, training, and library occupations (7.1%); construction, extraction, and maintenance occupations (6.6%); material moving occupations (5.5%)
Most popular occupations of females: sales and office occupations (36.2%); service occupations (20.2%); healthcare practitioners and technical occupations (14.2%); business and financial operations occupations (10.7%); education, training, and library occupations (5.6%); management occupations (except farmers) (5.1%); architecture and engineering occupations (2.7%)
Highways in this neighborhood: State Rte 170 (E Little Creek Rd).
Roads and streets: Dominion Ave; Walters Dr; Ridgefield Dr; Jerrylee Dr; Tarpon Pl; Malden Ave; Rankin Ave; Creekwood Rd; Lynnbrook Dr; David Ave; Deerfield Rd; E Malden Ave; Ferncliff Rd; Nancy Dr; Alida Dr; Azalea Garden Rd; Kirby Haigh Cir; Brookfield Rd; Somerset Ln; Tarpon Ct; Winstead Ct; Winstead Rd; Walters Ct; Cavern Ct; Webb Ct; Lynnbrook Ct; Rankin Ct; Alida Ct; Creekwood Ct; Jerrylee Ct; Nancy Ct; David Ct; Ridgefield Ct; Jolliff Ct.
North Camellia Acres neighborhood detailed profile
North Meadow Brook neighborhood in Norfolk statistics: (Find on map)
Area: 0.203 square miles
Population: 1,383
Population density:
Median household income in 2021:
Median rent in in 2021:
Male vs Females
Median age
Most popular occupations of males: sales and office occupations (28.4%); construction, extraction, and maintenance occupations (24.7%); production occupations (12.2%); material moving occupations (10.0%); service occupations (7.0%); computer and mathematical occupations (3.4%); transportation occupations (2.9%)
Most popular occupations of females: sales and office occupations (37.6%); education, training, and library occupations (25.6%); business and financial operations occupations (14.5%); service occupations (12.2%); management occupations (except farmers) (2.8%); production occupations (2.7%); computer and mathematical occupations (2.2%)
Highways in this neighborhood: State Rte 165 (W Little Creek Rd).
Roads and streets: Meads Rd; Major Ave; Tapley Ave; Harrison Rd; Paul St; Enfield Ave; Castleton Pl; Cortlandt Pl; Lambert Pl; N Shirland Ave; Marion St; N Shore Rd; Dunfield Pl; Trouville Ave.
Railroad features: Norfolk Southern Rlwy.
North Meadow Brook neighborhood detailed profile
Area: 0.203 square miles
Population: 1,383
Population density:
| North Meadow Brook: | 6,823 people per square mile |
| Norfolk: | 4,376 people per square mile |
Median household income in 2021:
| North Meadow Brook: | $65,529 |
| Norfolk: | $58,591 |
Median rent in in 2021:
| North Meadow Brook: | $983 |
| Norfolk: | $938 |
Male vs Females
| Males: | 820 |
| Females: | 563 |
Median age
| Males: | 34.5 years |
| Females: | 36.3 years |
Most popular occupations of males: sales and office occupations (28.4%); construction, extraction, and maintenance occupations (24.7%); production occupations (12.2%); material moving occupations (10.0%); service occupations (7.0%); computer and mathematical occupations (3.4%); transportation occupations (2.9%)
Most popular occupations of females: sales and office occupations (37.6%); education, training, and library occupations (25.6%); business and financial operations occupations (14.5%); service occupations (12.2%); management occupations (except farmers) (2.8%); production occupations (2.7%); computer and mathematical occupations (2.2%)
Highways in this neighborhood: State Rte 165 (W Little Creek Rd).
Roads and streets: Meads Rd; Major Ave; Tapley Ave; Harrison Rd; Paul St; Enfield Ave; Castleton Pl; Cortlandt Pl; Lambert Pl; N Shirland Ave; Marion St; N Shore Rd; Dunfield Pl; Trouville Ave.
Railroad features: Norfolk Southern Rlwy.
North Meadow Brook neighborhood detailed profile
Northside neighborhood in Norfolk statistics: (Find on map)
Area: 1.312 square miles
Population: 9,053
Population density:
Median household income in 2021:
Median rent in in 2021:
Male vs Females
Median age
Housing prices:
Average estimated value of detached houses in 2021 (62.1% of all units):
Average estimated value of townhouses or other attached units in 2021 (9.5% of all units):
Average estimated value of housing units in 2-unit structures in 2021 (7.3% of all units):
Average estimated '21 value of housing units in 3-to-4-unit structures (11.0% of all units):
Average estimated '21 value of housing units in 5-or-more-unit structures (8.4% of all units):
Most popular occupations of males: sales and office occupations (18.4%); construction, extraction, and maintenance occupations (18.4%); service occupations (17.6%); management occupations (except farmers) (9.4%); production occupations (5.5%); material moving occupations (4.3%); healthcare practitioners and technical occupations (3.8%)
Most popular occupations of females: sales and office occupations (37.3%); service occupations (24.6%); management occupations (except farmers) (7.8%); education, training, and library occupations (6.4%); healthcare practitioners and technical occupations (5.1%); business and financial operations occupations (4.8%); community and social services occupations (4.0%)
Limited-access highways (interstate or state) in this neighborhood: I- 64.
Highways in this neighborhood: US Hwy 460 (Granby St); State Rte 168 (Tidewater Dr); State Rte 194 (Chesapeake Blvd).
Roads and streets: E Bayview Blvd; Hammett Ave; Old Ocean View Rd; Dune St; E Chester St; Farrell St; E Westmont Ave; E Leicester Ave; E Gilpin Ave; E Evans St; Lenox Ave; Commodore Dr; E Lorengo Ave; Executive Dr; E Randall Ave; Woodford St; Stratford St; Dudley Ave; W Bayview Blvd; E Ocean Ave; Beck St; Earl St; Haven Dr; W Evans St; Winshire St; E Bay Ave; Pinedale St; Belgrave Ave; W Leicester Ave; W Ocean Ave; W Bay Ave; W Lorengo Ave; Euwanee Pl; Saint George Ave; Warwick Ave; W Randall Ave; Semmes Ave; Ocella Ave; Norfolk Ave; Howe St; New St; W Chester St; Culfor Cres; Fresh Meadow Rd; Swanson Rd; Mariners Way; Meadowbrook Ln; Circle Dr; Burrage Rd; Neoma Dr; Beach View St; Lembla St; Creamer Rd; W Gilpin Ave; Chapin St; Rodman Rd; Twilley St; W Westmont Ave; Mace Ave; Gramel St; Louvett St; Louvick St; Blades St; Mace Arch; Richardson St; Green View Ln; Landale Rd; Lawson Ave; Kenilworth Rd; Margaret Ave; Mariners Cove; Cap Ln; Commodore Pl; Sloane St; Circle Ct; Rosemar Ct; Commodore Overlook.
Other features: Mason Crk.
Northside neighborhood detailed profile
Area: 1.312 square miles
Population: 9,053
Population density:
| Northside: | 6,901 people per square mile |
| Norfolk: | 4,376 people per square mile |
Median household income in 2021:
| Northside: | $58,619 |
| Norfolk: | $58,591 |
Median rent in in 2021:
| Northside: | $1,024 |
| Norfolk: | $938 |
Male vs Females
| Males: | 4,492 |
| Females: | 4,561 |
Median age
| Males: | 34.9 years |
| Females: | 38.1 years |
Housing prices:
Average estimated value of detached houses in 2021 (62.1% of all units):
| Northside: | $210,781 |
| Norfolk: | $306,640 |
Average estimated value of townhouses or other attached units in 2021 (9.5% of all units):
| This neighborhood: | $291,207 |
| city: | $267,013 |
Average estimated value of housing units in 2-unit structures in 2021 (7.3% of all units):
| This neighborhood: | $138,924 |
| Norfolk: | $250,782 |
Average estimated '21 value of housing units in 3-to-4-unit structures (11.0% of all units):
| Northside: | $130,580 |
| city: | $117,518 |
Average estimated '21 value of housing units in 5-or-more-unit structures (8.4% of all units):
| Northside: | $91,700 |
| Norfolk: | $260,910 |
Most popular occupations of males: sales and office occupations (18.4%); construction, extraction, and maintenance occupations (18.4%); service occupations (17.6%); management occupations (except farmers) (9.4%); production occupations (5.5%); material moving occupations (4.3%); healthcare practitioners and technical occupations (3.8%)
Most popular occupations of females: sales and office occupations (37.3%); service occupations (24.6%); management occupations (except farmers) (7.8%); education, training, and library occupations (6.4%); healthcare practitioners and technical occupations (5.1%); business and financial operations occupations (4.8%); community and social services occupations (4.0%)
Limited-access highways (interstate or state) in this neighborhood: I- 64.
Highways in this neighborhood: US Hwy 460 (Granby St); State Rte 168 (Tidewater Dr); State Rte 194 (Chesapeake Blvd).
Roads and streets: E Bayview Blvd; Hammett Ave; Old Ocean View Rd; Dune St; E Chester St; Farrell St; E Westmont Ave; E Leicester Ave; E Gilpin Ave; E Evans St; Lenox Ave; Commodore Dr; E Lorengo Ave; Executive Dr; E Randall Ave; Woodford St; Stratford St; Dudley Ave; W Bayview Blvd; E Ocean Ave; Beck St; Earl St; Haven Dr; W Evans St; Winshire St; E Bay Ave; Pinedale St; Belgrave Ave; W Leicester Ave; W Ocean Ave; W Bay Ave; W Lorengo Ave; Euwanee Pl; Saint George Ave; Warwick Ave; W Randall Ave; Semmes Ave; Ocella Ave; Norfolk Ave; Howe St; New St; W Chester St; Culfor Cres; Fresh Meadow Rd; Swanson Rd; Mariners Way; Meadowbrook Ln; Circle Dr; Burrage Rd; Neoma Dr; Beach View St; Lembla St; Creamer Rd; W Gilpin Ave; Chapin St; Rodman Rd; Twilley St; W Westmont Ave; Mace Ave; Gramel St; Louvett St; Louvick St; Blades St; Mace Arch; Richardson St; Green View Ln; Landale Rd; Lawson Ave; Kenilworth Rd; Margaret Ave; Mariners Cove; Cap Ln; Commodore Pl; Sloane St; Circle Ct; Rosemar Ct; Commodore Overlook.
Other features: Mason Crk.
Northside neighborhood detailed profile
Norvella Heights neighborhood in Norfolk statistics: (Find on map)
Area: 0.217 square miles
Population: 776
Population density:
Median household income in 2021:
Median rent in in 2021:
Male vs Females
Median age
Average estimated value of detached houses in 2021 (78.9% of all units):
Most popular occupations of males: service occupations (33.1%); transportation occupations (30.1%); sales and office occupations (5.6%); production occupations (5.4%); management occupations (except farmers) (4.7%); material moving occupations (4.7%); education, training, and library occupations (3.6%)
Most popular occupations of females: sales and office occupations (50.7%); healthcare practitioners and technical occupations (17.8%); service occupations (16.7%); legal occupations (12.7%); education, training, and library occupations (8.5%); transportation occupations (8.1%); computer and mathematical occupations (4.4%)
Highways in this neighborhood: State Rte 165 (N Military Hwy).
Roads and streets: Norvella Ave; Iowa Ave; Thomas St; Texas Ave; Azalea Garden Rd; Johns St; Bertha St; Bessie St; Janet Dr; Thurston St; Vivian St; Windermere Ave; Poston Ln; Waycross Rd; Bess St; Jacquelyn Ct; Le Page Rd; Christopher Ct; Macon Ct; Norvella Ct.
Norvella Heights neighborhood detailed profile
Area: 0.217 square miles
Population: 776
Population density:
| Norvella Heights: | 3,578 people per square mile |
| Norfolk: | 4,376 people per square mile |
Median household income in 2021:
| Norvella Heights: | $54,824 |
| Norfolk: | $58,591 |
Median rent in in 2021:
| Norvella Heights: | $719 |
| Norfolk: | $938 |
Male vs Females
| Males: | 393 |
| Females: | 382 |
Median age
| Males: | 36.2 years |
| Females: | 31.4 years |
Average estimated value of detached houses in 2021 (78.9% of all units):
| Norvella Heights: | $159,951 |
| Norfolk: | $306,640 |
Most popular occupations of males: service occupations (33.1%); transportation occupations (30.1%); sales and office occupations (5.6%); production occupations (5.4%); management occupations (except farmers) (4.7%); material moving occupations (4.7%); education, training, and library occupations (3.6%)
Most popular occupations of females: sales and office occupations (50.7%); healthcare practitioners and technical occupations (17.8%); service occupations (16.7%); legal occupations (12.7%); education, training, and library occupations (8.5%); transportation occupations (8.1%); computer and mathematical occupations (4.4%)
Highways in this neighborhood: State Rte 165 (N Military Hwy).
Roads and streets: Norvella Ave; Iowa Ave; Thomas St; Texas Ave; Azalea Garden Rd; Johns St; Bertha St; Bessie St; Janet Dr; Thurston St; Vivian St; Windermere Ave; Poston Ln; Waycross Rd; Bess St; Jacquelyn Ct; Le Page Rd; Christopher Ct; Macon Ct; Norvella Ct.
Norvella Heights neighborhood detailed profile
Norview neighborhood in Norfolk statistics: (Find on map)
Area: 0.530 square miles
Population: 1,409
Population density:
Median household income in 2021:
Median rent in in 2021:
Male vs Females
Median age
Average estimated value of detached houses in 2021 (35.2% of all units):
Most popular occupations of males: service occupations (26.7%); production occupations (13.9%); material moving occupations (12.6%); construction, extraction, and maintenance occupations (9.4%); sales and office occupations (7.8%); transportation occupations (6.8%); business and financial operations occupations (4.3%)
Most popular occupations of females: service occupations (35.1%); sales and office occupations (19.0%); legal occupations (8.7%); management occupations (except farmers) (7.5%); education, training, and library occupations (7.3%); business and financial operations occupations (6.0%); production occupations (4.9%)
Limited-access highways (interstate or state) in this neighborhood: I- 64.
Highways in this neighborhood: State Rte 247 (Chesapeake Blvd).
Roads and streets: Norview Ave; Central Ave; Wellington St; Alexander St; Nassau Ave; Strand St; Picadilly St; Nansemond Cir; South Ave; Wayne Cir; Lenoir Cir; Dundale Ave; Wake Cir; Chatham Cir; Giles Cir; Dare Cir; Middleton Pl; Pall Mall St; Abingdon Cir; Jefferson Ct; Wayne Cres; Pamlico Cir; Norview Arch; Underwood Ave; Essex Cir; Pilot Ave; Faraday Ct; Wellington Ct; Curie Ct; Bunsen Ct; Craven Cir; Pasteur Ct; Sorby Ct; Diesel Ct; Picadilly Sq; Latimer Cir; Harvey Ct.
Other features: Wayne Crk.
Norview neighborhood detailed profile
Area: 0.530 square miles
Population: 1,409
Population density:
| Norview: | 2,656 people per square mile |
| Norfolk: | 4,376 people per square mile |
Median household income in 2021:
| Norview: | $40,874 |
| Norfolk: | $58,591 |
Median rent in in 2021:
| Norview: | $650 |
| Norfolk: | $938 |
Male vs Females
| Males: | 622 |
| Females: | 786 |
Median age
| Males: | 28.6 years |
| Females: | 26.8 years |
Average estimated value of detached houses in 2021 (35.2% of all units):
| Norview: | $472,690 |
| Norfolk: | $306,640 |
Most popular occupations of males: service occupations (26.7%); production occupations (13.9%); material moving occupations (12.6%); construction, extraction, and maintenance occupations (9.4%); sales and office occupations (7.8%); transportation occupations (6.8%); business and financial operations occupations (4.3%)
Most popular occupations of females: service occupations (35.1%); sales and office occupations (19.0%); legal occupations (8.7%); management occupations (except farmers) (7.5%); education, training, and library occupations (7.3%); business and financial operations occupations (6.0%); production occupations (4.9%)
Limited-access highways (interstate or state) in this neighborhood: I- 64.
Highways in this neighborhood: State Rte 247 (Chesapeake Blvd).
Roads and streets: Norview Ave; Central Ave; Wellington St; Alexander St; Nassau Ave; Strand St; Picadilly St; Nansemond Cir; South Ave; Wayne Cir; Lenoir Cir; Dundale Ave; Wake Cir; Chatham Cir; Giles Cir; Dare Cir; Middleton Pl; Pall Mall St; Abingdon Cir; Jefferson Ct; Wayne Cres; Pamlico Cir; Norview Arch; Underwood Ave; Essex Cir; Pilot Ave; Faraday Ct; Wellington Ct; Curie Ct; Bunsen Ct; Craven Cir; Pasteur Ct; Sorby Ct; Diesel Ct; Picadilly Sq; Latimer Cir; Harvey Ct.
Other features: Wayne Crk.
Norview neighborhood detailed profile
Oakdale Farms neighborhood in Norfolk statistics: (Find on map)
Area: 0.492 square miles
Population: 1,749
Population density:
Median household income in 2021:
Median rent in in 2021:
Male vs Females
Median age
Average estimated value of detached houses in 2021 (46.9% of all units):
Most popular occupations of males: construction, extraction, and maintenance occupations (30.3%); sales and office occupations (21.6%); material moving occupations (12.1%); production occupations (8.6%); service occupations (8.4%); computer and mathematical occupations (3.9%); community and social services occupations (3.1%)
Most popular occupations of females: sales and office occupations (70.8%); service occupations (8.5%); business and financial operations occupations (6.3%); material moving occupations (5.4%); healthcare practitioners and technical occupations (4.5%); education, training, and library occupations (3.4%); legal occupations (2.2%)
Limited-access highways (interstate or state) in this neighborhood: I- 64.
Highways in this neighborhood: State Rte 165 (E Little Creek Rd); State Rte 168 (Tidewater Dr).
Roads and streets: Simons Dr; Gygax Rd; Draper Dr; San Antonio Blvd; Burksdale Rd; Fort Worth Ave; Mc Cloy Rd; Van Patten Rd; Edwin Dr; Macdonald Rd; Leonard Rd; Mercer Dr; Galveston Blvd; Marchant Rd; Mc Farland Rd; Diggs Rd; Dixie Dr; Ashlawn Dr; Munden Ave; Andrew Ln; Palmer Turn; Dallas St; Jay Ct; Bancker Rd; el Paso Ave; Spencer Ln; Kale Ln; Harriet Rd; Head St; Owens Rd.
Oakdale Farms neighborhood detailed profile
Area: 0.492 square miles
Population: 1,749
Population density:
| Oakdale Farms: | 3,552 people per square mile |
| Norfolk: | 4,376 people per square mile |
Median household income in 2021:
| Oakdale Farms: | $50,064 |
| Norfolk: | $58,591 |
Median rent in in 2021:
| Oakdale Farms: | $876 |
| Norfolk: | $938 |
Male vs Females
| Males: | 856 |
| Females: | 892 |
Median age
| Males: | 36.2 years |
| Females: | 27.6 years |
Average estimated value of detached houses in 2021 (46.9% of all units):
| Oakdale Farms: | $166,482 |
| Norfolk: | $306,640 |
Most popular occupations of males: construction, extraction, and maintenance occupations (30.3%); sales and office occupations (21.6%); material moving occupations (12.1%); production occupations (8.6%); service occupations (8.4%); computer and mathematical occupations (3.9%); community and social services occupations (3.1%)
Most popular occupations of females: sales and office occupations (70.8%); service occupations (8.5%); business and financial operations occupations (6.3%); material moving occupations (5.4%); healthcare practitioners and technical occupations (4.5%); education, training, and library occupations (3.4%); legal occupations (2.2%)
Limited-access highways (interstate or state) in this neighborhood: I- 64.
Highways in this neighborhood: State Rte 165 (E Little Creek Rd); State Rte 168 (Tidewater Dr).
Roads and streets: Simons Dr; Gygax Rd; Draper Dr; San Antonio Blvd; Burksdale Rd; Fort Worth Ave; Mc Cloy Rd; Van Patten Rd; Edwin Dr; Macdonald Rd; Leonard Rd; Mercer Dr; Galveston Blvd; Marchant Rd; Mc Farland Rd; Diggs Rd; Dixie Dr; Ashlawn Dr; Munden Ave; Andrew Ln; Palmer Turn; Dallas St; Jay Ct; Bancker Rd; el Paso Ave; Spencer Ln; Kale Ln; Harriet Rd; Head St; Owens Rd.
Oakdale Farms neighborhood detailed profile
Oakleaf Forest neighborhood in Norfolk statistics: (Find on map)
Area: 0.049 square miles
Population: 38
Population density:
Median household income in 2021:
Median rent in in 2021:
Male vs Females
Median age
Average estimated value of detached houses in 2021 (87.5% of all units):
Most popular occupations of males: material moving occupations (38.7%); service occupations (27.6%); education, training, and library occupations (20.9%); production occupations (19.4%); computer and mathematical occupations (16.4%); arts, design, entertainment, sports, and media occupations (10.6%); sales and office occupations (9.0%)
Most popular occupations of females: computer and mathematical occupations (68.7%); healthcare practitioners and technical occupations (52.9%); service occupations (27.2%); material moving occupations (26.2%); production occupations (20.2%); sales and office occupations (19.1%); community and social services occupations (13.9%)
Roads and streets: Green Leaf Dr; Sandalwood Ct; Rosewood Ct; Teakwood Ct; Firwood Ct; Ashwood Ct; Cottonwood Ct.
Oakleaf Forest neighborhood detailed profile
Area: 0.049 square miles
Population: 38
Population density:
| Oakleaf Forest: | 779 people per square mile |
| Norfolk: | 4,376 people per square mile |
Median household income in 2021:
| Oakleaf Forest: | $48,894 |
| Norfolk: | $58,591 |
Median rent in in 2021:
| Oakleaf Forest: | $960 |
| Norfolk: | $938 |
Male vs Females
| Males: | 13 |
| Females: | 25 |
Median age
| Males: | 21.6 years |
| Females: | 50.1 years |
Average estimated value of detached houses in 2021 (87.5% of all units):
| Oakleaf Forest: | $149,377 |
| Norfolk: | $306,640 |
Most popular occupations of males: material moving occupations (38.7%); service occupations (27.6%); education, training, and library occupations (20.9%); production occupations (19.4%); computer and mathematical occupations (16.4%); arts, design, entertainment, sports, and media occupations (10.6%); sales and office occupations (9.0%)
Most popular occupations of females: computer and mathematical occupations (68.7%); healthcare practitioners and technical occupations (52.9%); service occupations (27.2%); material moving occupations (26.2%); production occupations (20.2%); sales and office occupations (19.1%); community and social services occupations (13.9%)
Roads and streets: Green Leaf Dr; Sandalwood Ct; Rosewood Ct; Teakwood Ct; Firwood Ct; Ashwood Ct; Cottonwood Ct.
Oakleaf Forest neighborhood detailed profile
Oakmont neighborhood in Norfolk statistics: (Find on map)
Area: 0.098 square miles
Population: 362
Population density:
Median household income in 2021:
Median rent in in 2021:
Male vs Females
Median age
Most popular occupations of males: service occupations (42.6%); construction, extraction, and maintenance occupations (21.9%); material moving occupations (17.0%); transportation occupations (13.2%); business and financial operations occupations (5.0%); community and social services occupations (1.5%)
Most popular occupations of females: sales and office occupations (62.3%); service occupations (23.5%); computer and mathematical occupations (14.0%)
Roads and streets: Oakmont Dr; Johnstons Rd; Rosefield Dr; Oakmont Ct; Jernigan Ave; Oakmont Pl; Rosefield Ct.
Oakmont neighborhood detailed profile
Area: 0.098 square miles
Population: 362
Population density:
| Oakmont: | 3,681 people per square mile |
| Norfolk: | 4,376 people per square mile |
Median household income in 2021:
| Oakmont: | $52,596 |
| Norfolk: | $58,591 |
Median rent in in 2021:
| Oakmont: | $861 |
| Norfolk: | $938 |
Male vs Females
| Males: | 150 |
| Females: | 212 |
Median age
| Males: | 36.1 years |
| Females: | 42.6 years |
Most popular occupations of males: service occupations (42.6%); construction, extraction, and maintenance occupations (21.9%); material moving occupations (17.0%); transportation occupations (13.2%); business and financial operations occupations (5.0%); community and social services occupations (1.5%)
Most popular occupations of females: sales and office occupations (62.3%); service occupations (23.5%); computer and mathematical occupations (14.0%)
Roads and streets: Oakmont Dr; Johnstons Rd; Rosefield Dr; Oakmont Ct; Jernigan Ave; Oakmont Pl; Rosefield Ct.
Oakmont neighborhood detailed profile
Odu Village neighborhood in Norfolk statistics: (Find on map)
Area: 0.119 square miles
Population: 968
Population density:
Median household income in 2021:
Median rent in in 2021:
Male vs Females
Median age
Average estimated value of detached houses in 2021 (20.1% of all units):
Most popular occupations of males: service occupations (25.0%); sales and office occupations (24.4%); education, training, and library occupations (15.8%); computer and mathematical occupations (9.4%); material moving occupations (8.1%); production occupations (6.2%); life, physical, and social science occupations (3.1%)
Most popular occupations of females: service occupations (39.0%); sales and office occupations (26.7%); education, training, and library occupations (19.9%); management occupations (except farmers) (4.5%); computer and mathematical occupations (2.8%); production occupations (2.8%); healthcare practitioners and technical occupations (2.4%)
Roads and streets: Killam Ave; W 41st St; W 40th St; W 47th St; W 45th St; W 38th St; W 46th St; W 42nd St; W 43rd St; W 39th St; W 44th St.
Odu Village neighborhood detailed profile
Area: 0.119 square miles
Population: 968
Population density:
| Odu Village: | 8,135 people per square mile |
| Norfolk: | 4,376 people per square mile |
Median household income in 2021:
| Odu Village: | $23,058 |
| Norfolk: | $58,591 |
Median rent in in 2021:
| Odu Village: | $970 |
| Norfolk: | $938 |
Male vs Females
| Males: | 497 |
| Females: | 470 |
Median age
| Males: | 21.9 years |
| Females: | 21.9 years |
Average estimated value of detached houses in 2021 (20.1% of all units):
| Odu Village: | $110,484 |
| Norfolk: | $306,640 |
Most popular occupations of males: service occupations (25.0%); sales and office occupations (24.4%); education, training, and library occupations (15.8%); computer and mathematical occupations (9.4%); material moving occupations (8.1%); production occupations (6.2%); life, physical, and social science occupations (3.1%)
Most popular occupations of females: service occupations (39.0%); sales and office occupations (26.7%); education, training, and library occupations (19.9%); management occupations (except farmers) (4.5%); computer and mathematical occupations (2.8%); production occupations (2.8%); healthcare practitioners and technical occupations (2.4%)
Roads and streets: Killam Ave; W 41st St; W 40th St; W 47th St; W 45th St; W 38th St; W 46th St; W 42nd St; W 43rd St; W 39th St; W 44th St.
Odu Village neighborhood detailed profile
Olde Huntersville neighborhood in Norfolk statistics: (Find on map)
Area: 0.186 square miles
Population: 2,073
Population density:
Median household income in 2021:
Median rent in in 2021:
Male vs Females
Median age
Housing prices:
Average estimated value of detached houses in 2021 (16.7% of all units):
Average estimated value of townhouses or other attached units in 2021 (11.8% of all units):
Average estimated '21 value of housing units in 5-or-more-unit structures (19.6% of all units):
Most popular occupations of males: service occupations (79.4%); production occupations (18.3%); transportation occupations (6.7%)
Most popular occupations of females: service occupations (34.2%); sales and office occupations (27.2%); management occupations (except farmers) (18.5%); material moving occupations (8.0%); transportation occupations (4.0%); education, training, and library occupations (3.0%); business and financial operations occupations (1.9%)
Highways in this neighborhood: State Rte 168 (Tidewater Dr).
Roads and streets: O Keefe St; Washington Ave; Fremont St; Lexington St; Galt St; Johnson Ave; C Ave; Bolton St; Dungee St; A Ave; Taggart St; Sutton St; B Ave; Hunter St; Saint Julian Ave; Barney St; Proescher St; Calhoun St; Denhart St; Anderson St; Dunbar St; Chapel St; E Lexington St; Bracey St; Goochland St; Gordon Ave (Gordon St); Bower St; Billings St; Carswell St; Barre St; Amelia St; Chase St; Strickler St.
Railroad features: Norfolk Southern Rlwy.
Olde Huntersville neighborhood detailed profile
Area: 0.186 square miles
Population: 2,073
Population density:
| Olde Huntersville: | 11,171 people per square mile |
| Norfolk: | 4,376 people per square mile |
Median household income in 2021:
| Olde Huntersville: | $39,523 |
| Norfolk: | $58,591 |
Median rent in in 2021:
| Olde Huntersville: | $426 |
| Norfolk: | $938 |
Male vs Females
| Males: | 698 |
| Females: | 1,374 |
Median age
| Males: | 26.9 years |
| Females: | 32.6 years |
Housing prices:
Average estimated value of detached houses in 2021 (16.7% of all units):
| Olde Huntersville: | $240,980 |
| Norfolk: | $306,640 |
Average estimated value of townhouses or other attached units in 2021 (11.8% of all units):
| This neighborhood: | $403,356 |
| city: | $267,013 |
Average estimated '21 value of housing units in 5-or-more-unit structures (19.6% of all units):
| Olde Huntersville: | $183,038 |
| Norfolk: | $260,910 |
Most popular occupations of males: service occupations (79.4%); production occupations (18.3%); transportation occupations (6.7%)
Most popular occupations of females: service occupations (34.2%); sales and office occupations (27.2%); management occupations (except farmers) (18.5%); material moving occupations (8.0%); transportation occupations (4.0%); education, training, and library occupations (3.0%); business and financial operations occupations (1.9%)
Highways in this neighborhood: State Rte 168 (Tidewater Dr).
Roads and streets: O Keefe St; Washington Ave; Fremont St; Lexington St; Galt St; Johnson Ave; C Ave; Bolton St; Dungee St; A Ave; Taggart St; Sutton St; B Ave; Hunter St; Saint Julian Ave; Barney St; Proescher St; Calhoun St; Denhart St; Anderson St; Dunbar St; Chapel St; E Lexington St; Bracey St; Goochland St; Gordon Ave (Gordon St); Bower St; Billings St; Carswell St; Barre St; Amelia St; Chase St; Strickler St.
Railroad features: Norfolk Southern Rlwy.
Olde Huntersville neighborhood detailed profile
Park Crescent neighborhood in Norfolk statistics: (Find on map)
Area: 0.047 square miles
Population: 233
Population density:
Median household income in 2021:
Median rent in in 2021:
Male vs Females
Median age
Most popular occupations of males: service occupations (31.4%); construction, extraction, and maintenance occupations (30.4%); sales and office occupations (17.7%); business and financial operations occupations (17.0%); management occupations (except farmers) (8.1%); education, training, and library occupations (8.0%); production occupations (6.6%)
Most popular occupations of females: service occupations (49.6%); sales and office occupations (21.5%); production occupations (11.0%); material moving occupations (10.5%); transportation occupations (9.9%); business and financial operations occupations (7.0%); legal occupations (7.0%)
Highways in this neighborhood: State Rte 165 (N Military Hwy).
Roads and streets: Crescent Way.
Park Crescent neighborhood detailed profile
Area: 0.047 square miles
Population: 233
Population density:
| Park Crescent: | 4,920 people per square mile |
| Norfolk: | 4,376 people per square mile |
Median household income in 2021:
| Park Crescent: | $36,242 |
| Norfolk: | $58,591 |
Median rent in in 2021:
| Park Crescent: | $1,003 |
| Norfolk: | $938 |
Male vs Females
| Males: | 96 |
| Females: | 136 |
Median age
| Males: | 24.5 years |
| Females: | 31.2 years |
Most popular occupations of males: service occupations (31.4%); construction, extraction, and maintenance occupations (30.4%); sales and office occupations (17.7%); business and financial operations occupations (17.0%); management occupations (except farmers) (8.1%); education, training, and library occupations (8.0%); production occupations (6.6%)
Most popular occupations of females: service occupations (49.6%); sales and office occupations (21.5%); production occupations (11.0%); material moving occupations (10.5%); transportation occupations (9.9%); business and financial operations occupations (7.0%); legal occupations (7.0%)
Highways in this neighborhood: State Rte 165 (N Military Hwy).
Roads and streets: Crescent Way.
Park Crescent neighborhood detailed profile
Park Place neighborhood in Norfolk statistics: (Find on map)
Area: 0.518 square miles
Population: 4,498
Population density:
Median household income in 2021:
Median rent in in 2021:
Male vs Females
Median age
Housing prices:
Average estimated value of detached houses in 2021 (43.9% of all units):
Average estimated value of townhouses or other attached units in 2021 (13.8% of all units):
Average estimated '21 value of housing units in 5-or-more-unit structures (5.9% of all units):
Most popular occupations of males: service occupations (20.2%); sales and office occupations (19.5%); construction, extraction, and maintenance occupations (11.0%); material moving occupations (10.6%); computer and mathematical occupations (8.9%); production occupations (7.6%); education, training, and library occupations (6.9%)
Most popular occupations of females: service occupations (44.8%); sales and office occupations (22.4%); education, training, and library occupations (7.4%); healthcare practitioners and technical occupations (7.4%); community and social services occupations (4.4%); management occupations (except farmers) (4.0%); business and financial operations occupations (3.7%)
Highways in this neighborhood: State Rte 247 (W 26th St).
Roads and streets: W 31st St; W 34th St; W 35th St; W 36th St; Granby St; de Bree Ave; Omohundro Ave; Llewellyn Ave; W 38th St; W 29th St; Colonial Ave; W 24th St; W 23rd St; W 27th St; W 25th St; Newport Ave; W 28th St; Gosnold Ave; W 37th St; W 33rd St; Lamberts Point Rd; 37th St; W 30th St; W 32nd St; Broadway St; Colley Ave; Munson Pl.
Railroad features: Norfolk Southern Rlwy.
Park Place neighborhood detailed profile
Area: 0.518 square miles
Population: 4,498
Population density:
| Park Place: | 8,689 people per square mile |
| Norfolk: | 4,376 people per square mile |
Median household income in 2021:
| Park Place: | $51,990 |
| Norfolk: | $58,591 |
Median rent in in 2021:
| Park Place: | $866 |
| Norfolk: | $938 |
Male vs Females
| Males: | 2,538 |
| Females: | 1,959 |
Median age
| Males: | 35.4 years |
| Females: | 39.4 years |
Housing prices:
Average estimated value of detached houses in 2021 (43.9% of all units):
| Park Place: | $210,183 |
| Norfolk: | $306,640 |
Average estimated value of townhouses or other attached units in 2021 (13.8% of all units):
| This neighborhood: | $403,356 |
| city: | $267,013 |
Average estimated '21 value of housing units in 5-or-more-unit structures (5.9% of all units):
| Park Place: | $183,038 |
| Norfolk: | $260,910 |
Most popular occupations of males: service occupations (20.2%); sales and office occupations (19.5%); construction, extraction, and maintenance occupations (11.0%); material moving occupations (10.6%); computer and mathematical occupations (8.9%); production occupations (7.6%); education, training, and library occupations (6.9%)
Most popular occupations of females: service occupations (44.8%); sales and office occupations (22.4%); education, training, and library occupations (7.4%); healthcare practitioners and technical occupations (7.4%); community and social services occupations (4.4%); management occupations (except farmers) (4.0%); business and financial operations occupations (3.7%)
Highways in this neighborhood: State Rte 247 (W 26th St).
Roads and streets: W 31st St; W 34th St; W 35th St; W 36th St; Granby St; de Bree Ave; Omohundro Ave; Llewellyn Ave; W 38th St; W 29th St; Colonial Ave; W 24th St; W 23rd St; W 27th St; W 25th St; Newport Ave; W 28th St; Gosnold Ave; W 37th St; W 33rd St; Lamberts Point Rd; 37th St; W 30th St; W 32nd St; Broadway St; Colley Ave; Munson Pl.
Railroad features: Norfolk Southern Rlwy.
Park Place neighborhood detailed profile
Partra neighborhood in Norfolk statistics: (Find on map)
Area: 0.038 square miles
Population: 135
Population density:
Median household income in 2021:
Median rent in in 2021:
Male vs Females
Median age
Average estimated value of detached houses in 2021 (61.8% of all units):
Most popular occupations of males: construction, extraction, and maintenance occupations (46.3%); service occupations (17.4%); material moving occupations (11.4%); business and financial operations occupations (9.7%); sales and office occupations (8.7%); production occupations (8.6%); architecture and engineering occupations (4.2%)
Most popular occupations of females: education, training, and library occupations (37.2%); healthcare practitioners and technical occupations (17.6%); legal occupations (14.8%); community and social services occupations (11.7%); service occupations (10.7%); production occupations (7.1%)
Roads and streets: Easy St; Fenner St; Tyndale Ct; Guy Ave.
Partra neighborhood detailed profile
Area: 0.038 square miles
Population: 135
Population density:
| Partra: | 3,527 people per square mile |
| Norfolk: | 4,376 people per square mile |
Median household income in 2021:
| Partra: | $48,400 |
| Norfolk: | $58,591 |
Median rent in in 2021:
| Partra: | $877 |
| Norfolk: | $938 |
Male vs Females
| Males: | 77 |
| Females: | 58 |
Median age
| Males: | 29.8 years |
| Females: | 45.4 years |
Average estimated value of detached houses in 2021 (61.8% of all units):
| Partra: | $181,879 |
| Norfolk: | $306,640 |
Most popular occupations of males: construction, extraction, and maintenance occupations (46.3%); service occupations (17.4%); material moving occupations (11.4%); business and financial operations occupations (9.7%); sales and office occupations (8.7%); production occupations (8.6%); architecture and engineering occupations (4.2%)
Most popular occupations of females: education, training, and library occupations (37.2%); healthcare practitioners and technical occupations (17.6%); legal occupations (14.8%); community and social services occupations (11.7%); service occupations (10.7%); production occupations (7.1%)
Roads and streets: Easy St; Fenner St; Tyndale Ct; Guy Ave.
Partra neighborhood detailed profile
Pinewell neighborhood in Norfolk statistics: (Find on map)
Area: 0.162 square miles
Population: 392
Population density:
Median household income in 2021:
Median rent in in 2021:
Male vs Females
Median age
Housing prices:
Average estimated value of detached houses in 2021 (45.7% of all units):
Average estimated value of housing units in 2-unit structures in 2021 (43.0% of all units):
Average estimated '21 value of housing units in 5-or-more-unit structures (26.9% of all units):
Most popular occupations of males: sales and office occupations (16.4%); management occupations (except farmers) (12.7%); business and financial operations occupations (12.6%); production occupations (11.3%); construction, extraction, and maintenance occupations (11.1%); architecture and engineering occupations (10.7%); arts, design, entertainment, sports, and media occupations (5.8%)
Most popular occupations of females: sales and office occupations (33.3%); service occupations (19.4%); legal occupations (19.0%); management occupations (except farmers) (11.1%); business and financial operations occupations (6.0%); arts, design, entertainment, sports, and media occupations (4.2%); healthcare practitioners and technical occupations (3.0%)
Highways in this neighborhood: US Hwy 60 (E Ocean View Ave); US Hwy 460 (Granby St).
Roads and streets: Wells Pkwy; E Seaview Ave; Hammett Pkwy; Selby Pl; Sherwood Pl; E Government Ave; Battersea Rd; Norfolk Ave; Bay Dunes Dr; Pinewell Dr; Seabreeze Rd; Ship Watch Rd.
Pinewell neighborhood detailed profile
Area: 0.162 square miles
Population: 392
Population density:
| Pinewell: | 2,423 people per square mile |
| Norfolk: | 4,376 people per square mile |
Median household income in 2021:
| Pinewell: | $67,867 |
| Norfolk: | $58,591 |
Median rent in in 2021:
| Pinewell: | $796 |
| Norfolk: | $938 |
Male vs Females
| Males: | 217 |
| Females: | 175 |
Median age
| Males: | 36.5 years |
| Females: | 40.6 years |
Housing prices:
Average estimated value of detached houses in 2021 (45.7% of all units):
| Pinewell: | $354,500 |
| Norfolk: | $306,640 |
Average estimated value of housing units in 2-unit structures in 2021 (43.0% of all units):
| This neighborhood: | $164,857 |
| Norfolk: | $250,782 |
Average estimated '21 value of housing units in 5-or-more-unit structures (26.9% of all units):
| Pinewell: | $209,862 |
| Norfolk: | $260,910 |
Most popular occupations of males: sales and office occupations (16.4%); management occupations (except farmers) (12.7%); business and financial operations occupations (12.6%); production occupations (11.3%); construction, extraction, and maintenance occupations (11.1%); architecture and engineering occupations (10.7%); arts, design, entertainment, sports, and media occupations (5.8%)
Most popular occupations of females: sales and office occupations (33.3%); service occupations (19.4%); legal occupations (19.0%); management occupations (except farmers) (11.1%); business and financial operations occupations (6.0%); arts, design, entertainment, sports, and media occupations (4.2%); healthcare practitioners and technical occupations (3.0%)
Highways in this neighborhood: US Hwy 60 (E Ocean View Ave); US Hwy 460 (Granby St).
Roads and streets: Wells Pkwy; E Seaview Ave; Hammett Pkwy; Selby Pl; Sherwood Pl; E Government Ave; Battersea Rd; Norfolk Ave; Bay Dunes Dr; Pinewell Dr; Seabreeze Rd; Ship Watch Rd.
Pinewell neighborhood detailed profile
Pleasant Point neighborhood in Norfolk statistics: (Find on map)
Area: 0.104 square miles
Population: 188
Population density:
Median household income in 2021:
Median rent in in 2021:
Male vs Females
Median age
Average estimated value of detached houses in 2021 (67.0% of all units):
Most popular occupations of males: legal occupations (20.4%); business and financial operations occupations (18.3%); service occupations (18.3%); management occupations (except farmers) (12.7%); sales and office occupations (9.4%); construction, extraction, and maintenance occupations (7.0%); computer and mathematical occupations (3.1%)
Most popular occupations of females: service occupations (37.4%); sales and office occupations (26.6%); healthcare practitioners and technical occupations (9.2%); business and financial operations occupations (8.6%); management occupations (except farmers) (7.5%); production occupations (3.7%); arts, design, entertainment, sports, and media occupations (3.0%)
Roads and streets: Peace Haven Dr; Pleasant Point Dr; Dorwin Dr; Brock Cir; Pleasant Point Cir; Dorwin Cir.
Pleasant Point neighborhood detailed profile
Area: 0.104 square miles
Population: 188
Population density:
| Pleasant Point: | 1,809 people per square mile |
| Norfolk: | 4,376 people per square mile |
Median household income in 2021:
| Pleasant Point: | $64,254 |
| Norfolk: | $58,591 |
Median rent in in 2021:
| Pleasant Point: | $1,111 |
| Norfolk: | $938 |
Male vs Females
| Males: | 96 |
| Females: | 91 |
Median age
| Males: | 43.8 years |
| Females: | 48.2 years |
Average estimated value of detached houses in 2021 (67.0% of all units):
| Pleasant Point: | $225,200 |
| Norfolk: | $306,640 |
Most popular occupations of males: legal occupations (20.4%); business and financial operations occupations (18.3%); service occupations (18.3%); management occupations (except farmers) (12.7%); sales and office occupations (9.4%); construction, extraction, and maintenance occupations (7.0%); computer and mathematical occupations (3.1%)
Most popular occupations of females: service occupations (37.4%); sales and office occupations (26.6%); healthcare practitioners and technical occupations (9.2%); business and financial operations occupations (8.6%); management occupations (except farmers) (7.5%); production occupations (3.7%); arts, design, entertainment, sports, and media occupations (3.0%)
Roads and streets: Peace Haven Dr; Pleasant Point Dr; Dorwin Dr; Brock Cir; Pleasant Point Cir; Dorwin Cir.
Pleasant Point neighborhood detailed profile
Poplar Halls neighborhood in Norfolk statistics: (Find on map)
Area: 0.771 square miles
Population: 2,424
Population density:
Median household income in 2021:
Median rent in in 2021:
Male vs Females
Median age
Average estimated value of detached houses in 2021 (71.2% of all units):
Most popular occupations of males: service occupations (21.4%); material moving occupations (14.2%); production occupations (9.0%); arts, design, entertainment, sports, and media occupations (7.3%); healthcare practitioners and technical occupations (7.2%); computer and mathematical occupations (6.1%); construction, extraction, and maintenance occupations (5.9%)
Most popular occupations of females: service occupations (27.4%); sales and office occupations (19.4%); education, training, and library occupations (13.7%); healthcare practitioners and technical occupations (12.8%); material moving occupations (8.8%); business and financial operations occupations (8.7%); management occupations (except farmers) (2.8%)
Highways in this neighborhood: N Military Hwy (US Hwy 13).
Roads and streets: Poplar Hall Dr; Bayberry Dr; Briar Hill Rd; Brickell Rd; Berry Hill Rd; Barnhollow Rd; Beacon Hill Cir; Sandpiper Ln; Pepper Mill Ln; Pecan Point Rd; Brookville Rd; Round Bay Rd; Stuart Cir; River Edge Rd; Deepdale Dr; Red Mill Rd; Pebble Ln; Springhill Rd; Stanart St; Pine Hollow Rd; Piping Rock Rd; Bar Harbor Dr; Duck Pond Rd; Halter Ln; Lee Point Rd; Saddle Rock Rd; Bayberry Ln; Jett St; Poplar Hall Cir; Peppermill Ct; Westcove Ct; Boulder Ln; Archcove Ct; Sandpiper Cir; Beacon Hill Ct; Lake Ridge Cir; Round Bay Ct; Doswell St; Stuart Ct; Round Bay Cir; Barnhollow Cir.
Poplar Halls neighborhood detailed profile
Area: 0.771 square miles
Population: 2,424
Population density:
| Poplar Halls: | 3,144 people per square mile |
| Norfolk: | 4,376 people per square mile |
Median household income in 2021:
| Poplar Halls: | $81,499 |
| Norfolk: | $58,591 |
Median rent in in 2021:
| Poplar Halls: | $1,023 |
| Norfolk: | $938 |
Male vs Females
| Males: | 1,424 |
| Females: | 999 |
Median age
| Males: | 38.4 years |
| Females: | 46.0 years |
Average estimated value of detached houses in 2021 (71.2% of all units):
| Poplar Halls: | $293,716 |
| Norfolk: | $306,640 |
Most popular occupations of males: service occupations (21.4%); material moving occupations (14.2%); production occupations (9.0%); arts, design, entertainment, sports, and media occupations (7.3%); healthcare practitioners and technical occupations (7.2%); computer and mathematical occupations (6.1%); construction, extraction, and maintenance occupations (5.9%)
Most popular occupations of females: service occupations (27.4%); sales and office occupations (19.4%); education, training, and library occupations (13.7%); healthcare practitioners and technical occupations (12.8%); material moving occupations (8.8%); business and financial operations occupations (8.7%); management occupations (except farmers) (2.8%)
Highways in this neighborhood: N Military Hwy (US Hwy 13).
Roads and streets: Poplar Hall Dr; Bayberry Dr; Briar Hill Rd; Brickell Rd; Berry Hill Rd; Barnhollow Rd; Beacon Hill Cir; Sandpiper Ln; Pepper Mill Ln; Pecan Point Rd; Brookville Rd; Round Bay Rd; Stuart Cir; River Edge Rd; Deepdale Dr; Red Mill Rd; Pebble Ln; Springhill Rd; Stanart St; Pine Hollow Rd; Piping Rock Rd; Bar Harbor Dr; Duck Pond Rd; Halter Ln; Lee Point Rd; Saddle Rock Rd; Bayberry Ln; Jett St; Poplar Hall Cir; Peppermill Ct; Westcove Ct; Boulder Ln; Archcove Ct; Sandpiper Cir; Beacon Hill Ct; Lake Ridge Cir; Round Bay Ct; Doswell St; Stuart Ct; Round Bay Cir; Barnhollow Cir.
Poplar Halls neighborhood detailed profile
River Oaks neighborhood in Norfolk statistics: (Find on map)
Area: 0.165 square miles
Population: 786
Population density:
Median household income in 2021:
Median rent in in 2021:
Male vs Females
Median age
Average estimated value of detached houses in 2021 (68.0% of all units):
Most popular occupations of males: service occupations (22.5%); sales and office occupations (12.5%); architecture and engineering occupations (9.5%); material moving occupations (8.7%); computer and mathematical occupations (7.3%); business and financial operations occupations (3.9%); management occupations (except farmers) (3.5%)
Most popular occupations of females: sales and office occupations (29.6%); service occupations (25.1%); transportation occupations (10.7%); production occupations (8.7%); business and financial operations occupations (6.6%); life, physical, and social science occupations (4.5%); management occupations (except farmers) (4.2%)
Roads and streets: Gabriel Dr; River Oaks Dr; Silvey Dr; Julianna Dr; Roslyn Dr; Hanyen Dr; Hummel Dr; Gabriel Ct.
River Oaks neighborhood detailed profile
Area: 0.165 square miles
Population: 786
Population density:
| River Oaks: | 4,751 people per square mile |
| Norfolk: | 4,376 people per square mile |
Median household income in 2021:
| River Oaks: | $53,126 |
| Norfolk: | $58,591 |
Median rent in in 2021:
| River Oaks: | $840 |
| Norfolk: | $938 |
Male vs Females
| Males: | 377 |
| Females: | 408 |
Median age
| Males: | 35.9 years |
| Females: | 36.1 years |
Average estimated value of detached houses in 2021 (68.0% of all units):
| River Oaks: | $191,954 |
| Norfolk: | $306,640 |
Most popular occupations of males: service occupations (22.5%); sales and office occupations (12.5%); architecture and engineering occupations (9.5%); material moving occupations (8.7%); computer and mathematical occupations (7.3%); business and financial operations occupations (3.9%); management occupations (except farmers) (3.5%)
Most popular occupations of females: sales and office occupations (29.6%); service occupations (25.1%); transportation occupations (10.7%); production occupations (8.7%); business and financial operations occupations (6.6%); life, physical, and social science occupations (4.5%); management occupations (except farmers) (4.2%)
Roads and streets: Gabriel Dr; River Oaks Dr; Silvey Dr; Julianna Dr; Roslyn Dr; Hanyen Dr; Hummel Dr; Gabriel Ct.
River Oaks neighborhood detailed profile
Riverfront neighborhood in Norfolk statistics: (Find on map)
Area: 0.088 square miles
Population: 353
Population density:
Median household income in 2021:
Median rent in in 2021:
Male vs Females
Median age
Most popular occupations of males: sales and office occupations (25.8%); construction, extraction, and maintenance occupations (18.1%); service occupations (9.6%); production occupations (9.2%); material moving occupations (8.6%); transportation occupations (5.1%); computer and mathematical occupations (4.7%)
Most popular occupations of females: sales and office occupations (38.4%); education, training, and library occupations (21.9%); business and financial operations occupations (12.7%); service occupations (10.2%); production occupations (3.5%); management occupations (except farmers) (3.4%); healthcare practitioners and technical occupations (3.4%)
Roads and streets: Major Ave; Glenroie Ave; Dehlman Ave; N Shore Rd; Laurel Cres; Pelham St; Bayonne St.
Riverfront neighborhood detailed profile
Area: 0.088 square miles
Population: 353
Population density:
| Riverfront: | 3,993 people per square mile |
| Norfolk: | 4,376 people per square mile |
Median household income in 2021:
| Riverfront: | $65,529 |
| Norfolk: | $58,591 |
Median rent in in 2021:
| Riverfront: | $973 |
| Norfolk: | $938 |
Male vs Females
| Males: | 197 |
| Females: | 156 |
Median age
| Males: | 34.5 years |
| Females: | 36.3 years |
Most popular occupations of males: sales and office occupations (25.8%); construction, extraction, and maintenance occupations (18.1%); service occupations (9.6%); production occupations (9.2%); material moving occupations (8.6%); transportation occupations (5.1%); computer and mathematical occupations (4.7%)
Most popular occupations of females: sales and office occupations (38.4%); education, training, and library occupations (21.9%); business and financial operations occupations (12.7%); service occupations (10.2%); production occupations (3.5%); management occupations (except farmers) (3.4%); healthcare practitioners and technical occupations (3.4%)
Roads and streets: Major Ave; Glenroie Ave; Dehlman Ave; N Shore Rd; Laurel Cres; Pelham St; Bayonne St.
Riverfront neighborhood detailed profile
Riverpoint neighborhood in Norfolk statistics: (Find on map)
Area: 0.226 square miles
Population: 392
Population density:
Median household income in 2021:
Median rent in in 2021:
Male vs Females
Median age
Most popular occupations of males: legal occupations (18.8%); management occupations (except farmers) (15.9%); healthcare practitioners and technical occupations (13.1%); sales and office occupations (11.9%); architecture and engineering occupations (8.4%); service occupations (6.9%); business and financial operations occupations (6.3%)
Most popular occupations of females: education, training, and library occupations (28.6%); sales and office occupations (19.8%); management occupations (except farmers) (9.5%); service occupations (8.8%); legal occupations (8.0%); healthcare practitioners and technical occupations (7.6%); architecture and engineering occupations (5.6%)
Highways in this neighborhood: .
Roads and streets: River Rd; Newport Ave; Newport Cres; S River Rd; Ridgeley Rd; S Ridgeley Rd; River Cres; W River Rd; Ridgeley Pt; Newport Pt; River Road Pt.
Riverpoint neighborhood detailed profile
Area: 0.226 square miles
Population: 392
Population density:
| Riverpoint: | 1,732 people per square mile |
| Norfolk: | 4,376 people per square mile |
Median household income in 2021:
| Riverpoint: | $107,014 |
| Norfolk: | $58,591 |
Median rent in in 2021:
| Riverpoint: | $1,402 |
| Norfolk: | $938 |
Male vs Females
| Males: | 205 |
| Females: | 186 |
Median age
| Males: | 38.1 years |
| Females: | 44.4 years |
Most popular occupations of males: legal occupations (18.8%); management occupations (except farmers) (15.9%); healthcare practitioners and technical occupations (13.1%); sales and office occupations (11.9%); architecture and engineering occupations (8.4%); service occupations (6.9%); business and financial operations occupations (6.3%)
Most popular occupations of females: education, training, and library occupations (28.6%); sales and office occupations (19.8%); management occupations (except farmers) (9.5%); service occupations (8.8%); legal occupations (8.0%); healthcare practitioners and technical occupations (7.6%); architecture and engineering occupations (5.6%)
Highways in this neighborhood: .
Roads and streets: River Rd; Newport Ave; Newport Cres; S River Rd; Ridgeley Rd; S Ridgeley Rd; River Cres; W River Rd; Ridgeley Pt; Newport Pt; River Road Pt.
Riverpoint neighborhood detailed profile
Roberts Village neighborhood in Norfolk statistics: (Find on map)
Area: 0.077 square miles
Population: 107
Population density:
Median household income in 2021:
Median rent in in 2021:
Male vs Females
Median age
Housing prices:
Average estimated value of detached houses in 2021 (25.0% of all units):
Average estimated value of townhouses or other attached units in 2021 (40.0% of all units):
Average estimated '21 value of housing units in 5-or-more-unit structures (25.0% of all units):
Most popular occupations of males: service occupations (19.6%); sales and office occupations (16.8%); production occupations (15.9%); management occupations (except farmers) (13.9%); community and social services occupations (9.8%); transportation occupations (8.5%); computer and mathematical occupations (7.0%)
Most popular occupations of females: management occupations (except farmers) (34.1%); education, training, and library occupations (27.9%); healthcare practitioners and technical occupations (19.0%); service occupations (9.9%); community and social services occupations (4.9%); sales and office occupations (3.7%)
Highways in this neighborhood: E Princess Anne Rd (State Rte 166).
Roads and streets: Liberia Dr; Cary Ave; Monrovia Dr; Grand Bassa Dr; Jamaica Ave; Buck Rd; Montserrado Pl; Shanks St; Sinoe Pl.
Roberts Village neighborhood detailed profile
Area: 0.077 square miles
Population: 107
Population density:
| Roberts Village: | 1,398 people per square mile |
| Norfolk: | 4,376 people per square mile |
Median household income in 2021:
| Roberts Village: | $11,339 |
| Norfolk: | $58,591 |
Median rent in in 2021:
| Roberts Village: | $110 |
| Norfolk: | $938 |
Male vs Females
| Males: | 36 |
| Females: | 70 |
Median age
| Males: | 8.5 years |
| Females: | 8.6 years |
Housing prices:
Average estimated value of detached houses in 2021 (25.0% of all units):
| Roberts Village: | $268,062 |
| Norfolk: | $306,640 |
Average estimated value of townhouses or other attached units in 2021 (40.0% of all units):
| This neighborhood: | $207,067 |
| city: | $267,013 |
Average estimated '21 value of housing units in 5-or-more-unit structures (25.0% of all units):
| Roberts Village: | $184,688 |
| Norfolk: | $260,910 |
Most popular occupations of males: service occupations (19.6%); sales and office occupations (16.8%); production occupations (15.9%); management occupations (except farmers) (13.9%); community and social services occupations (9.8%); transportation occupations (8.5%); computer and mathematical occupations (7.0%)
Most popular occupations of females: management occupations (except farmers) (34.1%); education, training, and library occupations (27.9%); healthcare practitioners and technical occupations (19.0%); service occupations (9.9%); community and social services occupations (4.9%); sales and office occupations (3.7%)
Highways in this neighborhood: E Princess Anne Rd (State Rte 166).
Roads and streets: Liberia Dr; Cary Ave; Monrovia Dr; Grand Bassa Dr; Jamaica Ave; Buck Rd; Montserrado Pl; Shanks St; Sinoe Pl.
Roberts Village neighborhood detailed profile
Roland Park neighborhood in Norfolk statistics: (Find on map)
Area: 0.314 square miles
Population: 2,677
Population density:
Median household income in 2021:
Median rent in in 2021:
Male vs Females
Median age
Average estimated value of detached houses in 2021 (76.5% of all units):
Most popular occupations of males: service occupations (15.9%); business and financial operations occupations (13.3%); education, training, and library occupations (13.1%); management occupations (except farmers) (11.3%); sales and office occupations (10.9%); architecture and engineering occupations (10.0%); transportation occupations (7.0%)
Most popular occupations of females: sales and office occupations (38.5%); healthcare practitioners and technical occupations (13.4%); service occupations (8.9%); education, training, and library occupations (7.5%); management occupations (except farmers) (6.7%); computer and mathematical occupations (5.8%); production occupations (4.3%)
Highways in this neighborhood: State Rte 168 (Tidewater Dr).
Roads and streets: Summers Dr; Roland Dr; Kenosha Ave; Garren Ave; Waukesha Ave; Muskogee Ave; Tappahannock Dr; Natrona Ave; Sangamon Ave; Warner Cir; Otis Cir; Saranac Ave; Fenton Cir; Eason Cir; Oneida Cir; Eva Cir; Garland Cir; Niagara Cir.
Roland Park neighborhood detailed profile
Area: 0.314 square miles
Population: 2,677
Population density:
| Roland Park: | 8,524 people per square mile |
| Norfolk: | 4,376 people per square mile |
Median household income in 2021:
| Roland Park: | $86,723 |
| Norfolk: | $58,591 |
Median rent in in 2021:
| Roland Park: | $1,320 |
| Norfolk: | $938 |
Male vs Females
| Males: | 1,430 |
| Females: | 1,246 |
Median age
| Males: | 42.5 years |
| Females: | 49.1 years |
Average estimated value of detached houses in 2021 (76.5% of all units):
| Roland Park: | $186,655 |
| Norfolk: | $306,640 |
Most popular occupations of males: service occupations (15.9%); business and financial operations occupations (13.3%); education, training, and library occupations (13.1%); management occupations (except farmers) (11.3%); sales and office occupations (10.9%); architecture and engineering occupations (10.0%); transportation occupations (7.0%)
Most popular occupations of females: sales and office occupations (38.5%); healthcare practitioners and technical occupations (13.4%); service occupations (8.9%); education, training, and library occupations (7.5%); management occupations (except farmers) (6.7%); computer and mathematical occupations (5.8%); production occupations (4.3%)
Highways in this neighborhood: State Rte 168 (Tidewater Dr).
Roads and streets: Summers Dr; Roland Dr; Kenosha Ave; Garren Ave; Waukesha Ave; Muskogee Ave; Tappahannock Dr; Natrona Ave; Sangamon Ave; Warner Cir; Otis Cir; Saranac Ave; Fenton Cir; Eason Cir; Oneida Cir; Eva Cir; Garland Cir; Niagara Cir.
Roland Park neighborhood detailed profile
Roosevelt Gardens Area neighborhood in Norfolk statistics: (Find on map)
Area: 0.904 square miles
Population: 3,387
Population density:
Median household income in 2021:
Median rent in in 2021:
Male vs Females
Median age
Housing prices:
Average estimated value of detached houses in 2021 (91.9% of all units):
Average estimated value of mobile home in 2021 (16.5% of all units):
Most popular occupations of males: sales and office occupations (16.8%); construction, extraction, and maintenance occupations (16.8%); service occupations (9.9%); business and financial operations occupations (8.4%); material moving occupations (6.8%); production occupations (6.7%); transportation occupations (5.4%)
Most popular occupations of females: sales and office occupations (35.8%); service occupations (18.1%); healthcare practitioners and technical occupations (9.8%); arts, design, entertainment, sports, and media occupations (7.0%); management occupations (except farmers) (6.8%); business and financial operations occupations (6.5%); education, training, and library occupations (6.3%)
Highways in this neighborhood: State Rte 170 (E Little Creek Rd).
Roads and streets: Halprin Dr; Mona Ave; Dominion Ave; Nathan Ave; Millard St; Jeffrey Dr; Jolima Ave; Driftwood Dr; Tarrallton Dr; Helsley Ave; Norristown Dr; Kanter Ave; Baywood Dr; Brookwood Rd; Barbara Dr; Meadow Creek Rd; Corbett Ave; Wedgewood Dr; Danbury Dr; Arrowwood St; Larrymore Ave; Branchwood St; Wharton Ave; Dean Dr; Friden St; Beatty St; Springwood St; Lillian Ave; Debbie Cir; Calvin Ave; Dellwood Dr; Elaine Ave; Mervis St; Hardwood Ln; Benjamin Ave; Cougar Ave; Bowwood Ln; Saban Ave; Reuben Ave; Lightwood Ln; Arrowwood Ct; Glendon Ave; Media Ave; Elaine Ct; Fala Cir; Mervis Ct; Ester Ct; Baywood Ct; Friden Ct; Halprin Ct; Cornell Ave; Calvin Ct; Branchwood Ct; Dellwood Ct; Danbury Ct; Springwood Ct; Monty Ct; Hardwood Ct; Larrymore Ct; Driftwood Ct; Anglewood Ct (Branchwood Ct); Brookwood Ct; Wharton Ct; Nathan Ct; Elsie Cir.
Roosevelt Gardens Area neighborhood detailed profile
Area: 0.904 square miles
Population: 3,387
Population density:
| Roosevelt Gardens Area: | 3,746 people per square mile |
| Norfolk: | 4,376 people per square mile |
Median household income in 2021:
| Roosevelt Gardens Area: | $67,784 |
| Norfolk: | $58,591 |
Median rent in in 2021:
| Roosevelt Gardens Area: | $1,071 |
| Norfolk: | $938 |
Male vs Females
| Males: | 1,734 |
| Females: | 1,652 |
Median age
| Males: | 39.0 years |
| Females: | 44.8 years |
Housing prices:
Average estimated value of detached houses in 2021 (91.9% of all units):
| Roosevelt Gardens Area: | $241,094 |
| Norfolk: | $306,640 |
Average estimated value of mobile home in 2021 (16.5% of all units):
| Roosevelt Gardens Area: | $12,746 |
| Norfolk: | $23,245 |
Most popular occupations of males: sales and office occupations (16.8%); construction, extraction, and maintenance occupations (16.8%); service occupations (9.9%); business and financial operations occupations (8.4%); material moving occupations (6.8%); production occupations (6.7%); transportation occupations (5.4%)
Most popular occupations of females: sales and office occupations (35.8%); service occupations (18.1%); healthcare practitioners and technical occupations (9.8%); arts, design, entertainment, sports, and media occupations (7.0%); management occupations (except farmers) (6.8%); business and financial operations occupations (6.5%); education, training, and library occupations (6.3%)
Highways in this neighborhood: State Rte 170 (E Little Creek Rd).
Roads and streets: Halprin Dr; Mona Ave; Dominion Ave; Nathan Ave; Millard St; Jeffrey Dr; Jolima Ave; Driftwood Dr; Tarrallton Dr; Helsley Ave; Norristown Dr; Kanter Ave; Baywood Dr; Brookwood Rd; Barbara Dr; Meadow Creek Rd; Corbett Ave; Wedgewood Dr; Danbury Dr; Arrowwood St; Larrymore Ave; Branchwood St; Wharton Ave; Dean Dr; Friden St; Beatty St; Springwood St; Lillian Ave; Debbie Cir; Calvin Ave; Dellwood Dr; Elaine Ave; Mervis St; Hardwood Ln; Benjamin Ave; Cougar Ave; Bowwood Ln; Saban Ave; Reuben Ave; Lightwood Ln; Arrowwood Ct; Glendon Ave; Media Ave; Elaine Ct; Fala Cir; Mervis Ct; Ester Ct; Baywood Ct; Friden Ct; Halprin Ct; Cornell Ave; Calvin Ct; Branchwood Ct; Dellwood Ct; Danbury Ct; Springwood Ct; Monty Ct; Hardwood Ct; Larrymore Ct; Driftwood Ct; Anglewood Ct (Branchwood Ct); Brookwood Ct; Wharton Ct; Nathan Ct; Elsie Cir.
Roosevelt Gardens Area neighborhood detailed profile
Sandy Heights neighborhood in Norfolk statistics: (Find on map)
Area: 0.181 square miles
Population: 596
Population density:
Median household income in 2021:
Median rent in in 2021:
Male vs Females
Median age
Average estimated value of detached houses in 2021 (86.6% of all units):
Most popular occupations of males: service occupations (29.1%); transportation occupations (23.7%); construction, extraction, and maintenance occupations (9.4%); business and financial operations occupations (7.1%); sales and office occupations (6.6%); architecture and engineering occupations (4.8%); management occupations (except farmers) (3.3%)
Most popular occupations of females: sales and office occupations (40.6%); service occupations (21.7%); healthcare practitioners and technical occupations (16.1%); management occupations (except farmers) (8.4%); legal occupations (8.3%); transportation occupations (5.1%); education, training, and library occupations (4.3%)
Highways in this neighborhood: State Rte 165 (N Military Hwy).
Roads and streets: Miller Store Rd; Robin Hood Rd; Croft St; Lynn St; Fulcher Ave; Gurley St; Loam St (Toam St); Faris St; Sandy St; Wise St; Purdy Ct; Emma Ct.
Sandy Heights neighborhood detailed profile
Area: 0.181 square miles
Population: 596
Population density:
| Sandy Heights (Idlewood): | 3,284 people per square mile |
| Norfolk: | 4,376 people per square mile |
Median household income in 2021:
| Sandy Heights (Idlewood): | $55,160 |
| Norfolk: | $58,591 |
Median rent in in 2021:
| Sandy Heights (Idlewood): | $719 |
| Norfolk: | $938 |
Male vs Females
| Males: | 295 |
| Females: | 300 |
Median age
| Males: | 37.0 years |
| Females: | 31.0 years |
Average estimated value of detached houses in 2021 (86.6% of all units):
| Sandy Heights (Idlewood): | $184,187 |
| Norfolk: | $306,640 |
Most popular occupations of males: service occupations (29.1%); transportation occupations (23.7%); construction, extraction, and maintenance occupations (9.4%); business and financial operations occupations (7.1%); sales and office occupations (6.6%); architecture and engineering occupations (4.8%); management occupations (except farmers) (3.3%)
Most popular occupations of females: sales and office occupations (40.6%); service occupations (21.7%); healthcare practitioners and technical occupations (16.1%); management occupations (except farmers) (8.4%); legal occupations (8.3%); transportation occupations (5.1%); education, training, and library occupations (4.3%)
Highways in this neighborhood: State Rte 165 (N Military Hwy).
Roads and streets: Miller Store Rd; Robin Hood Rd; Croft St; Lynn St; Fulcher Ave; Gurley St; Loam St (Toam St); Faris St; Sandy St; Wise St; Purdy Ct; Emma Ct.
Sandy Heights neighborhood detailed profile
Sewells Gardens neighborhood in Norfolk statistics: (Find on map)
Area: 0.213 square miles
Population: 791
Population density:
Median household income in 2021:
Median rent in in 2021:
Male vs Females
Median age
Average estimated value of detached houses in 2021 (89.4% of all units):
Most popular occupations of males: service occupations (23.5%); education, training, and library occupations (18.0%); material moving occupations (11.7%); transportation occupations (9.2%); sales and office occupations (7.8%); community and social services occupations (7.7%); management occupations (except farmers) (6.3%)
Most popular occupations of females: sales and office occupations (32.5%); service occupations (17.0%); legal occupations (15.5%); education, training, and library occupations (13.9%); production occupations (5.5%); material moving occupations (5.5%); community and social services occupations (3.9%)
Roads and streets: Partridge St; Quail St; Sewells Point Rd; Dove St; Devonshire Rd; Winward Rd; S Quail St; Horton Cir; Clare Rd; Palem Rd; Greenwood St; Swan Arch; Teal Ct.
Other features: Branch Wayne Crk.
Sewells Gardens neighborhood detailed profile
Area: 0.213 square miles
Population: 791
Population density:
| Sewells Gardens: | 3,712 people per square mile |
| Norfolk: | 4,376 people per square mile |
Median household income in 2021:
| Sewells Gardens: | $50,593 |
| Norfolk: | $58,591 |
Median rent in in 2021:
| Sewells Gardens: | $776 |
| Norfolk: | $938 |
Male vs Females
| Males: | 316 |
| Females: | 475 |
Median age
| Males: | 35.8 years |
| Females: | 34.1 years |
Average estimated value of detached houses in 2021 (89.4% of all units):
| Sewells Gardens: | $146,062 |
| Norfolk: | $306,640 |
Most popular occupations of males: service occupations (23.5%); education, training, and library occupations (18.0%); material moving occupations (11.7%); transportation occupations (9.2%); sales and office occupations (7.8%); community and social services occupations (7.7%); management occupations (except farmers) (6.3%)
Most popular occupations of females: sales and office occupations (32.5%); service occupations (17.0%); legal occupations (15.5%); education, training, and library occupations (13.9%); production occupations (5.5%); material moving occupations (5.5%); community and social services occupations (3.9%)
Roads and streets: Partridge St; Quail St; Sewells Point Rd; Dove St; Devonshire Rd; Winward Rd; S Quail St; Horton Cir; Clare Rd; Palem Rd; Greenwood St; Swan Arch; Teal Ct.
Other features: Branch Wayne Crk.
Sewells Gardens neighborhood detailed profile
Shadywood East neighborhood in Norfolk statistics: (Find on map)
Area: 0.169 square miles
Population: 805
Population density:
Median household income in 2021:
Median rent in in 2021:
Male vs Females
Median age
Average estimated value of detached houses in 2021 (9.6% of all units):
Most popular occupations of males: service occupations (32.3%); construction, extraction, and maintenance occupations (29.6%); business and financial operations occupations (16.0%); management occupations (except farmers) (7.5%); education, training, and library occupations (7.3%); transportation occupations (6.4%); production occupations (6.0%)
Most popular occupations of females: service occupations (46.9%); sales and office occupations (25.7%); production occupations (9.9%); material moving occupations (9.8%); transportation occupations (8.9%); business and financial operations occupations (6.8%); legal occupations (6.2%)
Highways in this neighborhood: Norview Ave (State Rte 247); State Rte 165 (N Military Hwy).
Roads and streets: Edward St; International Blvd; Mellwood Ct; Picadilly St; Geneva Way; E Tanners Creek Dr; Shadywood Rd; Lois Ln; W Tanners Creek Dr; Strand St.
Shadywood East neighborhood detailed profile
Area: 0.169 square miles
Population: 805
Population density:
| Shadywood East: | 4,767 people per square mile |
| Norfolk: | 4,376 people per square mile |
Median household income in 2021:
| Shadywood East: | $42,036 |
| Norfolk: | $58,591 |
Median rent in in 2021:
| Shadywood East: | $990 |
| Norfolk: | $938 |
Male vs Females
| Males: | 334 |
| Females: | 471 |
Median age
| Males: | 28.1 years |
| Females: | 31.3 years |
Average estimated value of detached houses in 2021 (9.6% of all units):
| Shadywood East: | $159,951 |
| Norfolk: | $306,640 |
Most popular occupations of males: service occupations (32.3%); construction, extraction, and maintenance occupations (29.6%); business and financial operations occupations (16.0%); management occupations (except farmers) (7.5%); education, training, and library occupations (7.3%); transportation occupations (6.4%); production occupations (6.0%)
Most popular occupations of females: service occupations (46.9%); sales and office occupations (25.7%); production occupations (9.9%); material moving occupations (9.8%); transportation occupations (8.9%); business and financial operations occupations (6.8%); legal occupations (6.2%)
Highways in this neighborhood: Norview Ave (State Rte 247); State Rte 165 (N Military Hwy).
Roads and streets: Edward St; International Blvd; Mellwood Ct; Picadilly St; Geneva Way; E Tanners Creek Dr; Shadywood Rd; Lois Ln; W Tanners Creek Dr; Strand St.
Shadywood East neighborhood detailed profile
Sherwood Forest neighborhood in Norfolk statistics: (Find on map)
Area: 0.172 square miles
Population: 1,139
Population density:
Median household income in 2021:
Median rent in in 2021:
Male vs Females
Median age
Average estimated value of detached houses in 2021 (77.5% of all units):
Most popular occupations of males: production occupations (18.2%); service occupations (17.2%); construction, extraction, and maintenance occupations (12.7%); material moving occupations (11.1%); transportation occupations (8.9%); architecture and engineering occupations (6.3%); sales and office occupations (5.9%)
Most popular occupations of females: sales and office occupations (34.5%); healthcare practitioners and technical occupations (14.0%); service occupations (13.3%); management occupations (except farmers) (8.5%); legal occupations (8.0%); business and financial operations occupations (5.0%); education, training, and library occupations (4.6%)
Highways in this neighborhood: Sewells Point Rd (State Rte 194).
Roads and streets: Krick St; Woolsey St; Azalea Garden Rd; Bruce St; Atterbury St; Larkin St; Shafer St; Danwood Dr; Harper St; Lind St; Early St; Winthrop St; Robin Hood Rd; Juniper St; Mc Neal St; Herbert St.
Sherwood Forest neighborhood detailed profile
Area: 0.172 square miles
Population: 1,139
Population density:
| Sherwood Forest: | 6,607 people per square mile |
| Norfolk: | 4,376 people per square mile |
Median household income in 2021:
| Sherwood Forest: | $72,948 |
| Norfolk: | $58,591 |
Median rent in in 2021:
| Sherwood Forest: | $976 |
| Norfolk: | $938 |
Male vs Females
| Males: | 584 |
| Females: | 555 |
Median age
| Males: | 32.3 years |
| Females: | 37.9 years |
Average estimated value of detached houses in 2021 (77.5% of all units):
| Sherwood Forest: | $186,565 |
| Norfolk: | $306,640 |
Most popular occupations of males: production occupations (18.2%); service occupations (17.2%); construction, extraction, and maintenance occupations (12.7%); material moving occupations (11.1%); transportation occupations (8.9%); architecture and engineering occupations (6.3%); sales and office occupations (5.9%)
Most popular occupations of females: sales and office occupations (34.5%); healthcare practitioners and technical occupations (14.0%); service occupations (13.3%); management occupations (except farmers) (8.5%); legal occupations (8.0%); business and financial operations occupations (5.0%); education, training, and library occupations (4.6%)
Highways in this neighborhood: Sewells Point Rd (State Rte 194).
Roads and streets: Krick St; Woolsey St; Azalea Garden Rd; Bruce St; Atterbury St; Larkin St; Shafer St; Danwood Dr; Harper St; Lind St; Early St; Winthrop St; Robin Hood Rd; Juniper St; Mc Neal St; Herbert St.
Sherwood Forest neighborhood detailed profile
South Bayview neighborhood in Norfolk statistics: (Find on map)
Area: 0.331 square miles
Population: 1,613
Population density:
Median household income in 2021:
Median rent in in 2021:
Male vs Females
Median age
Average estimated value of detached houses in 2021 (89.1% of all units):
Most popular occupations of males: sales and office occupations (22.5%); business and financial operations occupations (14.6%); service occupations (12.3%); construction, extraction, and maintenance occupations (9.6%); management occupations (except farmers) (9.1%); architecture and engineering occupations (8.8%); material moving occupations (7.6%)
Most popular occupations of females: education, training, and library occupations (16.5%); sales and office occupations (14.6%); management occupations (except farmers) (11.4%); community and social services occupations (11.3%); service occupations (10.4%); healthcare practitioners and technical occupations (9.0%); business and financial operations occupations (6.7%)
Roads and streets: Tallwood St; Bill St; Carlton St; Pythian Ave; Sheppard Ave; Newell Ave; Quincy St; Fernwood Dr; Frank St; Noble St; Boxwood Cir; Cape View Ave; Dickson Dr; Briarwood Cir; Woody Dr; Barkwood Dr; Winston St; Redwood Cir; Burksdale Rd; Montague St; Evelyn St; Bailey St; Redwood Ct; Dan Ct; Cape View Ct; Woody Ct; Tallwood Ct.
Other features: Little Crk.
South Bayview neighborhood detailed profile
Area: 0.331 square miles
Population: 1,613
Population density:
| South Bayview: | 4,879 people per square mile |
| Norfolk: | 4,376 people per square mile |
Median household income in 2021:
| South Bayview: | $73,820 |
| Norfolk: | $58,591 |
Median rent in in 2021:
| South Bayview: | $970 |
| Norfolk: | $938 |
Male vs Females
| Males: | 933 |
| Females: | 680 |
Median age
| Males: | 37.7 years |
| Females: | 48.8 years |
Average estimated value of detached houses in 2021 (89.1% of all units):
| South Bayview: | $267,368 |
| Norfolk: | $306,640 |
Most popular occupations of males: sales and office occupations (22.5%); business and financial operations occupations (14.6%); service occupations (12.3%); construction, extraction, and maintenance occupations (9.6%); management occupations (except farmers) (9.1%); architecture and engineering occupations (8.8%); material moving occupations (7.6%)
Most popular occupations of females: education, training, and library occupations (16.5%); sales and office occupations (14.6%); management occupations (except farmers) (11.4%); community and social services occupations (11.3%); service occupations (10.4%); healthcare practitioners and technical occupations (9.0%); business and financial operations occupations (6.7%)
Roads and streets: Tallwood St; Bill St; Carlton St; Pythian Ave; Sheppard Ave; Newell Ave; Quincy St; Fernwood Dr; Frank St; Noble St; Boxwood Cir; Cape View Ave; Dickson Dr; Briarwood Cir; Woody Dr; Barkwood Dr; Winston St; Redwood Cir; Burksdale Rd; Montague St; Evelyn St; Bailey St; Redwood Ct; Dan Ct; Cape View Ct; Woody Ct; Tallwood Ct.
Other features: Little Crk.
South Bayview neighborhood detailed profile
South Brambleton neighborhood in Norfolk statistics: (Find on map)
Area: 0.111 square miles
Population: 269
Population density:
Median household income in 2021:
Median rent in in 2021:
Male vs Females
Median age
Average estimated value of detached houses in 2021 (16.2% of all units):
Most popular occupations of males: production occupations (37.7%); service occupations (33.9%); education, training, and library occupations (6.7%); material moving occupations (6.4%); sales and office occupations (5.1%); management occupations (except farmers) (4.6%); legal occupations (3.6%)
Most popular occupations of females: service occupations (48.7%); sales and office occupations (20.2%); production occupations (17.4%); community and social services occupations (6.1%); transportation occupations (2.4%); healthcare practitioners and technical occupations (2.2%); education, training, and library occupations (1.6%)
Limited-access highways (interstate or state) in this neighborhood: I- 264.
Highways in this neighborhood: State Rte 168 (US Hwy 460, E Brambleton Ave); State Rte 337 (US Hwy 460 Alt, Tidewater Dr).
Roads and streets: Park Ave; Claiborne Ave; May Ave; Reservoir Ave; Brown Ave; Carr St; Marshall Ave; Maltby Ave; Leitman St; Willoughby Ave.
Railroad features: Norfolk Southern Rlwy.
South Brambleton neighborhood detailed profile
Area: 0.111 square miles
Population: 269
Population density:
| South Brambleton: | 2,422 people per square mile |
| Norfolk: | 4,376 people per square mile |
Median household income in 2021:
| South Brambleton: | $28,104 |
| Norfolk: | $58,591 |
Median rent in in 2021:
| South Brambleton: | $420 |
| Norfolk: | $938 |
Male vs Females
| Males: | 104 |
| Females: | 165 |
Median age
| Males: | 24.8 years |
| Females: | 30.5 years |
Average estimated value of detached houses in 2021 (16.2% of all units):
| South Brambleton: | $86,762 |
| Norfolk: | $306,640 |
Most popular occupations of males: production occupations (37.7%); service occupations (33.9%); education, training, and library occupations (6.7%); material moving occupations (6.4%); sales and office occupations (5.1%); management occupations (except farmers) (4.6%); legal occupations (3.6%)
Most popular occupations of females: service occupations (48.7%); sales and office occupations (20.2%); production occupations (17.4%); community and social services occupations (6.1%); transportation occupations (2.4%); healthcare practitioners and technical occupations (2.2%); education, training, and library occupations (1.6%)
Limited-access highways (interstate or state) in this neighborhood: I- 264.
Highways in this neighborhood: State Rte 168 (US Hwy 460, E Brambleton Ave); State Rte 337 (US Hwy 460 Alt, Tidewater Dr).
Roads and streets: Park Ave; Claiborne Ave; May Ave; Reservoir Ave; Brown Ave; Carr St; Marshall Ave; Maltby Ave; Leitman St; Willoughby Ave.
Railroad features: Norfolk Southern Rlwy.
South Brambleton neighborhood detailed profile
Spartan Village neighborhood in Norfolk statistics: (Find on map)
Area: 0.048 square miles
Population: 137
Population density:
Median household income in 2021:
Median rent in in 2021:
Male vs Females
Median age
Most popular occupations of males: computer and mathematical occupations (37.1%); service occupations (31.7%); transportation occupations (31.1%); production occupations (18.8%); community and social services occupations (18.1%); healthcare practitioners and technical occupations (15.7%); sales and office occupations (10.5%)
Most popular occupations of females: community and social services occupations (31.6%); healthcare practitioners and technical occupations (24.3%); sales and office occupations (19.5%); management occupations (except farmers) (17.9%); production occupations (15.8%); transportation occupations (9.6%); service occupations (5.5%)
Highways in this neighborhood: US Hwy 58 (E Virginia Beach Blvd).
Roads and streets: Madison Ave; Myrtle Ave; Mapole Ave; Dubose Dr; Kenton Ave; Marathon Ave; Bowe Pl; Covenant St.
Spartan Village neighborhood detailed profile
Area: 0.048 square miles
Population: 137
Population density:
| Spartan Village: | 2,867 people per square mile |
| Norfolk: | 4,376 people per square mile |
Median household income in 2021:
| Spartan Village: | $13,621 |
| Norfolk: | $58,591 |
Median rent in in 2021:
| Spartan Village: | $629 |
| Norfolk: | $938 |
Male vs Females
| Males: | 68 |
| Females: | 68 |
Median age
| Males: | 40.5 years |
| Females: | 51.3 years |
Most popular occupations of males: computer and mathematical occupations (37.1%); service occupations (31.7%); transportation occupations (31.1%); production occupations (18.8%); community and social services occupations (18.1%); healthcare practitioners and technical occupations (15.7%); sales and office occupations (10.5%)
Most popular occupations of females: community and social services occupations (31.6%); healthcare practitioners and technical occupations (24.3%); sales and office occupations (19.5%); management occupations (except farmers) (17.9%); production occupations (15.8%); transportation occupations (9.6%); service occupations (5.5%)
Highways in this neighborhood: US Hwy 58 (E Virginia Beach Blvd).
Roads and streets: Madison Ave; Myrtle Ave; Mapole Ave; Dubose Dr; Kenton Ave; Marathon Ave; Bowe Pl; Covenant St.
Spartan Village neighborhood detailed profile
St. Andrews neighborhood in Norfolk statistics: (Find on map)
Area: 0.040 square miles
Population: 147
Population density:
Median household income in 2021:
Median rent in in 2021:
Male vs Females
Median age
Most popular occupations of males: service occupations (42.7%); construction, extraction, and maintenance occupations (21.9%); material moving occupations (17.0%); transportation occupations (13.2%); sales and office occupations (7.7%); business and financial operations occupations (5.2%); arts, design, entertainment, sports, and media occupations (1.9%)
Most popular occupations of females: sales and office occupations (62.1%); service occupations (23.7%); computer and mathematical occupations (14.0%); architecture and engineering occupations (6.5%); material moving occupations (5.2%); business and financial operations occupations (4.7%); education, training, and library occupations (3.6%)
Roads and streets: Longdale Dr; E Tanners Creek Dr.
St. Andrews neighborhood detailed profile
Area: 0.040 square miles
Population: 147
Population density:
| St. Andrews: | 3,680 people per square mile |
| Norfolk: | 4,376 people per square mile |
Median household income in 2021:
| St. Andrews: | $36,242 |
| Norfolk: | $58,591 |
Median rent in in 2021:
| St. Andrews: | $862 |
| Norfolk: | $938 |
Male vs Females
| Males: | 61 |
| Females: | 86 |
Median age
| Males: | 24.5 years |
| Females: | 31.2 years |
Most popular occupations of males: service occupations (42.7%); construction, extraction, and maintenance occupations (21.9%); material moving occupations (17.0%); transportation occupations (13.2%); sales and office occupations (7.7%); business and financial operations occupations (5.2%); arts, design, entertainment, sports, and media occupations (1.9%)
Most popular occupations of females: sales and office occupations (62.1%); service occupations (23.7%); computer and mathematical occupations (14.0%); architecture and engineering occupations (6.5%); material moving occupations (5.2%); business and financial operations occupations (4.7%); education, training, and library occupations (3.6%)
Roads and streets: Longdale Dr; E Tanners Creek Dr.
St. Andrews neighborhood detailed profile
Stonebridge neighborhood in Norfolk statistics: (Find on map)
Area: 0.090 square miles
Population: 459
Population density:
Median household income in 2021:
Median rent in in 2021:
Male vs Females
Median age
Most popular occupations of males: sales and office occupations (18.3%); service occupations (16.2%); management occupations (except farmers) (8.8%); construction, extraction, and maintenance occupations (5.9%); business and financial operations occupations (3.1%); community and social services occupations (2.8%); transportation occupations (1.6%)
Most popular occupations of females: sales and office occupations (42.2%); service occupations (16.7%); education, training, and library occupations (15.7%); material moving occupations (7.6%); management occupations (except farmers) (6.7%); healthcare practitioners and technical occupations (6.7%); community and social services occupations (2.1%)
Roads and streets: Stonebridge Dr; Lakebridge Dr; Granite Arch; Limestone Arch (Center Park Cir).
Stonebridge neighborhood detailed profile
Area: 0.090 square miles
Population: 459
Population density:
| Stonebridge: | 5,105 people per square mile |
| Norfolk: | 4,376 people per square mile |
Median household income in 2021:
| Stonebridge: | $66,574 |
| Norfolk: | $58,591 |
Median rent in in 2021:
| Stonebridge: | $800 |
| Norfolk: | $938 |
Male vs Females
| Males: | 243 |
| Females: | 215 |
Median age
| Males: | 31.4 years |
| Females: | 44.1 years |
Most popular occupations of males: sales and office occupations (18.3%); service occupations (16.2%); management occupations (except farmers) (8.8%); construction, extraction, and maintenance occupations (5.9%); business and financial operations occupations (3.1%); community and social services occupations (2.8%); transportation occupations (1.6%)
Most popular occupations of females: sales and office occupations (42.2%); service occupations (16.7%); education, training, and library occupations (15.7%); material moving occupations (7.6%); management occupations (except farmers) (6.7%); healthcare practitioners and technical occupations (6.7%); community and social services occupations (2.1%)
Roads and streets: Stonebridge Dr; Lakebridge Dr; Granite Arch; Limestone Arch (Center Park Cir).
Stonebridge neighborhood detailed profile
Suburban Acres neighborhood in Norfolk statistics: (Find on map)
Area: 0.492 square miles
Population: 3,691
Population density:
Median household income in 2021:
Median rent in in 2021:
Male vs Females
Median age
Average estimated value of detached houses in 2021 (18.6% of all units):
Most popular occupations of males: service occupations (23.4%); production occupations (15.1%); sales and office occupations (10.6%); computer and mathematical occupations (10.4%); education, training, and library occupations (6.9%); management occupations (except farmers) (6.0%); architecture and engineering occupations (6.0%)
Most popular occupations of females: sales and office occupations (44.8%); service occupations (18.9%); education, training, and library occupations (11.1%); management occupations (except farmers) (7.6%); community and social services occupations (7.2%); healthcare practitioners and technical occupations (3.3%); material moving occupations (3.1%)
Roads and streets: Thole St; Suburban Pkwy; Kirby Cres; Virginian Dr; Yorktown Dr; Parkdale Dr; Suburban Arch; Galveston Blvd; Granby Park; Carl St; Glen Echo Dr; Midfield St; W Kenmore Dr; E Kenmore Dr; Brickby Rd; Forsythe St; Woodfin Ave; Gunn Ct; Fife Ln; Caton St; Louisiana Dr; Norva Park; Sue Ln; Fife St.
Other features: Branch Wayne Crk.
Suburban Acres neighborhood detailed profile
Area: 0.492 square miles
Population: 3,691
Population density:
| Suburban Acres: | 7,498 people per square mile |
| Norfolk: | 4,376 people per square mile |
Median household income in 2021:
| Suburban Acres: | $30,117 |
| Norfolk: | $58,591 |
Median rent in in 2021:
| Suburban Acres: | $661 |
| Norfolk: | $938 |
Male vs Females
| Males: | 1,610 |
| Females: | 2,081 |
Median age
| Males: | 42.2 years |
| Females: | 38.9 years |
Average estimated value of detached houses in 2021 (18.6% of all units):
| Suburban Acres: | $212,619 |
| Norfolk: | $306,640 |
Most popular occupations of males: service occupations (23.4%); production occupations (15.1%); sales and office occupations (10.6%); computer and mathematical occupations (10.4%); education, training, and library occupations (6.9%); management occupations (except farmers) (6.0%); architecture and engineering occupations (6.0%)
Most popular occupations of females: sales and office occupations (44.8%); service occupations (18.9%); education, training, and library occupations (11.1%); management occupations (except farmers) (7.6%); community and social services occupations (7.2%); healthcare practitioners and technical occupations (3.3%); material moving occupations (3.1%)
Roads and streets: Thole St; Suburban Pkwy; Kirby Cres; Virginian Dr; Yorktown Dr; Parkdale Dr; Suburban Arch; Galveston Blvd; Granby Park; Carl St; Glen Echo Dr; Midfield St; W Kenmore Dr; E Kenmore Dr; Brickby Rd; Forsythe St; Woodfin Ave; Gunn Ct; Fife Ln; Caton St; Louisiana Dr; Norva Park; Sue Ln; Fife St.
Other features: Branch Wayne Crk.
Suburban Acres neighborhood detailed profile
Talbot Park neighborhood in Norfolk statistics: (Find on map)
Area: 0.210 square miles
Population: 816
Population density:
Median household income in 2021:
Median rent in in 2021:
Male vs Females
Median age
Average estimated value of detached houses in 2021 (27.4% of all units):
Most popular occupations of males: sales and office occupations (32.1%); management occupations (except farmers) (20.7%); architecture and engineering occupations (7.4%); construction, extraction, and maintenance occupations (7.0%); material moving occupations (4.5%); healthcare practitioners and technical occupations (4.4%); education, training, and library occupations (2.2%)
Most popular occupations of females: service occupations (24.7%); education, training, and library occupations (14.3%); sales and office occupations (13.0%); healthcare practitioners and technical occupations (11.5%); management occupations (except farmers) (11.0%); computer and mathematical occupations (9.7%); business and financial operations occupations (8.1%)
Highways in this neighborhood: US Hwy 460 (Granby St).
Roads and streets: Oak Grove Rd; Talbot Hall Rd; Carlisle Way; Sinclair St; Catherine St; Colonial Ave; Whiting St; Brackenridge Ave; Newport Ave; Caroline St; Mallard Dr.
Talbot Park neighborhood detailed profile
Area: 0.210 square miles
Population: 816
Population density:
| Talbot Park: | 3,878 people per square mile |
| Norfolk: | 4,376 people per square mile |
Median household income in 2021:
| Talbot Park: | $74,817 |
| Norfolk: | $58,591 |
Median rent in in 2021:
| Talbot Park: | $826 |
| Norfolk: | $938 |
Male vs Females
| Males: | 470 |
| Females: | 345 |
Median age
| Males: | 33.8 years |
| Females: | 45.3 years |
Average estimated value of detached houses in 2021 (27.4% of all units):
| Talbot Park: | $345,580 |
| Norfolk: | $306,640 |
Most popular occupations of males: sales and office occupations (32.1%); management occupations (except farmers) (20.7%); architecture and engineering occupations (7.4%); construction, extraction, and maintenance occupations (7.0%); material moving occupations (4.5%); healthcare practitioners and technical occupations (4.4%); education, training, and library occupations (2.2%)
Most popular occupations of females: service occupations (24.7%); education, training, and library occupations (14.3%); sales and office occupations (13.0%); healthcare practitioners and technical occupations (11.5%); management occupations (except farmers) (11.0%); computer and mathematical occupations (9.7%); business and financial operations occupations (8.1%)
Highways in this neighborhood: US Hwy 460 (Granby St).
Roads and streets: Oak Grove Rd; Talbot Hall Rd; Carlisle Way; Sinclair St; Catherine St; Colonial Ave; Whiting St; Brackenridge Ave; Newport Ave; Caroline St; Mallard Dr.
Talbot Park neighborhood detailed profile
Tanners Creek neighborhood in Norfolk statistics: (Find on map)
Area: 0.135 square miles
Population: 498
Population density:
Median household income in 2021:
Median rent in in 2021:
Male vs Females
Median age
Most popular occupations of males: service occupations (42.8%); construction, extraction, and maintenance occupations (21.8%); material moving occupations (17.1%); management occupations (except farmers) (15.2%); transportation occupations (13.2%); sales and office occupations (7.7%); business and financial operations occupations (5.1%)
Most popular occupations of females: sales and office occupations (62.4%); service occupations (23.5%); computer and mathematical occupations (14.1%); architecture and engineering occupations (6.5%); healthcare practitioners and technical occupations (6.5%); material moving occupations (5.2%); business and financial operations occupations (4.7%)
Roads and streets: Myers Rd; Branch Rd; E Tanners Creek Dr; Cedarwood Ct; Arbor Ave; Silverwood Ct; Ramblewood Dr; Orangewood Ave; Bonnot Dr; W Tanners Creek Dr; Falkland Dr.
Tanners Creek neighborhood detailed profile
Area: 0.135 square miles
Population: 498
Population density:
| Tanners Creek: | 3,679 people per square mile |
| Norfolk: | 4,376 people per square mile |
Median household income in 2021:
| Tanners Creek: | $39,958 |
| Norfolk: | $58,591 |
Median rent in in 2021:
| Tanners Creek: | $861 |
| Norfolk: | $938 |
Male vs Females
| Males: | 205 |
| Females: | 292 |
Median age
| Males: | 18.0 years |
| Females: | 25.7 years |
Most popular occupations of males: service occupations (42.8%); construction, extraction, and maintenance occupations (21.8%); material moving occupations (17.1%); management occupations (except farmers) (15.2%); transportation occupations (13.2%); sales and office occupations (7.7%); business and financial operations occupations (5.1%)
Most popular occupations of females: sales and office occupations (62.4%); service occupations (23.5%); computer and mathematical occupations (14.1%); architecture and engineering occupations (6.5%); healthcare practitioners and technical occupations (6.5%); material moving occupations (5.2%); business and financial operations occupations (4.7%)
Roads and streets: Myers Rd; Branch Rd; E Tanners Creek Dr; Cedarwood Ct; Arbor Ave; Silverwood Ct; Ramblewood Dr; Orangewood Ave; Bonnot Dr; W Tanners Creek Dr; Falkland Dr.
Tanners Creek neighborhood detailed profile
The Gardens neighborhood in Norfolk statistics: (Find on map)
Area: 0.105 square miles
Population: 140
Population density:
Median household income in 2021:
Median rent in in 2021:
Male vs Females
Median age
Average estimated value of detached houses in 2021 (79.0% of all units):
Most popular occupations of males: management occupations (except farmers) (15.6%); sales and office occupations (14.3%); construction, extraction, and maintenance occupations (13.7%); business and financial operations occupations (13.6%); material moving occupations (9.1%); production occupations (7.4%); computer and mathematical occupations (6.0%)
Most popular occupations of females: sales and office occupations (31.1%); education, training, and library occupations (20.6%); service occupations (14.7%); business and financial operations occupations (12.9%); healthcare practitioners and technical occupations (11.8%); management occupations (except farmers) (5.2%); community and social services occupations (3.3%)
Roads and streets: Wingfield Rd; W Azalea Point Rd; Honeysuckle Rd; Martone Rd; Sharon Cir; Buttercup Ct; Daisy Ct; Lilac Ct.
The Gardens neighborhood detailed profile
Area: 0.105 square miles
Population: 140
Population density:
| The Gardens: | 1,339 people per square mile |
| Norfolk: | 4,376 people per square mile |
Median household income in 2021:
| The Gardens: | $82,572 |
| Norfolk: | $58,591 |
Median rent in in 2021:
| The Gardens: | $937 |
| Norfolk: | $938 |
Male vs Females
| Males: | 73 |
| Females: | 67 |
Median age
| Males: | 43.9 years |
| Females: | 43.7 years |
Average estimated value of detached houses in 2021 (79.0% of all units):
| The Gardens: | $251,977 |
| Norfolk: | $306,640 |
Most popular occupations of males: management occupations (except farmers) (15.6%); sales and office occupations (14.3%); construction, extraction, and maintenance occupations (13.7%); business and financial operations occupations (13.6%); material moving occupations (9.1%); production occupations (7.4%); computer and mathematical occupations (6.0%)
Most popular occupations of females: sales and office occupations (31.1%); education, training, and library occupations (20.6%); service occupations (14.7%); business and financial operations occupations (12.9%); healthcare practitioners and technical occupations (11.8%); management occupations (except farmers) (5.2%); community and social services occupations (3.3%)
Roads and streets: Wingfield Rd; W Azalea Point Rd; Honeysuckle Rd; Martone Rd; Sharon Cir; Buttercup Ct; Daisy Ct; Lilac Ct.
The Gardens neighborhood detailed profile
Tidewater Gardens neighborhood in Norfolk statistics: (Find on map)
Area: 0.081 square miles
Population: 472
Population density:
Median household income in 2021:
Median rent in in 2021:
Male vs Females
Median age
Average estimated value of detached houses in 2021 (4.7% of all units):
Most popular occupations of males: production occupations (37.6%); service occupations (29.7%); material moving occupations (10.2%); sales and office occupations (9.1%); education, training, and library occupations (6.5%); business and financial operations occupations (4.6%); management occupations (except farmers) (2.2%)
Most popular occupations of females: service occupations (59.8%); production occupations (21.1%); sales and office occupations (16.5%); management occupations (except farmers) (1.7%)
Highways in this neighborhood: State Rte 337 (US Hwy 460 Alt, Tidewater Dr).
Roads and streets: E Charlotte St; Holt St; Chapel St; Mariner St; E City Hall Ave; Reilly St; Ruffner St; Walke St; Virgin St.
Tidewater Gardens neighborhood detailed profile
Area: 0.081 square miles
Population: 472
Population density:
| Tidewater Gardens: | 5,818 people per square mile |
| Norfolk: | 4,376 people per square mile |
Median household income in 2021:
| Tidewater Gardens: | $13,356 |
| Norfolk: | $58,591 |
Median rent in in 2021:
| Tidewater Gardens: | $243 |
| Norfolk: | $938 |
Male vs Females
| Males: | 158 |
| Females: | 314 |
Median age
| Males: | 21.3 years |
| Females: | 34.9 years |
Average estimated value of detached houses in 2021 (4.7% of all units):
| Tidewater Gardens: | $86,762 |
| Norfolk: | $306,640 |
Most popular occupations of males: production occupations (37.6%); service occupations (29.7%); material moving occupations (10.2%); sales and office occupations (9.1%); education, training, and library occupations (6.5%); business and financial operations occupations (4.6%); management occupations (except farmers) (2.2%)
Most popular occupations of females: service occupations (59.8%); production occupations (21.1%); sales and office occupations (16.5%); management occupations (except farmers) (1.7%)
Highways in this neighborhood: State Rte 337 (US Hwy 460 Alt, Tidewater Dr).
Roads and streets: E Charlotte St; Holt St; Chapel St; Mariner St; E City Hall Ave; Reilly St; Ruffner St; Walke St; Virgin St.
Tidewater Gardens neighborhood detailed profile
Titustown neighborhood in Norfolk statistics: (Find on map)
Area: 0.183 square miles
Population: 1,860
Population density:
Median household income in 2021:
Median rent in in 2021:
Male vs Females
Median age
Average estimated value of detached houses in 2021 (39.9% of all units):
Most popular occupations of males: service occupations (23.2%); sales and office occupations (22.6%); transportation occupations (21.9%); business and financial operations occupations (9.2%); education, training, and library occupations (7.0%); material moving occupations (5.5%); architecture and engineering occupations (3.5%)
Most popular occupations of females: sales and office occupations (40.5%); education, training, and library occupations (11.6%); production occupations (11.0%); transportation occupations (8.4%); healthcare practitioners and technical occupations (8.2%); business and financial operations occupations (6.5%); service occupations (6.5%)
Highways in this neighborhood: State Rte 165 (W Little Creek Rd).
Roads and streets: Diven St; Meads Rd; Hannah St; Hughart St; Baltimore St; Lex St; Ogden Ave; Pelham St; Mount Pleasant Ave; Fargo Ave; Dakota St; Armfield Ave; Elliott St; Wilmington St; Willingham St; Matthew Henson St; Logan St; Paul St; Charleston St; Tucker Ave; Weidman St.
Railroad features: Norfolk Southern Rlwy.
Titustown neighborhood detailed profile
Area: 0.183 square miles
Population: 1,860
Population density:
| Titustown: | 10,153 people per square mile |
| Norfolk: | 4,376 people per square mile |
Median household income in 2021:
| Titustown: | $63,072 |
| Norfolk: | $58,591 |
Median rent in in 2021:
| Titustown: | $838 |
| Norfolk: | $938 |
Male vs Females
| Males: | 850 |
| Females: | 1,009 |
Median age
| Males: | 33.0 years |
| Females: | 35.9 years |
Average estimated value of detached houses in 2021 (39.9% of all units):
| Titustown: | $245,661 |
| Norfolk: | $306,640 |
Most popular occupations of males: service occupations (23.2%); sales and office occupations (22.6%); transportation occupations (21.9%); business and financial operations occupations (9.2%); education, training, and library occupations (7.0%); material moving occupations (5.5%); architecture and engineering occupations (3.5%)
Most popular occupations of females: sales and office occupations (40.5%); education, training, and library occupations (11.6%); production occupations (11.0%); transportation occupations (8.4%); healthcare practitioners and technical occupations (8.2%); business and financial operations occupations (6.5%); service occupations (6.5%)
Highways in this neighborhood: State Rte 165 (W Little Creek Rd).
Roads and streets: Diven St; Meads Rd; Hannah St; Hughart St; Baltimore St; Lex St; Ogden Ave; Pelham St; Mount Pleasant Ave; Fargo Ave; Dakota St; Armfield Ave; Elliott St; Wilmington St; Willingham St; Matthew Henson St; Logan St; Paul St; Charleston St; Tucker Ave; Weidman St.
Railroad features: Norfolk Southern Rlwy.
Titustown neighborhood detailed profile
Villa Heights neighborhood in Norfolk statistics: (Find on map)
Area: 0.092 square miles
Population: 172
Population density:
Median household income in 2021:
Median rent in in 2021:
Male vs Females
Median age
Average estimated value of detached houses in 2021 (34.0% of all units):
Most popular occupations of males: production occupations (31.2%); service occupations (23.6%); transportation occupations (16.3%); construction, extraction, and maintenance occupations (9.7%); life, physical, and social science occupations (9.6%); sales and office occupations (8.4%); architecture and engineering occupations (4.0%)
Most popular occupations of females: sales and office occupations (49.7%); service occupations (25.8%); management occupations (except farmers) (15.6%); education, training, and library occupations (8.6%); arts, design, entertainment, sports, and media occupations (2.4%); business and financial operations occupations (1.7%)
Highways in this neighborhood: State Rte 247 (E 26th St).
Roads and streets: E 28th St; E 27th St; Gazel St; E 29th St; Leo St; Villa Cir; E 30th St; Fawn St; Waverly Way; Ruffin Way; Druid Cir; Rialto Pl.
Villa Heights neighborhood detailed profile
Area: 0.092 square miles
Population: 172
Population density:
| Villa Heights: | 1,867 people per square mile |
| Norfolk: | 4,376 people per square mile |
Median household income in 2021:
| Villa Heights: | $48,133 |
| Norfolk: | $58,591 |
Median rent in in 2021:
| Villa Heights: | $837 |
| Norfolk: | $938 |
Male vs Females
| Males: | 69 |
| Females: | 102 |
Median age
| Males: | 36.4 years |
| Females: | 45.9 years |
Average estimated value of detached houses in 2021 (34.0% of all units):
| Villa Heights: | $126,202 |
| Norfolk: | $306,640 |
Most popular occupations of males: production occupations (31.2%); service occupations (23.6%); transportation occupations (16.3%); construction, extraction, and maintenance occupations (9.7%); life, physical, and social science occupations (9.6%); sales and office occupations (8.4%); architecture and engineering occupations (4.0%)
Most popular occupations of females: sales and office occupations (49.7%); service occupations (25.8%); management occupations (except farmers) (15.6%); education, training, and library occupations (8.6%); arts, design, entertainment, sports, and media occupations (2.4%); business and financial operations occupations (1.7%)
Highways in this neighborhood: State Rte 247 (E 26th St).
Roads and streets: E 28th St; E 27th St; Gazel St; E 29th St; Leo St; Villa Cir; E 30th St; Fawn St; Waverly Way; Ruffin Way; Druid Cir; Rialto Pl.
Villa Heights neighborhood detailed profile
Wards Corner neighborhood in Norfolk statistics: (Find on map)
Area: 0.553 square miles
Population: 3,963
Population density:
Median household income in 2021:
Median rent in in 2021:
Male vs Females
Median age
Average estimated value of detached houses in 2021 (39.2% of all units):
Most popular occupations of males: service occupations (27.0%); sales and office occupations (19.2%); transportation occupations (8.9%); management occupations (except farmers) (7.5%); computer and mathematical occupations (5.6%); construction, extraction, and maintenance occupations (5.6%); material moving occupations (4.7%)
Most popular occupations of females: sales and office occupations (31.0%); service occupations (28.8%); education, training, and library occupations (8.9%); management occupations (except farmers) (7.2%); business and financial operations occupations (6.0%); community and social services occupations (5.9%); material moving occupations (4.5%)
Highways in this neighborhood: State Rte 165 (W Little Creek Rd); US Hwy 460 (Granby St).
Roads and streets: Burleigh Ave; N Shore Rd; Maycox Ave; Birmingham Ave; Newport Ave; Timothy Ave; Ruthven Rd; Restmere Rd; Grantham Rd; Sterling St; Millbrook Rd; Bradford Ave; Sheryl Dr; Gloucester Ave; Colony Point Rd; Hariton Ct; Meads Rd; Victory Dr; Fayver Ave; Doris Dr; Nesbitt Dr; Butterworth St; Bondale Ave; Colonial Ave; Cedar Level Rd; Rebel Rd; Barcliff Rd; Lankford Ave; Sterling Ct; Abbott Ln; Elvin Ct; de Creny Cir; Chevy Cir; Elvin Rd; Michael Dr.
Railroad features: Norfolk Southern Rlwy.
Wards Corner neighborhood detailed profile
Area: 0.553 square miles
Population: 3,963
Population density:
| Wards Corner: | 7,163 people per square mile |
| Norfolk: | 4,376 people per square mile |
Median household income in 2021:
| Wards Corner: | $56,590 |
| Norfolk: | $58,591 |
Median rent in in 2021:
| Wards Corner: | $918 |
| Norfolk: | $938 |
Male vs Females
| Males: | 2,085 |
| Females: | 1,877 |
Median age
| Males: | 31.5 years |
| Females: | 35.5 years |
Average estimated value of detached houses in 2021 (39.2% of all units):
| Wards Corner: | $278,099 |
| Norfolk: | $306,640 |
Most popular occupations of males: service occupations (27.0%); sales and office occupations (19.2%); transportation occupations (8.9%); management occupations (except farmers) (7.5%); computer and mathematical occupations (5.6%); construction, extraction, and maintenance occupations (5.6%); material moving occupations (4.7%)
Most popular occupations of females: sales and office occupations (31.0%); service occupations (28.8%); education, training, and library occupations (8.9%); management occupations (except farmers) (7.2%); business and financial operations occupations (6.0%); community and social services occupations (5.9%); material moving occupations (4.5%)
Highways in this neighborhood: State Rte 165 (W Little Creek Rd); US Hwy 460 (Granby St).
Roads and streets: Burleigh Ave; N Shore Rd; Maycox Ave; Birmingham Ave; Newport Ave; Timothy Ave; Ruthven Rd; Restmere Rd; Grantham Rd; Sterling St; Millbrook Rd; Bradford Ave; Sheryl Dr; Gloucester Ave; Colony Point Rd; Hariton Ct; Meads Rd; Victory Dr; Fayver Ave; Doris Dr; Nesbitt Dr; Butterworth St; Bondale Ave; Colonial Ave; Cedar Level Rd; Rebel Rd; Barcliff Rd; Lankford Ave; Sterling Ct; Abbott Ln; Elvin Ct; de Creny Cir; Chevy Cir; Elvin Rd; Michael Dr.
Railroad features: Norfolk Southern Rlwy.
Wards Corner neighborhood detailed profile
Wards Corner Business Association neighborhood in Norfolk statistics: (Find on map)
Area: 0.035 square miles
Population: 205
Population density:
Median household income in 2021:
Median rent in in 2021:
Male vs Females
Median age
Average estimated value of detached houses in 2021 (23.0% of all units):
Most popular occupations of males: sales and office occupations (19.8%); service occupations (16.7%); management occupations (except farmers) (12.4%); production occupations (10.1%); architecture and engineering occupations (8.7%); computer and mathematical occupations (5.6%); business and financial operations occupations (3.8%)
Most popular occupations of females: sales and office occupations (31.8%); service occupations (21.3%); education, training, and library occupations (14.2%); management occupations (except farmers) (10.7%); community and social services occupations (4.2%); business and financial operations occupations (3.8%); healthcare practitioners and technical occupations (3.7%)
Highways in this neighborhood: US Hwy 460 (Granby St); State Rte 165 (E Little Creek Rd); State Rte 165 (W Little Creek Rd).
Roads and streets: Warren St.
Wards Corner Business Association neighborhood detailed profile
Area: 0.035 square miles
Population: 205
Population density:
| Wards Corner Business Association: | 5,863 people per square mile |
| Norfolk: | 4,376 people per square mile |
Median household income in 2021:
| Wards Corner Business Association: | $48,924 |
| Norfolk: | $58,591 |
Median rent in in 2021:
| Wards Corner Business Association: | $710 |
| Norfolk: | $938 |
Male vs Females
| Males: | 99 |
| Females: | 105 |
Median age
| Males: | 38.6 years |
| Females: | 36.0 years |
Average estimated value of detached houses in 2021 (23.0% of all units):
| Wards Corner Business Association: | $274,715 |
| Norfolk: | $306,640 |
Most popular occupations of males: sales and office occupations (19.8%); service occupations (16.7%); management occupations (except farmers) (12.4%); production occupations (10.1%); architecture and engineering occupations (8.7%); computer and mathematical occupations (5.6%); business and financial operations occupations (3.8%)
Most popular occupations of females: sales and office occupations (31.8%); service occupations (21.3%); education, training, and library occupations (14.2%); management occupations (except farmers) (10.7%); community and social services occupations (4.2%); business and financial operations occupations (3.8%); healthcare practitioners and technical occupations (3.7%)
Highways in this neighborhood: US Hwy 460 (Granby St); State Rte 165 (E Little Creek Rd); State Rte 165 (W Little Creek Rd).
Roads and streets: Warren St.
Wards Corner Business Association neighborhood detailed profile
Waston Place neighborhood in Norfolk statistics: (Find on map)
Area: 0.321 square miles
Population: 581
Population density:
Median household income in 2021:
Median rent in in 2021:
Male vs Females
Median age
Average estimated value of detached houses in 2021 (67.6% of all units):
Most popular occupations of males: legal occupations (20.4%); business and financial operations occupations (18.3%); service occupations (18.3%); management occupations (except farmers) (12.7%); sales and office occupations (9.4%); construction, extraction, and maintenance occupations (7.0%); computer and mathematical occupations (3.1%)
Most popular occupations of females: service occupations (37.5%); sales and office occupations (26.5%); healthcare practitioners and technical occupations (9.2%); business and financial operations occupations (8.6%); management occupations (except farmers) (7.4%); computer and mathematical occupations (2.5%); material moving occupations (2.5%)
Roads and streets: Sellger Dr; W Mc Ginnis Cir; Faulk Rd; E Mc Ginnis Cir; Jerry Rd; Brinda Ave; Mc Clure Rd; McGinnis Cir; Lathan Rd; Whitney Blvd; Appleton Dr; Oetjen Blvd; Pefley Dr; Lydia Ave; Effie Ave; Midge Cres; Kidd Blvd; Burbank Ct; Inez Ave; Pefley Ct; Jerry Ct; McGinnis Ct; Brinda Ct.
Waston Place neighborhood detailed profile
Area: 0.321 square miles
Population: 581
Population density:
| Waston Place (River Forrest Shores): | 1,811 people per square mile |
| Norfolk: | 4,376 people per square mile |
Median household income in 2021:
| Waston Place (River Forrest Shores): | $72,093 |
| Norfolk: | $58,591 |
Median rent in in 2021:
| Waston Place (River Forrest Shores): | $1,109 |
| Norfolk: | $938 |
Male vs Females
| Males: | 298 |
| Females: | 282 |
Median age
| Males: | 40.7 years |
| Females: | 44.8 years |
Average estimated value of detached houses in 2021 (67.6% of all units):
| Waston Place (River Forrest Shores): | $223,314 |
| Norfolk: | $306,640 |
Most popular occupations of males: legal occupations (20.4%); business and financial operations occupations (18.3%); service occupations (18.3%); management occupations (except farmers) (12.7%); sales and office occupations (9.4%); construction, extraction, and maintenance occupations (7.0%); computer and mathematical occupations (3.1%)
Most popular occupations of females: service occupations (37.5%); sales and office occupations (26.5%); healthcare practitioners and technical occupations (9.2%); business and financial operations occupations (8.6%); management occupations (except farmers) (7.4%); computer and mathematical occupations (2.5%); material moving occupations (2.5%)
Roads and streets: Sellger Dr; W Mc Ginnis Cir; Faulk Rd; E Mc Ginnis Cir; Jerry Rd; Brinda Ave; Mc Clure Rd; McGinnis Cir; Lathan Rd; Whitney Blvd; Appleton Dr; Oetjen Blvd; Pefley Dr; Lydia Ave; Effie Ave; Midge Cres; Kidd Blvd; Burbank Ct; Inez Ave; Pefley Ct; Jerry Ct; McGinnis Ct; Brinda Ct.
Waston Place neighborhood detailed profile
Waters Edge neighborhood in Norfolk statistics: (Find on map)
Area: 0.069 square miles
Population: 114
Population density:
Median household income in 2021:
Median rent in in 2021:
Male vs Females
Median age
Housing prices:
Average estimated value of detached houses in 2021 (82.6% of all units):
Average estimated value of mobile home in 2021 (2.9% of all units):
Most popular occupations of males: production occupations (24.4%); sales and office occupations (20.4%); arts, design, entertainment, sports, and media occupations (14.7%); transportation occupations (9.1%); computer and mathematical occupations (8.5%); material moving occupations (4.0%); construction, extraction, and maintenance occupations (1.7%)
Most popular occupations of females: sales and office occupations (29.9%); management occupations (except farmers) (20.1%); education, training, and library occupations (20.1%); service occupations (9.2%); business and financial operations occupations (7.1%); transportation occupations (7.1%); production occupations (1.1%)
Roads and streets: Gray Falcon Dr; Foxs Lair Trl; Hunters Chase; Foxes Lair Ct; Grayfalcon Ct.
Waters Edge neighborhood detailed profile
Area: 0.069 square miles
Population: 114
Population density:
| Waters Edge: | 1,642 people per square mile |
| Norfolk: | 4,376 people per square mile |
Median household income in 2021:
| Waters Edge: | $83,413 |
| Norfolk: | $58,591 |
Median rent in in 2021:
| Waters Edge: | $790 |
| Norfolk: | $938 |
Male vs Females
| Males: | 56 |
| Females: | 57 |
Median age
| Males: | 45.3 years |
| Females: | 47.7 years |
Housing prices:
Average estimated value of detached houses in 2021 (82.6% of all units):
| Waters Edge: | $327,201 |
| Norfolk: | $306,640 |
Average estimated value of mobile home in 2021 (2.9% of all units):
| Waters Edge: | $12,746 |
| Norfolk: | $23,245 |
Most popular occupations of males: production occupations (24.4%); sales and office occupations (20.4%); arts, design, entertainment, sports, and media occupations (14.7%); transportation occupations (9.1%); computer and mathematical occupations (8.5%); material moving occupations (4.0%); construction, extraction, and maintenance occupations (1.7%)
Most popular occupations of females: sales and office occupations (29.9%); management occupations (except farmers) (20.1%); education, training, and library occupations (20.1%); service occupations (9.2%); business and financial operations occupations (7.1%); transportation occupations (7.1%); production occupations (1.1%)
Roads and streets: Gray Falcon Dr; Foxs Lair Trl; Hunters Chase; Foxes Lair Ct; Grayfalcon Ct.
Waters Edge neighborhood detailed profile
Waverly On Broad Creek neighborhood in Norfolk statistics: (Find on map)
Area: 0.016 square miles
Population: 36
Population density:
Median household income in 2021:
Median rent in in 2021:
Male vs Females
Median age
Average estimated value of detached houses in 2021 (86.7% of all units):
Most popular occupations of males: service occupations (31.5%); material moving occupations (20.3%); computer and mathematical occupations (14.2%); sales and office occupations (8.7%); construction, extraction, and maintenance occupations (8.3%); management occupations (except farmers) (6.6%); production occupations (5.4%)
Most popular occupations of females: healthcare practitioners and technical occupations (21.7%); service occupations (18.3%); education, training, and library occupations (17.5%); sales and office occupations (14.9%); business and financial operations occupations (8.3%); production occupations (6.4%); transportation occupations (5.3%)
Roads and streets: Stuart Cir; Poplar Hall Dr; Stuart Ct.
Waverly On Broad Creek neighborhood detailed profile
Area: 0.016 square miles
Population: 36
Population density:
| Waverly On Broad Creek: | 2,203 people per square mile |
| Norfolk: | 4,376 people per square mile |
Median household income in 2021:
| Waverly On Broad Creek: | $82,339 |
| Norfolk: | $58,591 |
Median rent in in 2021:
| Waverly On Broad Creek: | $1,103 |
| Norfolk: | $938 |
Male vs Females
| Males: | 19 |
| Females: | 16 |
Median age
| Males: | 41.7 years |
| Females: | 47.7 years |
Average estimated value of detached houses in 2021 (86.7% of all units):
| Waverly On Broad Creek: | $293,716 |
| Norfolk: | $306,640 |
Most popular occupations of males: service occupations (31.5%); material moving occupations (20.3%); computer and mathematical occupations (14.2%); sales and office occupations (8.7%); construction, extraction, and maintenance occupations (8.3%); management occupations (except farmers) (6.6%); production occupations (5.4%)
Most popular occupations of females: healthcare practitioners and technical occupations (21.7%); service occupations (18.3%); education, training, and library occupations (17.5%); sales and office occupations (14.9%); business and financial operations occupations (8.3%); production occupations (6.4%); transportation occupations (5.3%)
Roads and streets: Stuart Cir; Poplar Hall Dr; Stuart Ct.
Waverly On Broad Creek neighborhood detailed profile
West Ghent neighborhood in Norfolk statistics: (Find on map)
Area: 0.295 square miles
Population: 1,964
Population density:
Median household income in 2021:
Median rent in in 2021:
Male vs Females
Median age
Housing prices:
Average estimated value of detached houses in 2021 (38.4% of all units):
Average estimated '21 value of housing units in 5-or-more-unit structures (3.3% of all units):
Most popular occupations of males: healthcare practitioners and technical occupations (18.5%); management occupations (except farmers) (12.6%); education, training, and library occupations (9.8%); architecture and engineering occupations (8.8%); service occupations (8.8%); production occupations (7.9%); sales and office occupations (7.7%)
Most popular occupations of females: healthcare practitioners and technical occupations (40.3%); sales and office occupations (22.6%); education, training, and library occupations (12.3%); community and social services occupations (9.1%); service occupations (5.2%); management occupations (except farmers) (4.5%); arts, design, entertainment, sports, and media occupations (3.9%)
Highways in this neighborhood: Hampton Blvd (State Rte 337).
Roads and streets: Redgate Ave; Westover Ave; W Princess Anne Rd; Graydon Ave; Claremont Ave; Gates Ave; Armistead Bridge Rd; Spotswood Ave; Matoaka St; Brandon Ave; Old Brandon Ave; Graydon Pl; Leigh St; Langley Rd; Woodrow Ave; Mallory Ct; Baldwin Ave; Azalea Ct; Weyanoke St; N Brandon Ave; Shirley Ave; Raleigh Ave; Harrington Ave; Orapax St; Leigh Ct; Greenway Ct; Brambleton Ave.
Railroad features: Norfolk Southern Rlwy.
West Ghent neighborhood detailed profile
Area: 0.295 square miles
Population: 1,964
Population density:
| West Ghent: | 6,667 people per square mile |
| Norfolk: | 4,376 people per square mile |
Median household income in 2021:
| West Ghent: | $63,624 |
| Norfolk: | $58,591 |
Median rent in in 2021:
| West Ghent: | $1,094 |
| Norfolk: | $938 |
Male vs Females
| Males: | 1,015 |
| Females: | 948 |
Median age
| Males: | 29.0 years |
| Females: | 29.1 years |
Housing prices:
Average estimated value of detached houses in 2021 (38.4% of all units):
| West Ghent: | $193,196 |
| Norfolk: | $306,640 |
Average estimated '21 value of housing units in 5-or-more-unit structures (3.3% of all units):
| West Ghent: | $212,692 |
| Norfolk: | $260,910 |
Most popular occupations of males: healthcare practitioners and technical occupations (18.5%); management occupations (except farmers) (12.6%); education, training, and library occupations (9.8%); architecture and engineering occupations (8.8%); service occupations (8.8%); production occupations (7.9%); sales and office occupations (7.7%)
Most popular occupations of females: healthcare practitioners and technical occupations (40.3%); sales and office occupations (22.6%); education, training, and library occupations (12.3%); community and social services occupations (9.1%); service occupations (5.2%); management occupations (except farmers) (4.5%); arts, design, entertainment, sports, and media occupations (3.9%)
Highways in this neighborhood: Hampton Blvd (State Rte 337).
Roads and streets: Redgate Ave; Westover Ave; W Princess Anne Rd; Graydon Ave; Claremont Ave; Gates Ave; Armistead Bridge Rd; Spotswood Ave; Matoaka St; Brandon Ave; Old Brandon Ave; Graydon Pl; Leigh St; Langley Rd; Woodrow Ave; Mallory Ct; Baldwin Ave; Azalea Ct; Weyanoke St; N Brandon Ave; Shirley Ave; Raleigh Ave; Harrington Ave; Orapax St; Leigh Ct; Greenway Ct; Brambleton Ave.
Railroad features: Norfolk Southern Rlwy.
West Ghent neighborhood detailed profile
West Ocean View neighborhood in Norfolk statistics: (Find on map)
Area: 0.636 square miles
Population: 4,704
Population density:
Median household income in 2021:
Median rent in in 2021:
Male vs Females
Median age
Housing prices:
Average estimated value of detached houses in 2021 (43.2% of all units):
Average estimated value of housing units in 2-unit structures in 2021 (20.3% of all units):
Average estimated '21 value of housing units in 5-or-more-unit structures (5.2% of all units):
Most popular occupations of males: construction, extraction, and maintenance occupations (22.5%); sales and office occupations (15.7%); service occupations (11.9%); production occupations (7.1%); material moving occupations (5.4%); computer and mathematical occupations (5.3%); business and financial operations occupations (5.2%)
Most popular occupations of females: sales and office occupations (35.9%); service occupations (14.4%); education, training, and library occupations (12.5%); business and financial operations occupations (8.1%); management occupations (except farmers) (7.1%); healthcare practitioners and technical occupations (5.9%); legal occupations (5.0%)
Limited-access highways (interstate or state) in this neighborhood: I- 64.
Highways in this neighborhood: State Rte 168 (Tidewater Dr); US Hwy 60 (W Ocean View Ave); US Hwy 460 (Granby St).
Roads and streets: First View St; Mason Creek Rd; Maple Ave; Hickory St; W Government Ave; Cherry St; Phillip Ave; W Balview Ave; Orange Ave; A View Ave; Marlow Ave; D View Ave; Peachtree St; Portview Ave; Atwood Ave; Buckman Ave; W Seaview Ave; Chelsea Ave; Dupre Ave; Osborne Rd; Duval St; Saint George Ave; Orleans St; Dulwich Cres; Capitol Ave; Belgrave Ave; Ridgewell Cir; Duffys Ln; Lafayette Ave; Ridgewell Ave; Statler St; Pine Tree Rd; Lakeside Dr; Coleman Ave; Bearden Rd.
West Ocean View neighborhood detailed profile
Area: 0.636 square miles
Population: 4,704
Population density:
| West Ocean View: | 7,400 people per square mile |
| Norfolk: | 4,376 people per square mile |
Median household income in 2021:
| West Ocean View: | $54,567 |
| Norfolk: | $58,591 |
Median rent in in 2021:
| West Ocean View: | $881 |
| Norfolk: | $938 |
Male vs Females
| Males: | 2,400 |
| Females: | 2,304 |
Median age
| Males: | 35.4 years |
| Females: | 36.2 years |
Housing prices:
Average estimated value of detached houses in 2021 (43.2% of all units):
| West Ocean View: | $261,197 |
| Norfolk: | $306,640 |
Average estimated value of housing units in 2-unit structures in 2021 (20.3% of all units):
| This neighborhood: | $164,857 |
| Norfolk: | $250,782 |
Average estimated '21 value of housing units in 5-or-more-unit structures (5.2% of all units):
| West Ocean View: | $209,862 |
| Norfolk: | $260,910 |
Most popular occupations of males: construction, extraction, and maintenance occupations (22.5%); sales and office occupations (15.7%); service occupations (11.9%); production occupations (7.1%); material moving occupations (5.4%); computer and mathematical occupations (5.3%); business and financial operations occupations (5.2%)
Most popular occupations of females: sales and office occupations (35.9%); service occupations (14.4%); education, training, and library occupations (12.5%); business and financial operations occupations (8.1%); management occupations (except farmers) (7.1%); healthcare practitioners and technical occupations (5.9%); legal occupations (5.0%)
Limited-access highways (interstate or state) in this neighborhood: I- 64.
Highways in this neighborhood: State Rte 168 (Tidewater Dr); US Hwy 60 (W Ocean View Ave); US Hwy 460 (Granby St).
Roads and streets: First View St; Mason Creek Rd; Maple Ave; Hickory St; W Government Ave; Cherry St; Phillip Ave; W Balview Ave; Orange Ave; A View Ave; Marlow Ave; D View Ave; Peachtree St; Portview Ave; Atwood Ave; Buckman Ave; W Seaview Ave; Chelsea Ave; Dupre Ave; Osborne Rd; Duval St; Saint George Ave; Orleans St; Dulwich Cres; Capitol Ave; Belgrave Ave; Ridgewell Cir; Duffys Ln; Lafayette Ave; Ridgewell Ave; Statler St; Pine Tree Rd; Lakeside Dr; Coleman Ave; Bearden Rd.
West Ocean View neighborhood detailed profile
Willoughby neighborhood in Norfolk statistics: (Find on map)
Area: 0.825 square miles
Population: 2,773
Population density:
Median household income in 2021:
Median rent in in 2021:
Male vs Females
Median age
Housing prices:
Average estimated value of detached houses in 2021 (20.4% of all units):
Average estimated '21 value of housing units in 5-or-more-unit structures (18.4% of all units):
Most popular occupations of males: construction, extraction, and maintenance occupations (19.1%); service occupations (15.4%); production occupations (14.7%); management occupations (except farmers) (12.9%); sales and office occupations (11.7%); material moving occupations (6.2%); arts, design, entertainment, sports, and media occupations (5.5%)
Most popular occupations of females: sales and office occupations (46.4%); service occupations (24.9%); healthcare practitioners and technical occupations (13.0%); management occupations (except farmers) (6.4%); life, physical, and social science occupations (2.8%); education, training, and library occupations (2.4%); community and social services occupations (1.8%)
Limited-access highways (interstate or state) in this neighborhood: I- 64.
Highways in this neighborhood: US Hwy 60 (W Ocean View Ave).
Roads and streets: Little Bay Ave; Bayville St; 15th View St; 13th View St; Staten St; Chela Ave; Toler Pl; 12th View St; 11th View St; 4th View St; 9th View St; Lea View Ave; Bayville Ct; 10th View St; 3rd View St; 8th View St; Salem St; Worth St; Le Clair St; Richview St; Hansford Pl; 14th View St; 6th View St; Rallston St; 7th View St.
Willoughby neighborhood detailed profile
Area: 0.825 square miles
Population: 2,773
Population density:
| Willoughby: | 3,361 people per square mile |
| Norfolk: | 4,376 people per square mile |
Median household income in 2021:
| Willoughby: | $60,758 |
| Norfolk: | $58,591 |
Median rent in in 2021:
| Willoughby: | $865 |
| Norfolk: | $938 |
Male vs Females
| Males: | 1,522 |
| Females: | 1,251 |
Median age
| Males: | 38.5 years |
| Females: | 44.1 years |
Housing prices:
Average estimated value of detached houses in 2021 (20.4% of all units):
| Willoughby: | $357,563 |
| Norfolk: | $306,640 |
Average estimated '21 value of housing units in 5-or-more-unit structures (18.4% of all units):
| Willoughby: | $209,862 |
| Norfolk: | $260,910 |
Most popular occupations of males: construction, extraction, and maintenance occupations (19.1%); service occupations (15.4%); production occupations (14.7%); management occupations (except farmers) (12.9%); sales and office occupations (11.7%); material moving occupations (6.2%); arts, design, entertainment, sports, and media occupations (5.5%)
Most popular occupations of females: sales and office occupations (46.4%); service occupations (24.9%); healthcare practitioners and technical occupations (13.0%); management occupations (except farmers) (6.4%); life, physical, and social science occupations (2.8%); education, training, and library occupations (2.4%); community and social services occupations (1.8%)
Limited-access highways (interstate or state) in this neighborhood: I- 64.
Highways in this neighborhood: US Hwy 60 (W Ocean View Ave).
Roads and streets: Little Bay Ave; Bayville St; 15th View St; 13th View St; Staten St; Chela Ave; Toler Pl; 12th View St; 11th View St; 4th View St; 9th View St; Lea View Ave; Bayville Ct; 10th View St; 3rd View St; 8th View St; Salem St; Worth St; Le Clair St; Richview St; Hansford Pl; 14th View St; 6th View St; Rallston St; 7th View St.
Willoughby neighborhood detailed profile
Willowwood neighborhood in Norfolk statistics: (Find on map)
Area: 0.526 square miles
Population: 1,014
Population density:
Median household income in 2021:
Median rent in in 2021:
Male vs Females
Median age
Average estimated value of detached houses in 2021 (61.1% of all units):
Most popular occupations of males: sales and office occupations (23.7%); management occupations (except farmers) (18.2%); service occupations (9.7%); material moving occupations (8.4%); computer and mathematical occupations (7.7%); healthcare practitioners and technical occupations (6.2%); community and social services occupations (5.9%)
Most popular occupations of females: healthcare practitioners and technical occupations (30.2%); education, training, and library occupations (22.9%); management occupations (except farmers) (18.2%); sales and office occupations (9.7%); business and financial operations occupations (6.6%); service occupations (5.2%); architecture and engineering occupations (1.2%)
Highways in this neighborhood: State Rte 168 (Tidewater Dr).
Roads and streets: Willowwood Dr; Norway Pl; Harmott Ave; Lakewood Dr; Bordeaux Pl; Veaux Loop S; Huntington Pl; Shenandoah Ave; Windsor Point Rd; Veaux Loop N; Sweet Briar Ave; Colmar Quarter; Emory Pl; Waylon Ave; Hadlock Ave; Coburn Cres; Montpellier Ct; Shaw Pl; Norway Ct; Pamela Pl; Rosso Ct; Blanch Dr; Boyce Dr; Boyce Ct; Shenandoah Ct; Miles End.
Willowwood neighborhood detailed profile
Area: 0.526 square miles
Population: 1,014
Population density:
| Willowwood (Lakewood): | 1,927 people per square mile |
| Norfolk: | 4,376 people per square mile |
Median household income in 2021:
| Willowwood (Lakewood): | $77,386 |
| Norfolk: | $58,591 |
Median rent in in 2021:
| Willowwood (Lakewood): | $265 |
| Norfolk: | $938 |
Male vs Females
| Males: | 508 |
| Females: | 505 |
Median age
| Males: | 40.1 years |
| Females: | 44.3 years |
Average estimated value of detached houses in 2021 (61.1% of all units):
| Willowwood (Lakewood): | $169,659 |
| Norfolk: | $306,640 |
Most popular occupations of males: sales and office occupations (23.7%); management occupations (except farmers) (18.2%); service occupations (9.7%); material moving occupations (8.4%); computer and mathematical occupations (7.7%); healthcare practitioners and technical occupations (6.2%); community and social services occupations (5.9%)
Most popular occupations of females: healthcare practitioners and technical occupations (30.2%); education, training, and library occupations (22.9%); management occupations (except farmers) (18.2%); sales and office occupations (9.7%); business and financial operations occupations (6.6%); service occupations (5.2%); architecture and engineering occupations (1.2%)
Highways in this neighborhood: State Rte 168 (Tidewater Dr).
Roads and streets: Willowwood Dr; Norway Pl; Harmott Ave; Lakewood Dr; Bordeaux Pl; Veaux Loop S; Huntington Pl; Shenandoah Ave; Windsor Point Rd; Veaux Loop N; Sweet Briar Ave; Colmar Quarter; Emory Pl; Waylon Ave; Hadlock Ave; Coburn Cres; Montpellier Ct; Shaw Pl; Norway Ct; Pamela Pl; Rosso Ct; Blanch Dr; Boyce Dr; Boyce Ct; Shenandoah Ct; Miles End.
Willowwood neighborhood detailed profile
Woodbine neighborhood in Norfolk statistics: (Find on map)
Area: 0.167 square miles
Population: 376
Population density:
Median household income in 2021:
Median rent in in 2021:
Male vs Females
Median age
Average estimated value of detached houses in 2021 (87.0% of all units):
Most popular occupations of males: service occupations (30.4%); material moving occupations (19.6%); computer and mathematical occupations (13.7%); sales and office occupations (9.0%); construction, extraction, and maintenance occupations (8.1%); management occupations (except farmers) (6.4%); arts, design, entertainment, sports, and media occupations (4.3%)
Most popular occupations of females: healthcare practitioners and technical occupations (20.4%); service occupations (18.9%); education, training, and library occupations (18.1%); sales and office occupations (15.5%); business and financial operations occupations (7.9%); production occupations (5.9%); transportation occupations (4.9%)
Highways in this neighborhood: S Military Hwy (US Hwy 13); US Hwy 13.
Roads and streets: Corporate Blvd; Woodbine Rd; Shorewood Dr; Levine Ct; Shorewood Ln.
Woodbine neighborhood detailed profile
Area: 0.167 square miles
Population: 376
Population density:
| Woodbine: | 2,252 people per square mile |
| Norfolk: | 4,376 people per square mile |
Median household income in 2021:
| Woodbine: | $88,621 |
| Norfolk: | $58,591 |
Median rent in in 2021:
| Woodbine: | $1,120 |
| Norfolk: | $938 |
Male vs Females
| Males: | 201 |
| Females: | 174 |
Median age
| Males: | 38.2 years |
| Females: | 41.3 years |
Average estimated value of detached houses in 2021 (87.0% of all units):
| Woodbine: | $293,716 |
| Norfolk: | $306,640 |
Most popular occupations of males: service occupations (30.4%); material moving occupations (19.6%); computer and mathematical occupations (13.7%); sales and office occupations (9.0%); construction, extraction, and maintenance occupations (8.1%); management occupations (except farmers) (6.4%); arts, design, entertainment, sports, and media occupations (4.3%)
Most popular occupations of females: healthcare practitioners and technical occupations (20.4%); service occupations (18.9%); education, training, and library occupations (18.1%); sales and office occupations (15.5%); business and financial operations occupations (7.9%); production occupations (5.9%); transportation occupations (4.9%)
Highways in this neighborhood: S Military Hwy (US Hwy 13); US Hwy 13.
Roads and streets: Corporate Blvd; Woodbine Rd; Shorewood Dr; Levine Ct; Shorewood Ln.
Woodbine neighborhood detailed profile
Young Terrace neighborhood in Norfolk statistics: (Find on map)
Area: 0.087 square miles
Population: 1,049
Population density:
Median household income in 2021:
Median rent in in 2021:
Male vs Females
Median age
Housing prices:
Average estimated value of detached houses in 2021 (2.8% of all units):
Average estimated value of townhouses or other attached units in 2021 (13.8% of all units):
Average estimated '21 value of housing units in 5-or-more-unit structures (6.4% of all units):
Most popular occupations of males: service occupations (73.0%); sales and office occupations (26.6%)
Most popular occupations of females: service occupations (48.4%); sales and office occupations (20.2%); healthcare practitioners and technical occupations (11.0%); production occupations (6.9%); community and social services occupations (2.4%); construction, extraction, and maintenance occupations (1.7%); material moving occupations (1.7%)
Highways in this neighborhood: US Hwy 58 (State Rte 337, E Brambleton Ave); US Hwy 58 (US Hwy 460, Church St).
Roads and streets: E Olney Rd; Nicholson St; Lincoln St; Whitaker Ln; Smith St; 5th St.
Young Terrace neighborhood detailed profile
Area: 0.087 square miles
Population: 1,049
Population density:
| Young Terrace: | 12,014 people per square mile |
| Norfolk: | 4,376 people per square mile |
Median household income in 2021:
| Young Terrace: | $73,923 |
| Norfolk: | $58,591 |
Median rent in in 2021:
| Young Terrace: | $319 |
| Norfolk: | $938 |
Male vs Females
| Males: | 321 |
| Females: | 728 |
Median age
| Males: | 27.7 years |
| Females: | 41.0 years |
Housing prices:
Average estimated value of detached houses in 2021 (2.8% of all units):
| Young Terrace: | $86,762 |
| Norfolk: | $306,640 |
Average estimated value of townhouses or other attached units in 2021 (13.8% of all units):
| This neighborhood: | $698,295 |
| city: | $267,013 |
Average estimated '21 value of housing units in 5-or-more-unit structures (6.4% of all units):
| Young Terrace: | $330,379 |
| Norfolk: | $260,910 |
Most popular occupations of males: service occupations (73.0%); sales and office occupations (26.6%)
Most popular occupations of females: service occupations (48.4%); sales and office occupations (20.2%); healthcare practitioners and technical occupations (11.0%); production occupations (6.9%); community and social services occupations (2.4%); construction, extraction, and maintenance occupations (1.7%); material moving occupations (1.7%)
Highways in this neighborhood: US Hwy 58 (State Rte 337, E Brambleton Ave); US Hwy 58 (US Hwy 460, Church St).
Roads and streets: E Olney Rd; Nicholson St; Lincoln St; Whitaker Ln; Smith St; 5th St.
Young Terrace neighborhood detailed profile