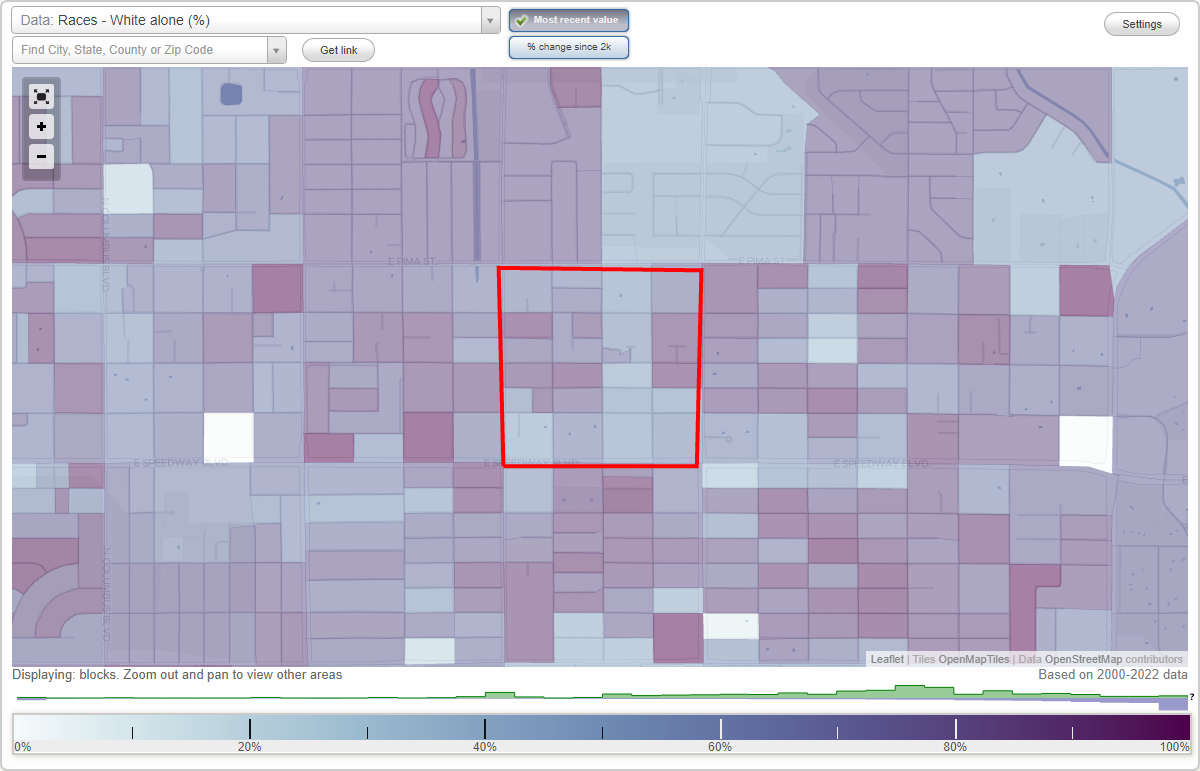
Avondale neighborhood in Tucson, Arizona (AZ), 85712 detailed profile
Settings
X

Business Search - 14 Million verified businesses
Area: 0.245 square miles
Population: 1,652
Population density:
| Avondale: | 6,731 people per square mile |
| Tucson: | 2,808 people per square mile |

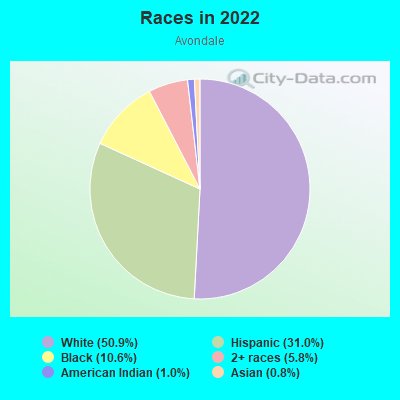
- 84650.9%White
- 51531.0%Hispanic or Latino
- 17610.6%Black
- 965.8%Two or more races
- 161.0%American Indian
- 140.8%Asian
Median household income in 2022:
| Avondale: | $29,753 |
| Tucson: | $51,281 |
Distribution of median household income
![Distribution of median household income]()
- 116Less than $10,000
- 317$10,000 to $19,999
- 131$20,000 to $29,999
- 151$30,000 to $39,999
- 57$40,000 to $49,999
- 41$50,000 to $59,999
- 43$60,000 to $74,999
- 105$75,000 to $99,999
- 21$100,000 to $124,999
- 11$125,000 to $149,999
- 12$150,000 to $199,999
- 13$200,000 or more

Distribution of owner-occupied house/condo value
![Distribution of owner-occupied house/condo value]()
- 12Less than $50,000
- 4$50,000 to $99,999
- 34$100,000 to $149,999
- 33$150,000 to $199,999
- 75$200,000 to $249,999
- 126$250,000 to $299,999
- 12$300,000 to $399,999
- 7$400,000 to $499,999
- 4$750,000 to $999,999

Distribution of rent paid by renters
![Distribution of rent paid by renters]()
- 52Less than $100
- 25$200 to $299
- 43$400 to $499
- 250$500 to $599
- 145$600 to $699
- 113$700 to $799
- 37$800 to $899
- 21$900 to $999
- 39$1,000 to $1,249
- 16$1,250 to $1,499
- 23$1,500 to $1,999
- 8$2,000 or more

Median rent in 2022:
| Avondale: | $596 |
| Tucson: | $912 |
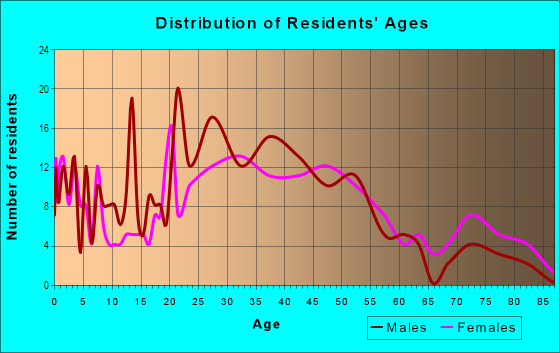
| Males: | 836 |
| Females: | 815 |
Males:
| This neighborhood: | 37.0 years |
| Whole city: | 33.1 years |
| This neighborhood: | 56.3 years |
| Whole city: | 34.8 years |
Average household size:
| Avondale: | 1.7 people |
| Tucson: | 2.3 people |
Percentage of family households:
| Avondale: | 20.8% |
| Tucson: | 37.6% |
| Here: | 11.5% |
| Tucson: | 31.5% |
Percentage of married-couple families with children (among all households):
| Avondale: | 8.8% |
| Tucson: | 24.4% |
Percentage of single-mother households (among all households):
| Avondale: | 44.6% |
| Tucson: | 12.1% |
Percentage of never married males 15 years old and over:
Percentage of never married females 15 years old and over:
| Avondale: | 28.6% |
| Tucson: | 24.8% |
Percentage of never married females 15 years old and over:
| Avondale: | 11.5% |
| city: | 20.6% |
Percentage of people that speak English not well or not at all:
| Avondale: | 1.5% |
| Tucson: | 4.5% |
Percentage of people born in this state:
Percentage of people born in another U.S. state:
Percentage of native residents but born outside the U.S.:
Percentage of foreign born residents:
| Here: | 41.7% |
| Tucson: | 46.2% |
Percentage of people born in another U.S. state:
| Avondale: | 52.2% |
| Tucson: | 38.2% |
Percentage of native residents but born outside the U.S.:
| Here: | 0.6% |
| city: | 1.8% |
Percentage of foreign born residents:
| Here: | 5.4% |
| Tucson: | 13.7% |
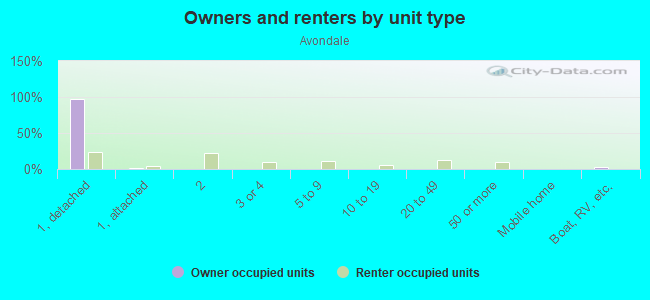
Owner-occupied
Renter-occupied

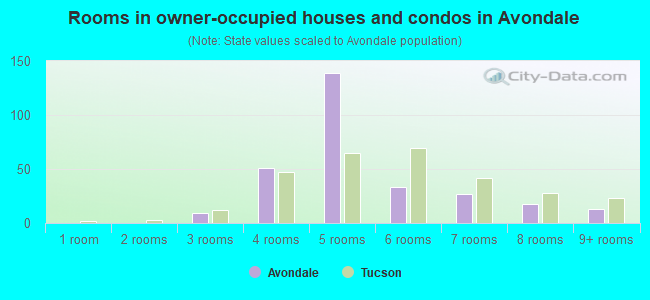
- Rooms in owner-occupied houses and condos in Avondale
- 01 room
- 02 rooms
- 93 rooms
- 514 rooms
- 1395 rooms
- 336 rooms
- 277 rooms
- 188 rooms
- 139+ rooms
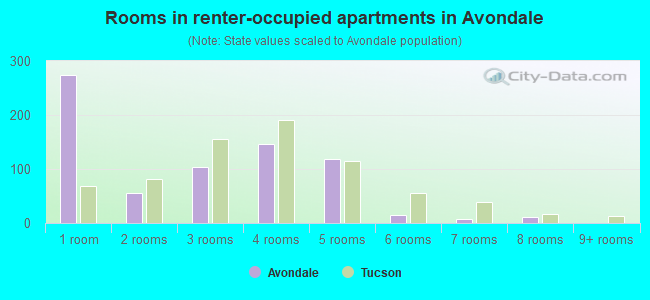
- Rooms in renter-occupied apartments in Avondale
- 2751 room
- 562 rooms
- 1043 rooms
- 1464 rooms
- 1195 rooms
- 146 rooms
- 77 rooms
- 128 rooms
- 09+ rooms
Owner-occupied
Renter-occupied
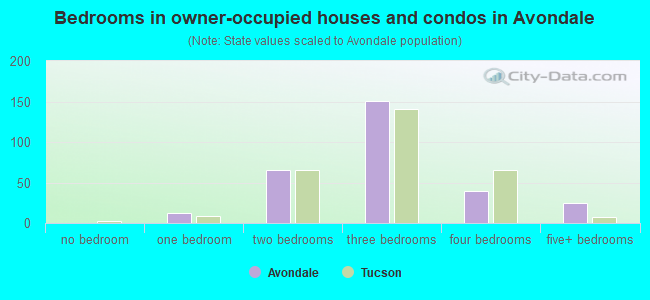
- Bedrooms in owner-occupied houses and condos in Avondale
- 0no bedroom
- 121 bedroom
- 652 bedrooms
- 1513 bedrooms
- 394 bedrooms
- 255+ bedrooms
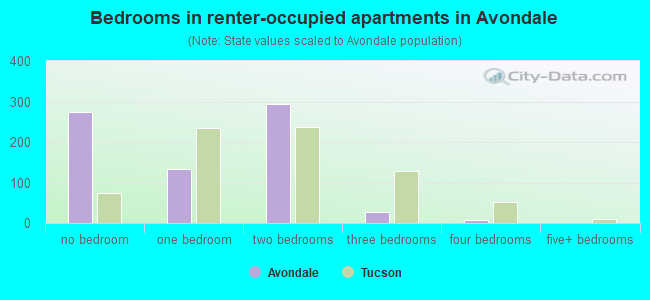
- Bedrooms in renter-occupied apartments in Avondale
- 275no bedroom
- 1331 bedroom
- 2932 bedrooms
- 263 bedrooms
- 74 bedrooms
- 05+ bedrooms
Average number of cars or other vehicles available in houses/condos:
Average number of cars or other vehicles available in apartments:
| This neighborhood: | 1.6 |
| Tucson: | 1.9 |
Average number of cars or other vehicles available in apartments:
| Here: | 0.8 |
| city: | 1.3 |
Percentage of units with a mortgage:
| Avondale: | 41.3% |
| Tucson: | 59.8% |
Average estimated value of detached houses in 2022 (44.5% of all units):
| Avondale: | $229,796 |
| Tucson: | $308,227 |
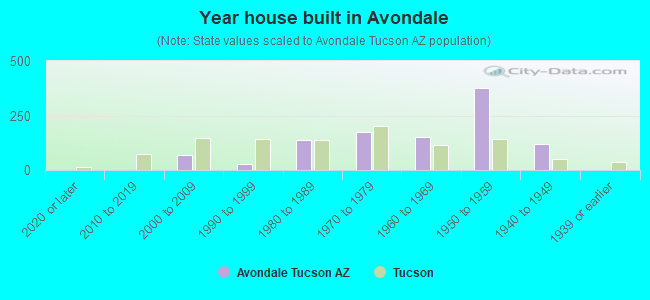
- Year house built in Avondale
- 02020 or later
- 02010 to 2019
- 682000 to 2009
- 281990 to 1999
- 1361980 to 1989
- 1731970 to 1979
- 1531960 to 1969
- 3771950 to 1959
- 1191940 to 1949
- 01939 or earlier
City-data.com crime index for city in 2020 (higher means more crime):
| City: | 397.7 |
| U.S. average: | 219.5 |
Travel time to work (commute)
![Travel time to work (commute)]()
- 29Less than 5 minutes
- 625 to 9 minutes
- 8810 to 14 minutes
- 11015 to 19 minutes
- 10320 to 24 minutes
- 2925 to 29 minutes
- 3230 to 34 minutes
- 1735 to 39 minutes
- 1440 to 44 minutes
- 2045 to 59 minutes
- 1260 to 89 minutes

Means of transportation to work
![Means of transportation to work]()
- 61.0%405Drove a car alone
- 6.0%40Carpooled
- 6.0%40Bus
- 13.7%91Motorcycle
- 0.5%3Bicycle
- 3.0%20Walked
- 13.3%88Worked at home

Time leaving home to go to work
![Time leaving home to go to work]()
- 1912:00 a.m. to 4:59 a.m.
- 155:00 a.m. to 5:29 a.m.
- 45:30 a.m. to 5:59 a.m.
- 166:00 a.m. to 6:29 a.m.
- 386:30 a.m. to 6:59 a.m.
- 707:00 a.m. to 7:29 a.m.
- 517:30 a.m. to 7:59 a.m.
- 618:00 a.m. to 8:29 a.m.
- 478:30 a.m. to 8:59 a.m.
- 559:00 a.m. to 9:59 a.m.
- 1910:00 a.m. to 10:59 a.m.
- 2211:00 a.m. to 11:59 a.m.
- 4312:00 p.m. to 3:59 p.m.
- 404:00 p.m. to 11:59 p.m.

Occupations of males:
- Percentage of males in management occupations (except farmers):
Here: 4.3% city: 7.7%
- Percentage of males in architecture and engineering occupations:
Here: 23.1% city: 4.0%
- Percentage of males in education, training, and library occupations:
Here: 6.5% city: 4.7%
- Percentage of males in arts, design, entertainment, sports, and media occupations:
Here: 5.8% city: 1.6%
- Percentage of males in service occupations:
Here: 14.2% city: 20.4%
- Percentage of males in sales and office occupations:
Here: 23.5% city: 16.2%
- Percentage of males in construction, extraction, and maintenance occupations:
Here: 2.2% city: 10.5%
- Percentage of males in production occupations:
Here: 20.2% city: 5.2%
- Percentage of males in material moving occupations:
Here: 4.0% city: 5.3%
Occupations of females:
- Percentage of females in management occupations (except farmers):
Here: 2.1% city: 8.2%
- Percentage of females in business and financial operations occupations:
Here: 12.0% city: 4.7%
- Percentage of females in computer and mathematical occupations:
Here: 19.5% city: 1.6%
- Percentage of females in community and social services occupations:
Here: 2.9% city: 2.9%
- Percentage of females in education, training, and library occupations:
Here: 3.4% city: 8.8%
- Percentage of females in arts, design, entertainment, sports, and media occupations:
Here: 1.2% city: 2.6%
- Percentage of females in healthcare practitioners and technical occupations:
Here: 11.2% city: 8.3%
- Percentage of females in service occupations:
Here: 12.6% city: 24.9%
- Percentage of females in sales and office occupations:
Here: 49.0% city: 29.9%
- Percentage of females in transportation occupations:
Here: 6.8% city: 1.0%
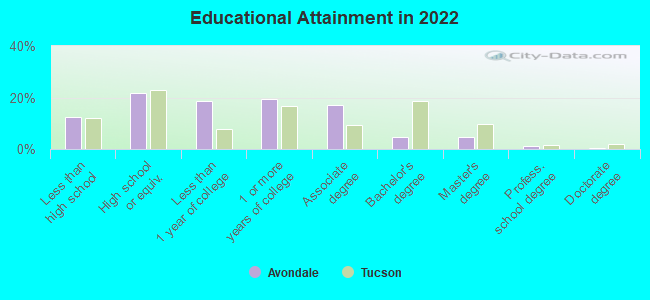
Education in this neighborhood (subdivision or community):
- Percentage of people 3 years and older in K-12 schools:
Avondale: 17.0% Tucson: 15.1%
- Percentage of people 3 years and older in undergraduate colleges:
Avondale: 4.9% Tucson: 9.7%
- Percentage of people 3 years and older in grad. or professional schools:
Avondale: 0.5% Tucson: 2.1%
- Percentage of students K-12 enrolled in private schools:
Avondale: 8.2% Tucson: 9.2%
Percentage of population below poverty level:
| Avondale: | 21.7% |
| Tucson: | 19.2% |
Median year owner moved in (as recorded in 2022):
Median year renter moved in (as recorded in 2022):
| Avondale: | 2006 |
| Tucson: | 2012 |
Median year renter moved in (as recorded in 2022):
| Avondale: | 2015 |
| Tucson: | 2020 |
Percentage of married-couple families with both working:
| Avondale: | 134.7% |
| Tucson: | 63.0% |
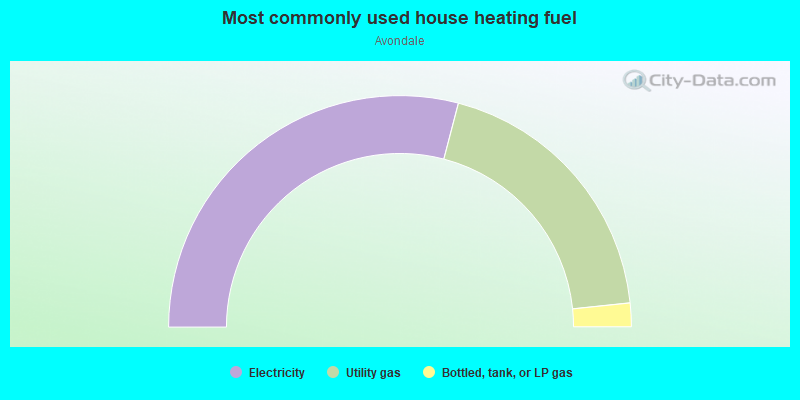
- 58.2%Electricity
- 38.6%Utility gas
- 3.3%Bottled, tank, or LP gas
Roads and streets:
E Lee St
Length: 0.59 miles
Direction: E-W
Address range: 5100 to 5499
Direction: E-W
Address range: 5100 to 5499
E Bellevue St
Length: 0.46 miles
Direction: E-W
Address range: 5119 to 5431
Direction: E-W
Address range: 5119 to 5431
N Magnolia Ave
Length: 0.44 miles
Direction: N-S
Address range: 1100 to 1635
Direction: N-S
Address range: 1100 to 1635
N Beverly Ave
Length: 0.44 miles
Direction: N-S
Address range: 1100 to 1626
Direction: N-S
Address range: 1100 to 1626
E Willard St
Length: 0.40 miles
Direction: E-W
Address range: 5100 to 5399
Direction: E-W
Address range: 5100 to 5399
N Woodland Ave
Length: 0.37 miles
Direction: N-S
Address range: 1100 to 1599
Direction: N-S
Address range: 1100 to 1599
E Fairmount St
Length: 0.37 miles
Direction: E-W
Address range: 5200 to 5426
Direction: E-W
Address range: 5200 to 5426
E Speedway Blvd
Length: 0.29 miles
Direction: E-W
Address range: 5200 to 5399
Direction: E-W
Address range: 5200 to 5399
E Elida St
Length: 0.15 miles
Direction: E-W
Direction: E-W
E Beverly Fair Dr
Length: 0.11 miles
Directions: E-W, N-S, SE-NW
Address range: 5300 to 5326
Directions: E-W, N-S, SE-NW
Address range: 5300 to 5326
N Cloverland Ave
Length: 0.09 miles
Directions: N-S, SE-NW
Address range: 1400 to 1599
Directions: N-S, SE-NW
Address range: 1400 to 1599
N Fairmount Pl
Length: 0.09 miles
Directions: E-W, N-S
Address range: 1400 to 1499
Directions: E-W, N-S
Address range: 1400 to 1499
N Remington Pl
Length: 0.09 miles
Directions: E-W, SE-NW
Address range: 1452 to 1498
Directions: E-W, SE-NW
Address range: 1452 to 1498
E Camden St
Length: 0.08 miles
Direction: E-W
Address range: 5224 to 5299
Direction: E-W
Address range: 5224 to 5299
N Sherry Ave
Length: 0.06 miles
Direction: N-S
Address range: 1200 to 1299
Direction: N-S
Address range: 1200 to 1299
Pla Figueroa
Length: 0.06 miles
Direction: N-S
Direction: N-S
N Sarah Pl
Length: 0.03 miles
Direction: N-S
Address range: 1600 to 1699
Direction: N-S
Address range: 1600 to 1699