Balboa Park neighborhood in San Francisco, California (CA), 94112 detailed profile
Settings
X


Business Search - 14 Million verified businesses
Area: 0.048 square miles
Population: 817
Population density:
| Balboa Park: | 16,991 people per square mile |
| San Francisco: | 17,313 people per square mile |

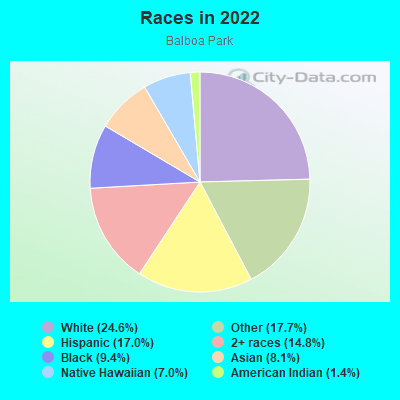
- 62576.6%Asian
- 10813.2%Hispanic or Latino
- 455.5%Native Hawaiian and Other
Pacific Islander - 212.6%White
- 151.8%Two or more races
- 20.2%Black
Median household income in 2022:
| Balboa Park: | $120,000 |
| San Francisco: | $136,692 |
Distribution of median household income
![Distribution of median household income]()
- 4Less than $10,000
- 9$10,000 to $19,999
- 10$20,000 to $29,999
- 43$30,000 to $39,999
- 6$40,000 to $49,999
- 15$50,000 to $59,999
- 3$60,000 to $74,999
- 25$75,000 to $99,999
- 9$100,000 to $124,999
- 25$125,000 to $149,999
- 33$150,000 to $199,999
- 46$200,000 or more

Distribution of owner-occupied house/condo value
![Distribution of owner-occupied house/condo value]()
- 4Less than $50,000
- 4$100,000 to $149,999
- 4$300,000 to $399,999
- 13$400,000 to $499,999
- 4$500,000 to $749,999
- 49$750,000 to $999,999
- 64$1,000,000 or more

Distribution of rent paid by renters
![Distribution of rent paid by renters]()
- 3$700 to $799
- 3$800 to $899
- 29$900 to $999
- 21$1,000 to $1,249
- 15$1,250 to $1,499
- 8$1,500 to $1,999
- 8$2,000 or more

Median rent in 2022:
| Balboa Park: | $1,063 |
| San Francisco: | $2,001 |
| Males: | 390 |
| Females: | 427 |
Males:
| This neighborhood: | 43.3 years |
| Whole city: | 40.3 years |
| This neighborhood: | 53.2 years |
| Whole city: | 40.5 years |
Average household size:
| Balboa Park: | 4.0 people |
| San Francisco: | 2.2 people |
Percentage of family households:
| Balboa Park: | 25.1% |
| San Francisco: | 30.3% |
| Here: | 33.1% |
| San Francisco: | 35.3% |
Percentage of married-couple families with children (among all households):
| Balboa Park: | 25.0% |
| San Francisco: | 35.9% |
Percentage of single-mother households (among all households):
| Balboa Park: | 3.5% |
| San Francisco: | 6.0% |
Percentage of never married males 15 years old and over:
Percentage of never married females 15 years old and over:
| Balboa Park: | 22.1% |
| San Francisco: | 24.6% |
Percentage of never married females 15 years old and over:
| Balboa Park: | 15.8% |
| city: | 19.9% |
Percentage of people that speak English not well or not at all:
| Balboa Park: | 16.7% |
| San Francisco: | 10.9% |
Percentage of people born in this state:
Percentage of people born in another U.S. state:
Percentage of native residents but born outside the U.S.:
Percentage of foreign born residents:
| Here: | 36.9% |
| San Francisco: | 40.8% |
Percentage of people born in another U.S. state:
| Balboa Park: | 4.5% |
| San Francisco: | 23.4% |
Percentage of native residents but born outside the U.S.:
| Here: | 3.3% |
| city: | 2.6% |
Percentage of foreign born residents:
| Here: | 55.3% |
| San Francisco: | 33.2% |
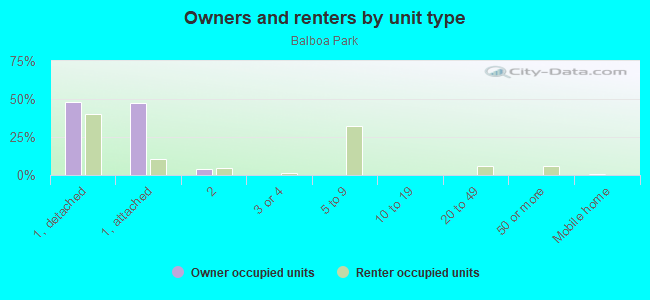
Owner-occupied
Renter-occupied

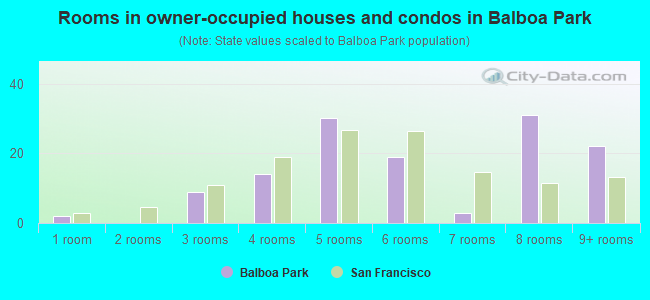
- Rooms in owner-occupied houses and condos in Balboa Park
- 21 room
- 02 rooms
- 93 rooms
- 144 rooms
- 305 rooms
- 196 rooms
- 37 rooms
- 318 rooms
- 229+ rooms
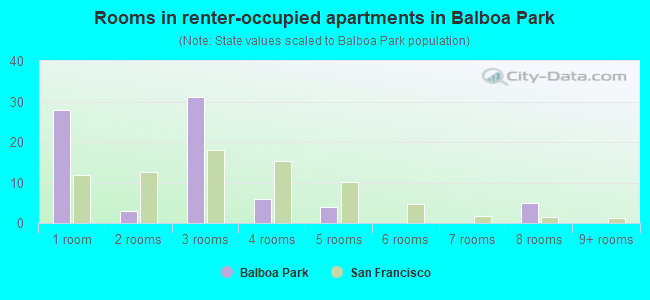
- Rooms in renter-occupied apartments in Balboa Park
- 281 room
- 32 rooms
- 313 rooms
- 64 rooms
- 45 rooms
- 06 rooms
- 07 rooms
- 58 rooms
- 09+ rooms
Owner-occupied
Renter-occupied
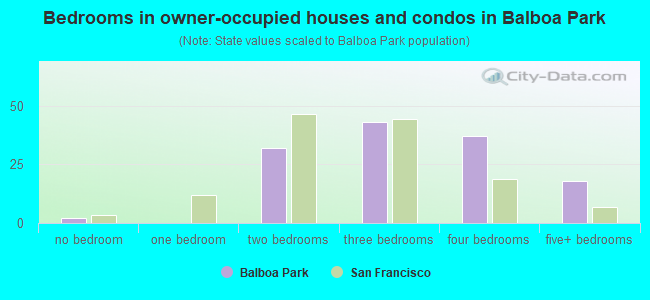
- Bedrooms in owner-occupied houses and condos in Balboa Park
- 2no bedroom
- 01 bedroom
- 322 bedrooms
- 433 bedrooms
- 374 bedrooms
- 185+ bedrooms
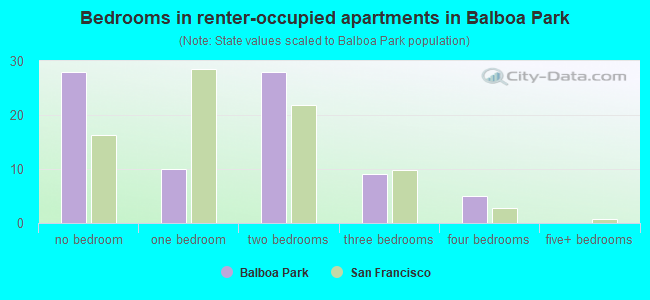
- Bedrooms in renter-occupied apartments in Balboa Park
- 28no bedroom
- 101 bedroom
- 282 bedrooms
- 93 bedrooms
- 54 bedrooms
- 05+ bedrooms
Average number of cars or other vehicles available in houses/condos:
Average number of cars or other vehicles available in apartments:
| This neighborhood: | 2.1 |
| San Francisco: | 1.5 |
Average number of cars or other vehicles available in apartments:
| Here: | 1.6 |
| city: | 0.8 |
Percentage of units with a mortgage:
| Balboa Park: | 54.3% |
| San Francisco: | 62.3% |
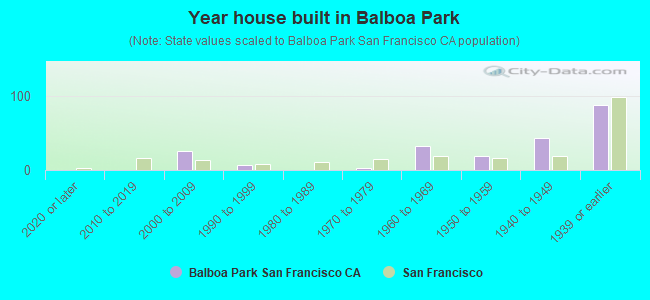
- Year house built in Balboa Park
- 02020 or later
- 02010 to 2019
- 252000 to 2009
- 71990 to 1999
- 01980 to 1989
- 31970 to 1979
- 331960 to 1969
- 191950 to 1959
- 431940 to 1949
- 871939 or earlier
City-data.com crime index for city in 2020 (higher means more crime):
| City: | 387.4 |
| U.S. average: | 219.5 |
Travel time to work (commute)
![Travel time to work (commute)]()
- 7Less than 5 minutes
- 910 to 14 minutes
- 1615 to 19 minutes
- 4320 to 24 minutes
- 1325 to 29 minutes
- 7430 to 34 minutes
- 535 to 39 minutes
- 2040 to 44 minutes
- 2945 to 59 minutes
- 3260 to 89 minutes
- 1190 or more minutes

Means of transportation to work
![Means of transportation to work]()
- 56.0%224Drove a car alone
- 7.5%30Carpooled
- 14.0%56Bus
- 9.0%36Subway or elevated rail
- 1.2%5Light rail, streetcar or trolley
- 0.5%2Motorcycle
- 2.5%10Bicycle
- 1.2%5Walked
- 1.5%6Other means
- 10.2%41Worked at home

Time leaving home to go to work
![Time leaving home to go to work]()
- 1212:00 a.m. to 4:59 a.m.
- 35:00 a.m. to 5:29 a.m.
- 115:30 a.m. to 5:59 a.m.
- 236:00 a.m. to 6:29 a.m.
- 116:30 a.m. to 6:59 a.m.
- 207:00 a.m. to 7:29 a.m.
- 217:30 a.m. to 7:59 a.m.
- 388:00 a.m. to 8:29 a.m.
- 478:30 a.m. to 8:59 a.m.
- 309:00 a.m. to 9:59 a.m.
- 810:00 a.m. to 10:59 a.m.
- 311:00 a.m. to 11:59 a.m.
- 3012:00 p.m. to 3:59 p.m.
- 124:00 p.m. to 11:59 p.m.

Occupations of males:
- Percentage of males in management occupations (except farmers):
Here: 8.6% city: 17.2%
- Percentage of males in business and financial operations occupations:
Here: 2.8% city: 8.9%
- Percentage of males in computer and mathematical occupations:
Here: 3.4% city: 14.6%
- Percentage of males in architecture and engineering occupations:
Here: 2.5% city: 4.0%
- Percentage of males in community and social services occupations:
Here: 5.5% city: 1.0%
- Percentage of males in education, training, and library occupations:
Here: 12.6% city: 3.4%
- Percentage of males in arts, design, entertainment, sports, and media occupations:
Here: 2.6% city: 4.9%
- Percentage of males in service occupations:
Here: 30.9% city: 11.8%
- Percentage of males in sales and office occupations:
Here: 11.8% city: 13.5%
- Percentage of males in construction, extraction, and maintenance occupations:
Here: 11.2% city: 3.1%
- Percentage of males in production occupations:
Here: 4.4% city: 2.5%
- Percentage of males in transportation occupations:
Here: 7.6% city: 3.4%
- Percentage of males in material moving occupations:
Here: 1.7% city: 1.8%
Occupations of females:
- Percentage of females in management occupations (except farmers):
Here: 8.4% city: 15.8%
- Percentage of females in business and financial operations occupations:
Here: 9.3% city: 11.5%
- Percentage of females in community and social services occupations:
Here: 11.5% city: 1.6%
- Percentage of females in education, training, and library occupations:
Here: 3.2% city: 7.1%
- Percentage of females in healthcare practitioners and technical occupations:
Here: 2.0% city: 8.4%
- Percentage of females in service occupations:
Here: 19.9% city: 15.4%
- Percentage of females in sales and office occupations:
Here: 28.7% city: 19.3%
- Percentage of females in production occupations:
Here: 15.2% city: 1.5%
- Percentage of females in material moving occupations:
Here: 1.7% city: 0.8%
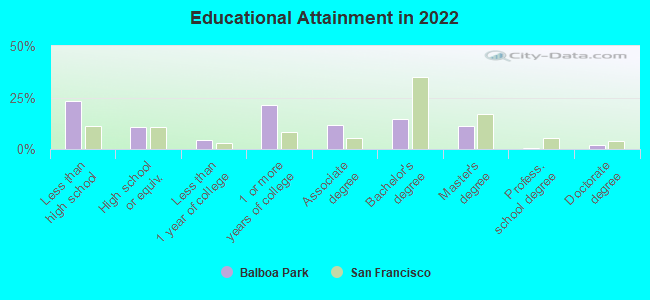
Education in this neighborhood (subdivision or community):
- Percentage of people 3 years and older in K-12 schools:
Balboa Park: 13.2% San Francisco: 9.7%
- Percentage of people 3 years and older in undergraduate colleges:
Balboa Park: 5.3% San Francisco: 4.8%
- Percentage of people 3 years and older in grad. or professional schools:
Balboa Park: 3.2% San Francisco: 2.6%
- Percentage of students K-12 enrolled in private schools:
Balboa Park: 39.4% San Francisco: 36.5%
Percentage of population below poverty level:
| Balboa Park: | 10.2% |
| San Francisco: | 10.4% |
Median year owner moved in (as recorded in 2022):
Median year renter moved in (as recorded in 2022):
| Balboa Park: | 2005 |
| San Francisco: | 2007 |
Median year renter moved in (as recorded in 2022):
| Balboa Park: | 2017 |
| San Francisco: | 2019 |
Percentage of married-couple families with both working:
| Balboa Park: | 98.5% |
| San Francisco: | 75.9% |
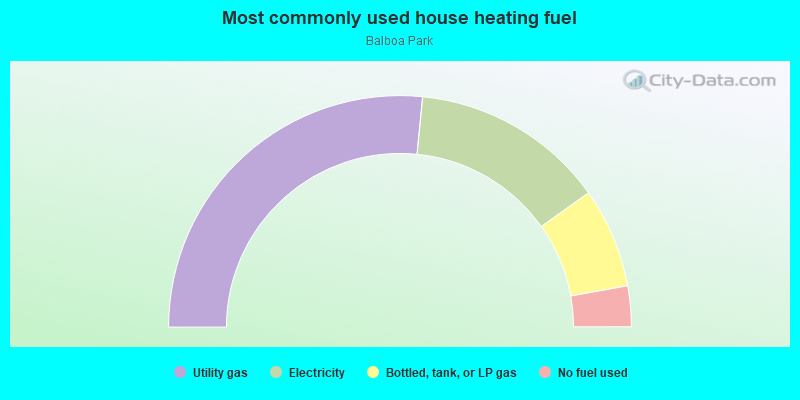
- 53.2%Utility gas
- 27.2%Electricity
- 14.0%Bottled, tank, or LP gas
- 5.7%No fuel used
Roads and streets:
San Jose Ave
Length: 0.25 miles
Direction: SW-NE
Address range: 1961 to 2099
Direction: SW-NE
Address range: 1961 to 2099
Sergeant John V Young St
Length: 0.22 miles
Direction: E-W
Direction: E-W
Sgt John V Young Ln
Length: 0.11 miles
Direction: E-W
Address range: 1 to 99
Direction: E-W
Address range: 1 to 99
Arco Way
Length: 0.01 miles
Direction: SW-NE
Address range: 792 to 799
Direction: SW-NE
Address range: 792 to 799