Beverly Hills neighborhood in Dallas, Texas (TX), 75211 detailed profile
Settings
X


Business Search - 14 Million verified businesses
Area: 0.193 square miles
Population: 1,779
Population density:
| Beverly Hills: | 9,196 people per square mile |
| Dallas: | 3,794 people per square mile |

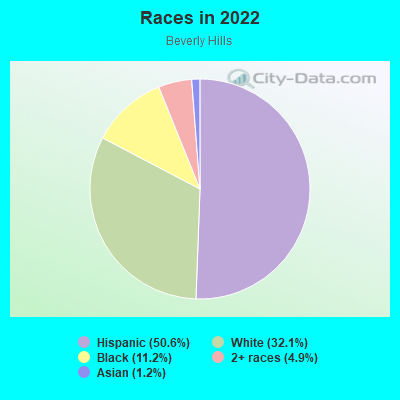
- 90150.6%Hispanic or Latino
- 57232.1%White
- 19911.2%Black
- 884.9%Two or more races
- 211.2%Asian
Median household income in 2022:
| Beverly Hills: | $75,207 |
| Dallas: | $65,400 |
Distribution of median household income
![Distribution of median household income]()
- 67Less than $10,000
- 59$10,000 to $19,999
- 59$20,000 to $29,999
- 29$30,000 to $39,999
- 86$40,000 to $49,999
- 128$50,000 to $59,999
- 57$60,000 to $74,999
- 40$75,000 to $99,999
- 62$100,000 to $124,999
- 64$125,000 to $149,999
- 55$150,000 to $199,999
- 163$200,000 or more

Distribution of owner-occupied house/condo value
![Distribution of owner-occupied house/condo value]()
- 4Less than $50,000
- 18$50,000 to $99,999
- 31$100,000 to $149,999
- 48$150,000 to $199,999
- 42$200,000 to $249,999
- 145$250,000 to $299,999
- 229$300,000 to $399,999
- 124$400,000 to $499,999
- 21$500,000 to $749,999
- 12$750,000 to $999,999
- 19$1,000,000 or more

Distribution of rent paid by renters
![Distribution of rent paid by renters]()
- 28$500 to $599
- 55$600 to $699
- 85$700 to $799
- 96$800 to $899
- 65$900 to $999
- 103$1,000 to $1,249
- 26$1,250 to $1,499
- 4$1,500 to $1,999
- 12$2,000 or more

Median rent in 2022:
| Beverly Hills: | $1,138 |
| Dallas: | $1,208 |
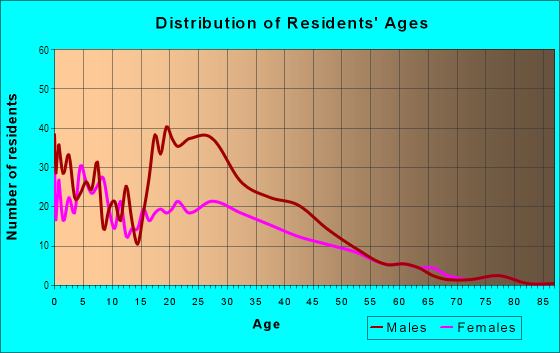
| Males: | 961 |
| Females: | 817 |
Males:
| This neighborhood: | 35.5 years |
| Whole city: | 32.8 years |
| This neighborhood: | 32.0 years |
| Whole city: | 33.4 years |
Average household size:
| Beverly Hills: | 3.0 people |
| Dallas: | 2.4 people |
Percentage of family households:
| Beverly Hills: | 44.5% |
| Dallas: | 42.6% |
| Here: | 57.5% |
| Dallas: | 33.8% |
Percentage of married-couple families with children (among all households):
| Beverly Hills: | 40.2% |
| Dallas: | 24.8% |
Percentage of single-mother households (among all households):
| Beverly Hills: | 61.0% |
| Dallas: | 13.3% |
Percentage of never married males 15 years old and over:
Percentage of never married females 15 years old and over:
| Beverly Hills: | 15.3% |
| Dallas: | 22.1% |
Percentage of never married females 15 years old and over:
| Beverly Hills: | 14.5% |
| city: | 21.8% |
Percentage of people that speak English not well or not at all:
| Beverly Hills: | 12.8% |
| Dallas: | 10.7% |
Percentage of people born in this state:
Percentage of people born in another U.S. state:
Percentage of native residents but born outside the U.S.:
Percentage of foreign born residents:
| Here: | 58.7% |
| Dallas: | 52.8% |
Percentage of people born in another U.S. state:
| Beverly Hills: | 9.6% |
| Dallas: | 22.0% |
Percentage of native residents but born outside the U.S.:
| Here: | 0.9% |
| city: | 1.3% |
Percentage of foreign born residents:
| Here: | 30.9% |
| Dallas: | 23.9% |
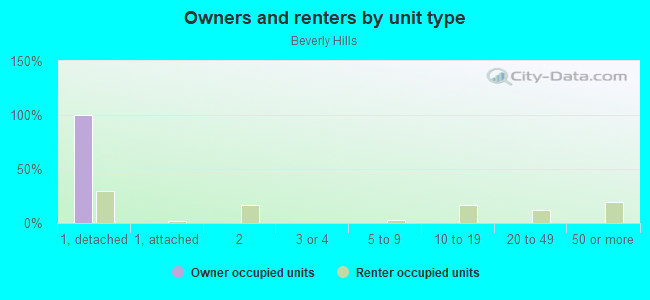
Owner-occupied
Renter-occupied

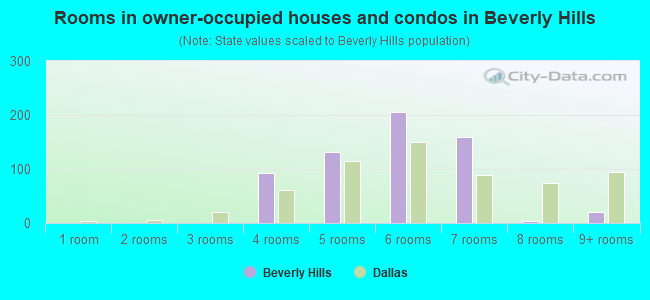
- Rooms in owner-occupied houses and condos in Beverly Hills
- 01 room
- 02 rooms
- 03 rooms
- 924 rooms
- 1315 rooms
- 2056 rooms
- 1607 rooms
- 38 rooms
- 219+ rooms
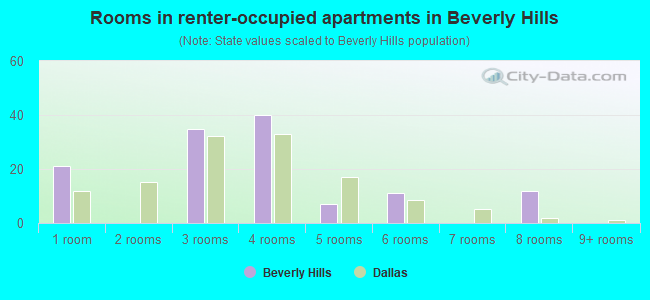
- Rooms in renter-occupied apartments in Beverly Hills
- 211 room
- 02 rooms
- 353 rooms
- 404 rooms
- 75 rooms
- 116 rooms
- 07 rooms
- 128 rooms
- 09+ rooms
Owner-occupied
Renter-occupied
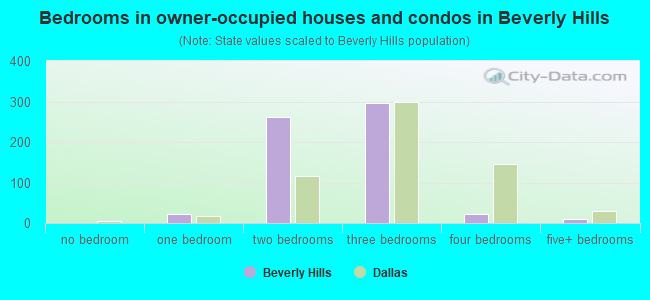
- Bedrooms in owner-occupied houses and condos in Beverly Hills
- 0no bedroom
- 221 bedroom
- 2612 bedrooms
- 2973 bedrooms
- 214 bedrooms
- 115+ bedrooms
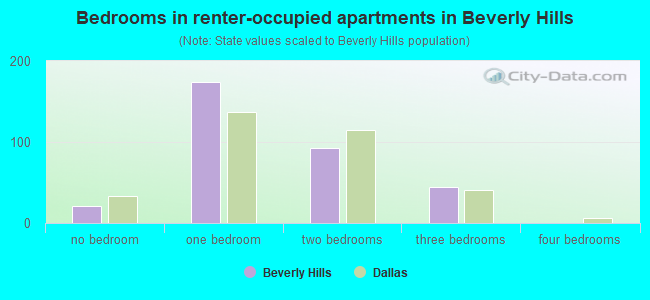
- Bedrooms in renter-occupied apartments in Beverly Hills
- 21no bedroom
- 1741 bedroom
- 922 bedrooms
- 453 bedrooms
- 04 bedrooms
- 05+ bedrooms
Average number of cars or other vehicles available in houses/condos:
Average number of cars or other vehicles available in apartments:
| This neighborhood: | 2.0 |
| Dallas: | 2.1 |
Average number of cars or other vehicles available in apartments:
| Here: | 1.5 |
| city: | 1.3 |
Percentage of units with a mortgage:
| Beverly Hills: | 66.1% |
| Dallas: | 53.9% |
Average estimated value of detached houses in 2022 (92.4% of all units):
| Beverly Hills: | $333,545 |
| Dallas: | $423,859 |
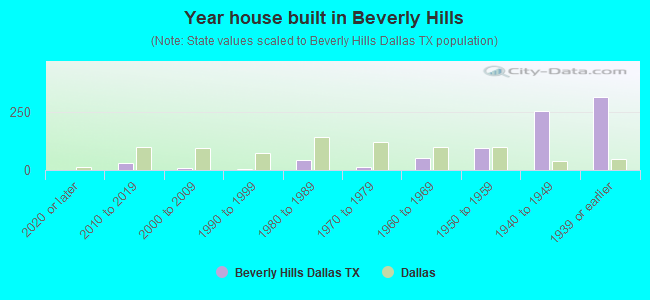
- Year house built in Beverly Hills
- 02020 or later
- 322010 to 2019
- 72000 to 2009
- 61990 to 1999
- 451980 to 1989
- 131970 to 1979
- 521960 to 1969
- 971950 to 1959
- 2571940 to 1949
- 3141939 or earlier
City-data.com crime index for city in 2020 (higher means more crime):
| City: | 439.5 |
| U.S. average: | 219.5 |
Travel time to work (commute)
![Travel time to work (commute)]()
- 825 to 9 minutes
- 19010 to 14 minutes
- 17015 to 19 minutes
- 25120 to 24 minutes
- 3825 to 29 minutes
- 16830 to 34 minutes
- 1535 to 39 minutes
- 2440 to 44 minutes
- 13945 to 59 minutes
- 4460 to 89 minutes
- 290 or more minutes

Means of transportation to work
![Means of transportation to work]()
- 69.9%647Drove a car alone
- 0.9%8Carpooled
- 0.6%6Walked
- 18.5%171Other means
- 10.6%98Worked at home

Time leaving home to go to work
![Time leaving home to go to work]()
- 18312:00 a.m. to 4:59 a.m.
- 315:00 a.m. to 5:29 a.m.
- 155:30 a.m. to 5:59 a.m.
- 1106:00 a.m. to 6:29 a.m.
- 396:30 a.m. to 6:59 a.m.
- 1437:00 a.m. to 7:29 a.m.
- 807:30 a.m. to 7:59 a.m.
- 1268:00 a.m. to 8:29 a.m.
- 378:30 a.m. to 8:59 a.m.
- 629:00 a.m. to 9:59 a.m.
- 7910:00 a.m. to 10:59 a.m.
- 2011:00 a.m. to 11:59 a.m.
- 4512:00 p.m. to 3:59 p.m.
- 864:00 p.m. to 11:59 p.m.

Occupations of males:
- Percentage of males in management occupations (except farmers):
Here: 19.6% city: 10.9%
- Percentage of males in business and financial operations occupations:
Here: 14.3% city: 7.3%
- Percentage of males in computer and mathematical occupations:
Here: 10.1% city: 4.7%
- Percentage of males in legal occupations:
Here: 11.0% city: 1.8%
- Percentage of males in education, training, and library occupations:
Here: 11.9% city: 2.3%
- Percentage of males in arts, design, entertainment, sports, and media occupations:
Here: 1.2% city: 2.2%
- Percentage of males in healthcare practitioners and technical occupations:
Here: 1.7% city: 2.7%
- Percentage of males in service occupations:
Here: 1.9% city: 12.3%
- Percentage of males in sales and office occupations:
Here: 1.9% city: 14.9%
- Percentage of males in construction, extraction, and maintenance occupations:
Here: 12.1% city: 15.2%
- Percentage of males in production occupations:
Here: 7.2% city: 5.0%
- Percentage of males in material moving occupations:
Here: 6.9% city: 6.2%
Occupations of females:
- Percentage of females in management occupations (except farmers):
Here: 20.2% city: 9.6%
- Percentage of females in business and financial operations occupations:
Here: 11.6% city: 8.4%
- Percentage of females in computer and mathematical occupations:
Here: 2.3% city: 2.0%
- Percentage of females in community and social services occupations:
Here: 4.3% city: 1.8%
- Percentage of females in education, training, and library occupations:
Here: 9.5% city: 7.1%
- Percentage of females in arts, design, entertainment, sports, and media occupations:
Here: 13.3% city: 2.9%
- Percentage of females in healthcare practitioners and technical occupations:
Here: 12.6% city: 7.7%
- Percentage of females in service occupations:
Here: 9.6% city: 20.5%
- Percentage of females in sales and office occupations:
Here: 14.0% city: 27.7%
- Percentage of females in material moving occupations:
Here: 2.4% city: 3.2%
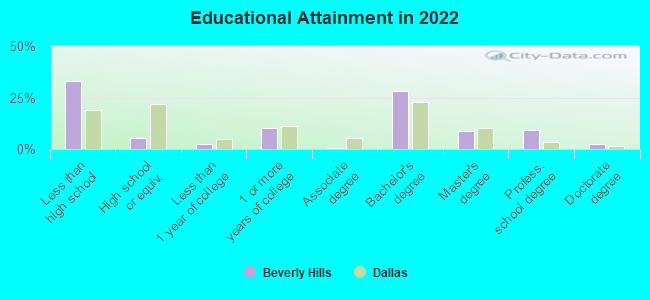
Education in this neighborhood (subdivision or community):
- Percentage of people 3 years and older in K-12 schools:
Beverly Hills: 21.5% Dallas: 17.3%
- Percentage of people 3 years and older in undergraduate colleges:
Beverly Hills: 3.3% Dallas: 4.1%
- Percentage of people 3 years and older in grad. or professional schools:
Beverly Hills: 2.4% Dallas: 1.7%
- Percentage of students K-12 enrolled in private schools:
Beverly Hills: 17.1% Dallas: 10.8%
Percentage of population below poverty level:
| Beverly Hills: | 21.5% |
| Dallas: | 17.8% |
Median year owner moved in (as recorded in 2022):
Median year renter moved in (as recorded in 2022):
| Beverly Hills: | 2005 |
| Dallas: | 2010 |
Median year renter moved in (as recorded in 2022):
| Beverly Hills: | 2016 |
| Dallas: | 2020 |
Percentage of married-couple families with both working:
| Beverly Hills: | 61.1% |
| Dallas: | 58.3% |
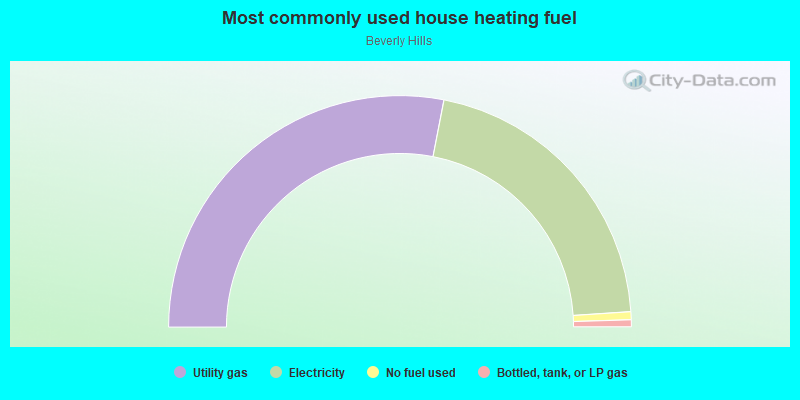
- 56.1%Utility gas
- 41.8%Electricity
- 1.1%No fuel used
- 1.0%Bottled, tank, or LP gas
Roads and streets:
W Jefferson Blvd
Length: 0.63 miles
Directions: E-W, SW-NE
Address range: 2764 to 3246
Directions: E-W, SW-NE
Address range: 2764 to 3246
W 9th St
Length: 0.63 miles
Direction: E-W
Address range: 2700 to 3299
Direction: E-W
Address range: 2700 to 3299
W 8th St
Length: 0.53 miles
Direction: E-W
Address range: 2800 to 3299
Direction: E-W
Address range: 2800 to 3299
Cliffdale Ave
Length: 0.26 miles
Directions: E-W, N-S, SW-NE
Address range: 100 to 499
Directions: E-W, N-S, SW-NE
Address range: 100 to 499
N Ravinia Dr
Length: 0.24 miles
Direction: N-S
Address range: 100 to 399
Direction: N-S
Address range: 100 to 399
N Barnett Ave
Length: 0.21 miles
Direction: N-S
Address range: 150 to 398
Direction: N-S
Address range: 150 to 398
N Westmoreland Rd
Length: 0.20 miles
Direction: N-S
Address range: 100 to 399
Direction: N-S
Address range: 100 to 399
N Jester Ave
Length: 0.19 miles
Direction: N-S
Address range: 100 to 399
Direction: N-S
Address range: 100 to 399
N Cavender St
Length: 0.11 miles
Direction: N-S
Address range: 400 to 499
Direction: N-S
Address range: 400 to 499
Hartsdale Dr
Length: 0.11 miles
Direction: N-S
Address range: 200 to 399
Direction: N-S
Address range: 200 to 399
S Westmoreland Rd
Length: 0.09 miles
Direction: N-S
Address range: 100 to 298
Direction: N-S
Address range: 100 to 298
Vale St
Length: 0.08 miles
Direction: SE-NW
Address range: 100 to 199
Direction: SE-NW
Address range: 100 to 199
S Jester Ave
Length: 0.06 miles
Direction: N-S
Address range: 100 to 199
Direction: N-S
Address range: 100 to 199
Tippah St
Length: 0.06 miles
Direction: E-W
Address range: 2700 to 2799
Direction: E-W
Address range: 2700 to 2799
Melba St
Length: 0.05 miles
Directions: E-W, SE-NW
Address range: 2800 to 2899
Directions: E-W, SE-NW
Address range: 2800 to 2899
Other features:
Coombs Crk
Length: 0.58 miles
Directions: E-W, N-S, SW-NE
Directions: E-W, N-S, SW-NE