Brush Glen neighborhood in San Jose, California (CA), 95133 detailed profile
Settings
X

Business Search - 14 Million verified businesses
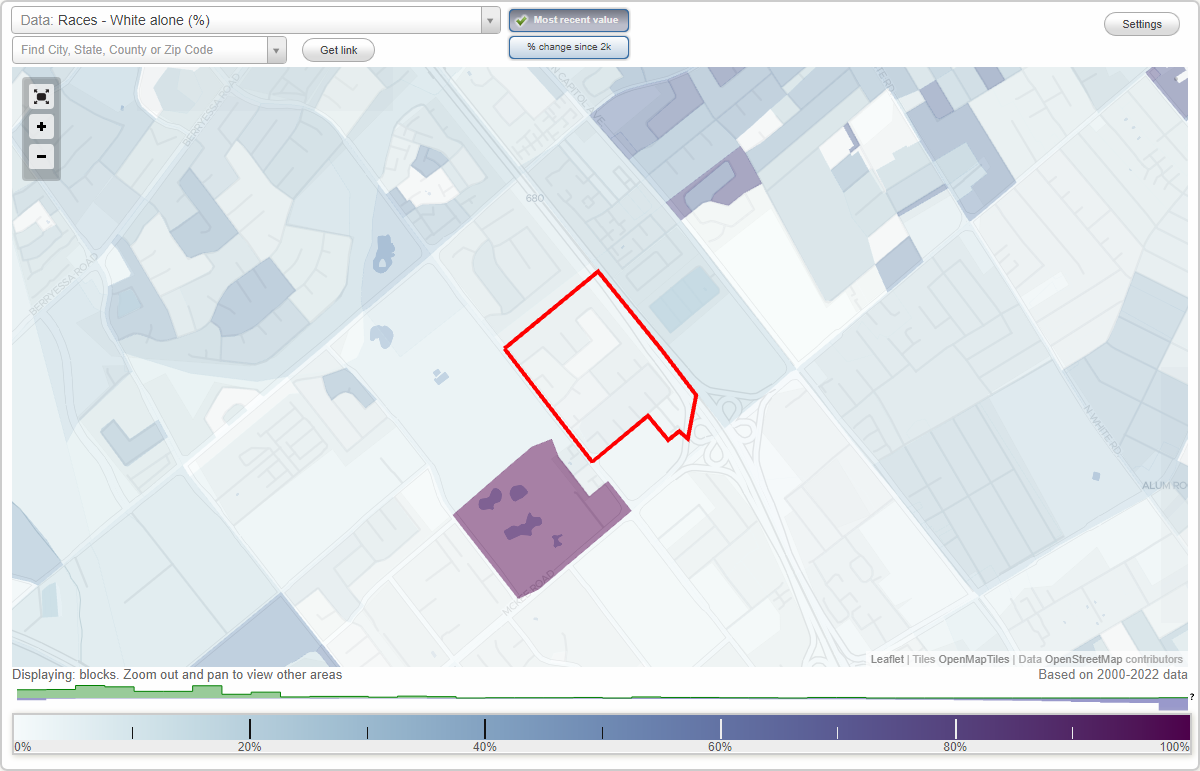
Area: 0.106 square miles
Population: 713
Population density:
| Brush Glen: | 6,735 people per square mile |
| San Jose: | 5,554 people per square mile |

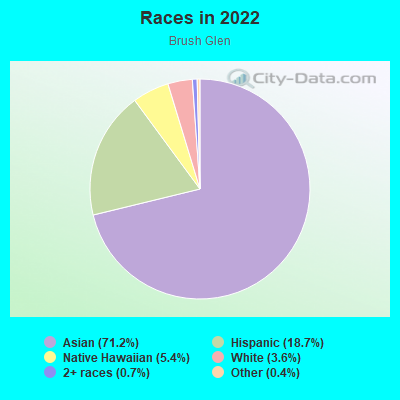
- 53771.2%Asian
- 14118.7%Hispanic or Latino
- 415.4%Native Hawaiian and Other
Pacific Islander - 273.6%White
- 50.7%Two or more races
- 30.4%Some other race
Median household income in 2022:
| Brush Glen: | $122,159 |
| San Jose: | $133,835 |
Distribution of median household income
![Distribution of median household income]()
- 16Less than $10,000
- 8$10,000 to $19,999
- 11$20,000 to $29,999
- 12$30,000 to $39,999
- 7$40,000 to $49,999
- 14$50,000 to $59,999
- 11$60,000 to $74,999
- 19$75,000 to $99,999
- 12$100,000 to $124,999
- 26$125,000 to $149,999
- 29$150,000 to $199,999
- 35$200,000 or more

Distribution of owner-occupied house/condo value
![Distribution of owner-occupied house/condo value]()
- 5Less than $50,000
- 3$150,000 to $199,999
- 4$200,000 to $249,999
- 9$250,000 to $299,999
- 25$500,000 to $749,999
- 41$750,000 to $999,999
- 40$1,000,000 or more

Distribution of rent paid by renters
![Distribution of rent paid by renters]()
- 12$200 to $299
- 6$400 to $499
- 6$500 to $599
- 2$600 to $699
- 10$800 to $899
- 9$900 to $999
- 9$1,000 to $1,249
- 3$1,250 to $1,499
- 3$1,500 to $1,999
- 35$2,000 or more

Median rent in 2022:
| Brush Glen: | $1,076 |
| San Jose: | $2,001 |
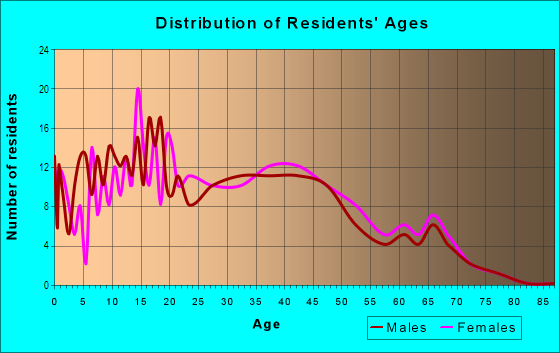
| Males: | 351 |
| Females: | 362 |
Males:
| This neighborhood: | 36.2 years |
| Whole city: | 37.6 years |
| This neighborhood: | 42.0 years |
| Whole city: | 39.1 years |
Average household size:
| Brush Glen: | 3.5 people |
| San Jose: | 2.9 people |
Percentage of family households:
| Brush Glen: | 50.3% |
| San Jose: | 49.9% |
| Here: | 47.3% |
| San Jose: | 53.0% |
Percentage of married-couple families with children (among all households):
| Brush Glen: | 20.9% |
| San Jose: | 25.8% |
Percentage of single-mother households (among all households):
| Brush Glen: | 5.9% |
| San Jose: | 5.2% |
Percentage of never married males 15 years old and over:
Percentage of never married females 15 years old and over:
| Brush Glen: | 21.4% |
| San Jose: | 20.9% |
Percentage of never married females 15 years old and over:
| Brush Glen: | 18.0% |
| city: | 16.7% |
Percentage of people that speak English not well or not at all:
| Brush Glen: | 19.7% |
| San Jose: | 11.4% |
Percentage of people born in this state:
Percentage of people born in another U.S. state:
Percentage of native residents but born outside the U.S.:
Percentage of foreign born residents:
| Here: | 41.8% |
| San Jose: | 46.1% |
Percentage of people born in another U.S. state:
| Brush Glen: | 3.3% |
| San Jose: | 10.4% |
Percentage of native residents but born outside the U.S.:
| Here: | 0.7% |
| city: | 1.7% |
Percentage of foreign born residents:
| Here: | 54.2% |
| San Jose: | 41.8% |
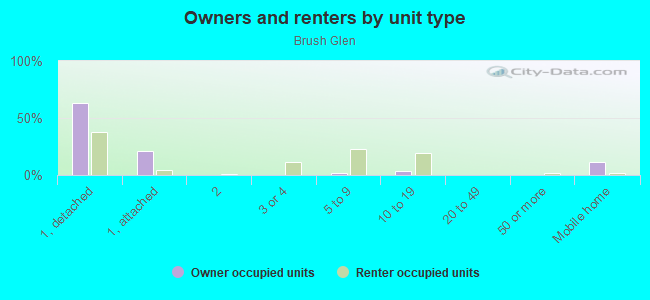
Owner-occupied
Renter-occupied

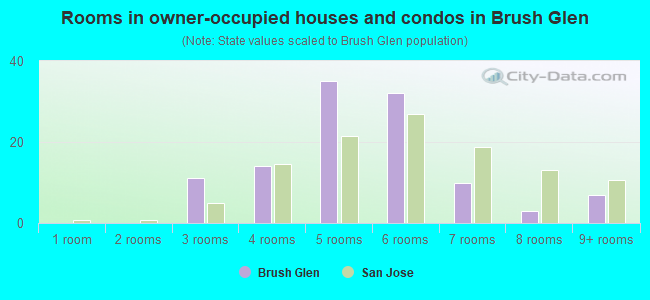
- Rooms in owner-occupied houses and condos in Brush Glen
- 01 room
- 02 rooms
- 113 rooms
- 144 rooms
- 355 rooms
- 326 rooms
- 107 rooms
- 38 rooms
- 79+ rooms
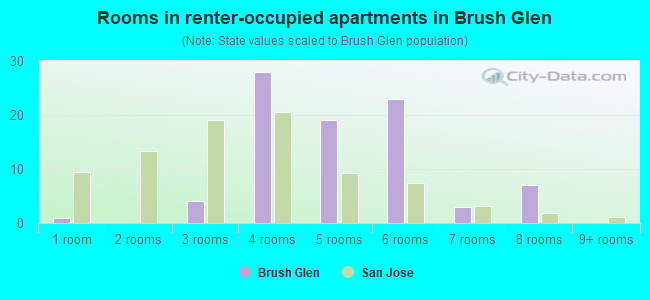
- Rooms in renter-occupied apartments in Brush Glen
- 11 room
- 02 rooms
- 43 rooms
- 284 rooms
- 195 rooms
- 236 rooms
- 37 rooms
- 78 rooms
- 09+ rooms
Owner-occupied
Renter-occupied
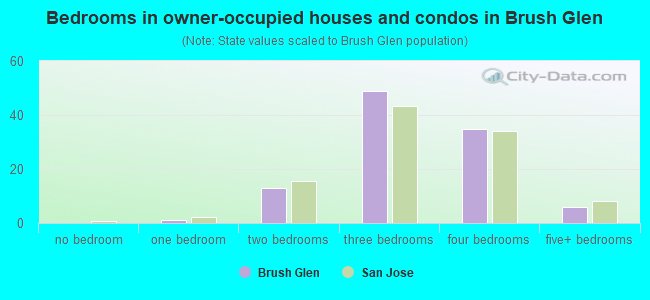
- Bedrooms in owner-occupied houses and condos in Brush Glen
- 0no bedroom
- 11 bedroom
- 132 bedrooms
- 493 bedrooms
- 354 bedrooms
- 65+ bedrooms
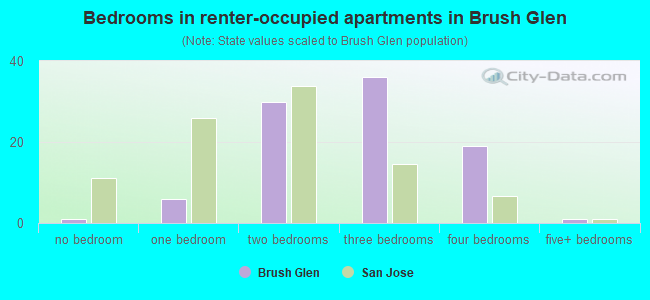
- Bedrooms in renter-occupied apartments in Brush Glen
- 1no bedroom
- 61 bedroom
- 302 bedrooms
- 363 bedrooms
- 194 bedrooms
- 15+ bedrooms
Average number of cars or other vehicles available in houses/condos:
Average number of cars or other vehicles available in apartments:
| This neighborhood: | 2.8 |
| San Jose: | 2.3 |
Average number of cars or other vehicles available in apartments:
| Here: | 2.1 |
| city: | 1.6 |
Percentage of units with a mortgage:
| Brush Glen: | 69.8% |
| San Jose: | 66.9% |
Housing prices:
- Average estimated value of detached houses in 2022 (57.1% of all units):
Brush Glen: $743,449 San Jose: $1,532,815
- Average estimated value of townhouses or other attached units in 2022 (15.2% of all units):
This neighborhood: $760,363 city: $1,024,857
- Average estimated '22 value of housing units in 3-to-4-unit structures (5.2% of all units):
Brush Glen: $581,203 city: $781,695
- Average estimated '22 value of housing units in 5-or-more-unit structures (0.5% of all units):
Brush Glen: $1,233,381 San Jose: $791,954
- Average estimated value of mobile home in 2022 (7.9% of all units):
Brush Glen: $266,726 San Jose: $237,683
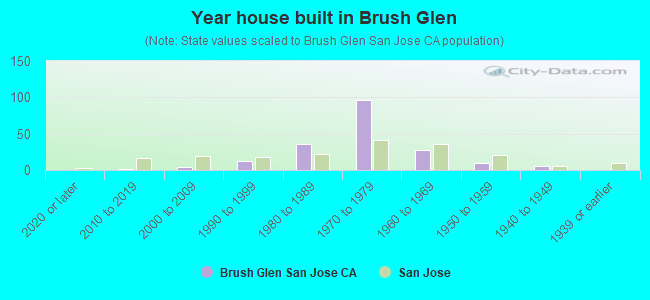
- Year house built in Brush Glen
- 02020 or later
- 12010 to 2019
- 42000 to 2009
- 121990 to 1999
- 361980 to 1989
- 961970 to 1979
- 271960 to 1969
- 101950 to 1959
- 51940 to 1949
- 01939 or earlier
City-data.com crime index for city in 2020 (higher means more crime):
| City: | 268.4 |
| U.S. average: | 219.5 |
Travel time to work (commute)
![Travel time to work (commute)]()
- 2Less than 5 minutes
- 45 to 9 minutes
- 2910 to 14 minutes
- 3115 to 19 minutes
- 3720 to 24 minutes
- 1925 to 29 minutes
- 4430 to 34 minutes
- 535 to 39 minutes
- 1640 to 44 minutes
- 2045 to 59 minutes
- 1660 to 89 minutes
- 390 or more minutes

Means of transportation to work
![Means of transportation to work]()
- 78.0%286Drove a car alone
- 6.0%22Carpooled
- 2.2%8Bus
- 1.6%6Subway or elevated rail
- 0.3%1Long-distance train or commuter rail
- 0.3%1Light rail, streetcar or trolley
- 1.4%5Walked
- 0.8%3Other means
- 10.4%38Worked at home

Time leaving home to go to work
![Time leaving home to go to work]()
- 1112:00 a.m. to 4:59 a.m.
- 75:00 a.m. to 5:29 a.m.
- 175:30 a.m. to 5:59 a.m.
- 246:00 a.m. to 6:29 a.m.
- 96:30 a.m. to 6:59 a.m.
- 157:00 a.m. to 7:29 a.m.
- 117:30 a.m. to 7:59 a.m.
- 308:00 a.m. to 8:29 a.m.
- 248:30 a.m. to 8:59 a.m.
- 249:00 a.m. to 9:59 a.m.
- 410:00 a.m. to 10:59 a.m.
- 211:00 a.m. to 11:59 a.m.
- 2912:00 p.m. to 3:59 p.m.
- 84:00 p.m. to 11:59 p.m.

Occupations of males:
- Percentage of males in management occupations (except farmers):
Here: 3.5% city: 13.0%
- Percentage of males in business and financial operations occupations:
Here: 1.1% city: 4.6%
- Percentage of males in computer and mathematical occupations:
Here: 7.8% city: 13.6%
- Percentage of males in architecture and engineering occupations:
Here: 1.3% city: 10.2%
- Percentage of males in life, physical, and social science occupations:
Here: 5.0% city: 1.1%
- Percentage of males in community and social services occupations:
Here: 1.1% city: 0.8%
- Percentage of males in education, training, and library occupations:
Here: 5.0% city: 2.8%
- Percentage of males in arts, design, entertainment, sports, and media occupations:
Here: 1.2% city: 1.8%
- Percentage of males in service occupations:
Here: 18.7% city: 12.7%
- Percentage of males in sales and office occupations:
Here: 18.8% city: 12.8%
- Percentage of males in construction, extraction, and maintenance occupations:
Here: 6.9% city: 7.8%
- Percentage of males in production occupations:
Here: 12.5% city: 5.5%
- Percentage of males in transportation occupations:
Here: 7.0% city: 3.6%
- Percentage of males in material moving occupations:
Here: 5.0% city: 3.1%
Occupations of females:
- Percentage of females in management occupations (except farmers):
Here: 8.4% city: 11.0%
- Percentage of females in business and financial operations occupations:
Here: 10.7% city: 8.6%
- Percentage of females in computer and mathematical occupations:
Here: 1.9% city: 5.4%
- Percentage of females in architecture and engineering occupations:
Here: 1.7% city: 2.8%
- Percentage of females in life, physical, and social science occupations:
Here: 2.7% city: 1.7%
- Percentage of females in community and social services occupations:
Here: 1.2% city: 1.8%
- Percentage of females in education, training, and library occupations:
Here: 7.1% city: 8.1%
- Percentage of females in healthcare practitioners and technical occupations:
Here: 10.8% city: 6.8%
- Percentage of females in service occupations:
Here: 21.3% city: 21.7%
- Percentage of females in sales and office occupations:
Here: 20.4% city: 22.0%
- Percentage of females in production occupations:
Here: 12.0% city: 4.0%
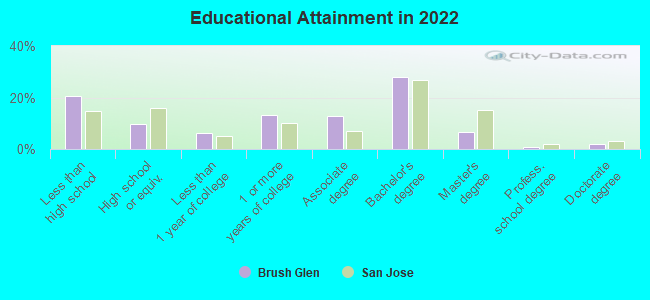
Education in this neighborhood (subdivision or community):
- Percentage of people 3 years and older in K-12 schools:
Brush Glen: 10.5% San Jose: 16.1%
- Percentage of people 3 years and older in undergraduate colleges:
Brush Glen: 8.4% San Jose: 6.5%
- Percentage of people 3 years and older in grad. or professional schools:
Brush Glen: 2.4% San Jose: 2.0%
- Percentage of students K-12 enrolled in private schools:
Brush Glen: 27.0% San Jose: 14.9%
Percentage of population below poverty level:
| Brush Glen: | 10.8% |
| San Jose: | 9.0% |
Median year owner moved in (as recorded in 2022):
Median year renter moved in (as recorded in 2022):
| Brush Glen: | 2004 |
| San Jose: | 2008 |
Median year renter moved in (as recorded in 2022):
| Brush Glen: | 2015 |
| San Jose: | 2020 |
Percentage of married-couple families with both working:
| Brush Glen: | 78.1% |
| San Jose: | 72.5% |
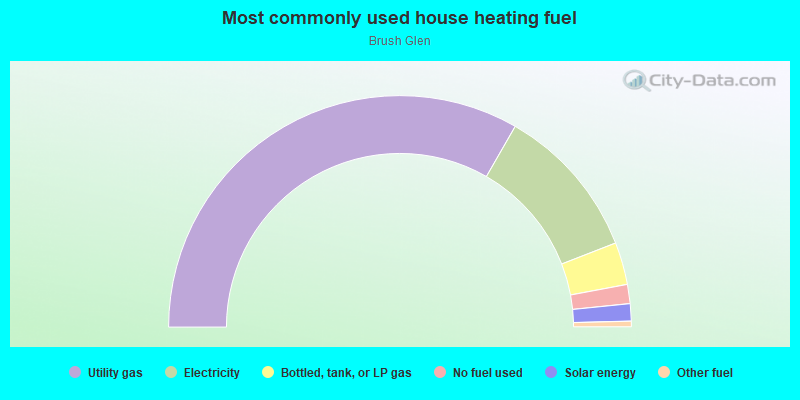
- 66.6%Utility gas
- 21.6%Electricity
- 5.9%Bottled, tank, or LP gas
- 2.7%No fuel used
- 2.4%Solar energy
- 0.8%Other fuel
Limited-access highways (interstate or state) in this neighborhood:
Sinclair Fwy (I- 680)
Length: 0.06 miles
Direction: SE-NW
Direction: SE-NW
Roads and streets:
Brushglen Way
Length: 0.34 miles
Directions: E-W, N-S, SE-NW, SW-NE
Address range: 2313 to 2399
Directions: E-W, N-S, SE-NW, SW-NE
Address range: 2313 to 2399
Lanning Way
Length: 0.34 miles
Directions: E-W, N-S, SE-NW, SW-NE
Address range: 2316 to 2399
Directions: E-W, N-S, SE-NW, SW-NE
Address range: 2316 to 2399
Rhinehart Dr
Length: 0.30 miles
Directions: E-W, N-S, SW-NE
Directions: E-W, N-S, SW-NE
Ridgeglen Way
Length: 0.22 miles
Directions: N-S, SE-NW, SW-NE
Address range: 2300 to 2499
Directions: N-S, SE-NW, SW-NE
Address range: 2300 to 2499
Downsglen Way
Length: 0.09 miles
Direction: SE-NW
Address range: 500 to 599
Direction: SE-NW
Address range: 500 to 599
Caribe Way
Length: 0.07 miles
Direction: SE-NW
Address range: 300 to 399
Direction: SE-NW
Address range: 300 to 399
Breezyglen Ct
Length: 0.07 miles
Direction: SE-NW
Address range: 500 to 599
Direction: SE-NW
Address range: 500 to 599
Ashglen Way
Length: 0.06 miles
Direction: SE-NW
Address range: 2380 to 2399
Direction: SE-NW
Address range: 2380 to 2399
Chilberg Ct
Length: 0.05 miles
Direction: SE-NW
Address range: 400 to 499
Direction: SE-NW
Address range: 400 to 499
Bataan Ct
Length: 0.05 miles
Direction: SE-NW
Address range: 400 to 499
Direction: SE-NW
Address range: 400 to 499
Clogstone Ct
Length: 0.05 miles
Direction: SE-NW
Address range: 400 to 499
Direction: SE-NW
Address range: 400 to 499
Tortola Way
Length: 0.04 miles
Direction: SE-NW
Address range: 424 to 498
Direction: SE-NW
Address range: 424 to 498
Lanning Ct
Length: 0.03 miles
Direction: SE-NW
Address range: 500 to 599
Direction: SE-NW
Address range: 500 to 599
Foundry Ct
Length: 0.03 miles
Direction: SE-NW
Address range: 500 to 599
Direction: SE-NW
Address range: 500 to 599
Moorglen Ct
Length: 0.03 miles
Direction: SE-NW
Address range: 2300 to 2399
Direction: SE-NW
Address range: 2300 to 2399
Bayside Ct
Length: 0.02 miles
Direction: SE-NW
Address range: 2301 to 2399
Direction: SE-NW
Address range: 2301 to 2399