Central Park District neighborhood in Durham, North Carolina (NC), 27701 detailed profile
Settings
X


Business Search - 14 Million verified businesses
Area: 0.099 square miles
Population: 698
Population density:
| Central Park District: | 7,036 people per square mile |
| Durham: | 3,084 people per square mile |

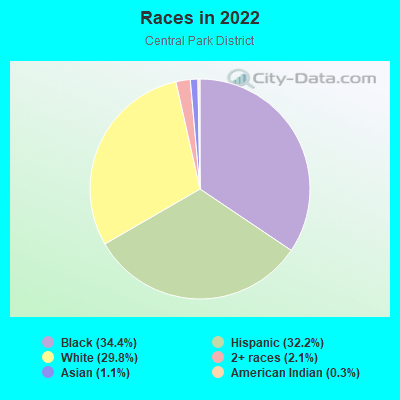
- 24234.4%Black
- 22732.2%Hispanic or Latino
- 21029.8%White
- 152.1%Two or more races
- 81.1%Asian
- 20.3%American Indian
Median household income in 2022:
| Central Park District: | $60,857 |
| Durham: | $78,105 |
Distribution of median household income
![Distribution of median household income]()
- 3Less than $10,000
- 21$10,000 to $19,999
- 5$20,000 to $29,999
- 15$30,000 to $39,999
- 21$40,000 to $49,999
- 39$50,000 to $59,999
- 18$60,000 to $74,999
- 49$75,000 to $99,999
- 12$100,000 to $124,999
- 9$125,000 to $149,999
- 6$150,000 to $199,999
- 18$200,000 or more

Distribution of owner-occupied house/condo value
![Distribution of owner-occupied house/condo value]()
- 6Less than $50,000
- 5$100,000 to $149,999
- 4$200,000 to $249,999
- 4$250,000 to $299,999
- 10$300,000 to $399,999
- 8$400,000 to $499,999
- 19$500,000 to $749,999
- 9$750,000 to $999,999
- 9$1,000,000 or more

Distribution of rent paid by renters
![Distribution of rent paid by renters]()
- 2$100 to $199
- 1$400 to $499
- 20$500 to $599
- 66$600 to $699
- 11$700 to $799
- 16$800 to $899
- 20$900 to $999
- 14$1,000 to $1,249
- 6$1,250 to $1,499
- 4$1,500 to $1,999
- 13$2,000 or more

Median rent in 2022:
| Central Park District: | $700 |
| Durham: | $1,246 |
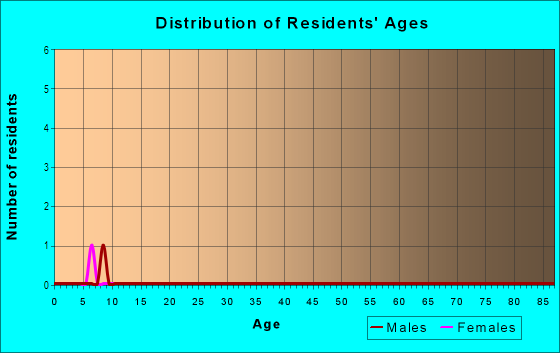
| Males: | 394 |
| Females: | 303 |
Males:
| This neighborhood: | 36.5 years |
| Whole city: | 34.3 years |
| This neighborhood: | 37.0 years |
| Whole city: | 35.8 years |
Average household size:
| Central Park District: | 2.9 people |
| Durham: | 2.3 people |
Percentage of family households:
| Central Park District: | 52.9% |
| Durham: | 41.2% |
| Here: | 14.0% |
| Durham: | 36.4% |
Percentage of married-couple families with children (among all households):
| Central Park District: | 17.9% |
| Durham: | 27.1% |
Percentage of single-mother households (among all households):
| Central Park District: | 11.6% |
| Durham: | 12.7% |
Percentage of never married males 15 years old and over:
Percentage of never married females 15 years old and over:
| Central Park District: | 36.1% |
| Durham: | 20.9% |
Percentage of never married females 15 years old and over:
| Central Park District: | 26.3% |
| city: | 23.2% |
Percentage of people that speak English not well or not at all:
| Central Park District: | 23.5% |
| Durham: | 4.9% |
Percentage of people born in this state:
Percentage of people born in another U.S. state:
Percentage of native residents but born outside the U.S.:
Percentage of foreign born residents:
| Here: | 35.3% |
| Durham: | 45.4% |
Percentage of people born in another U.S. state:
| Central Park District: | 35.6% |
| Durham: | 38.2% |
Percentage of native residents but born outside the U.S.:
| Here: | 5.0% |
| city: | 1.6% |
Percentage of foreign born residents:
| Here: | 24.2% |
| Durham: | 14.8% |
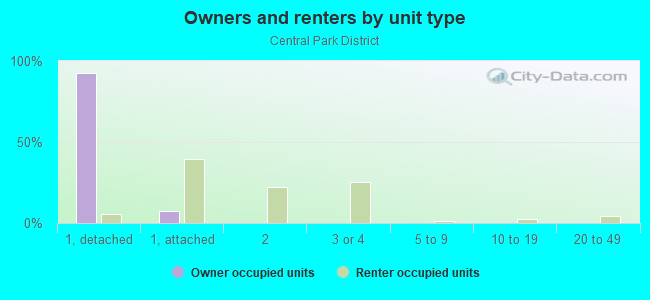
Owner-occupied
Renter-occupied

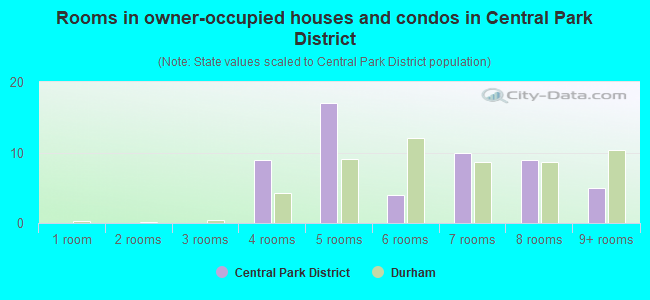
- Rooms in owner-occupied houses and condos in Central Park District
- 01 room
- 02 rooms
- 03 rooms
- 94 rooms
- 175 rooms
- 46 rooms
- 107 rooms
- 98 rooms
- 59+ rooms
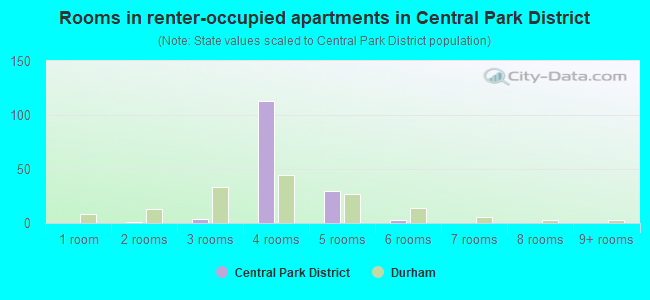
- Rooms in renter-occupied apartments in Central Park District
- 01 room
- 12 rooms
- 43 rooms
- 1134 rooms
- 305 rooms
- 36 rooms
- 07 rooms
- 08 rooms
- 09+ rooms
Owner-occupied
Renter-occupied
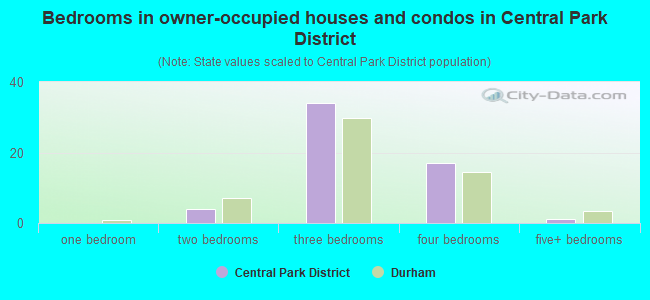
- Bedrooms in owner-occupied houses and condos in Central Park District
- 0no bedroom
- 01 bedroom
- 42 bedrooms
- 343 bedrooms
- 174 bedrooms
- 15+ bedrooms
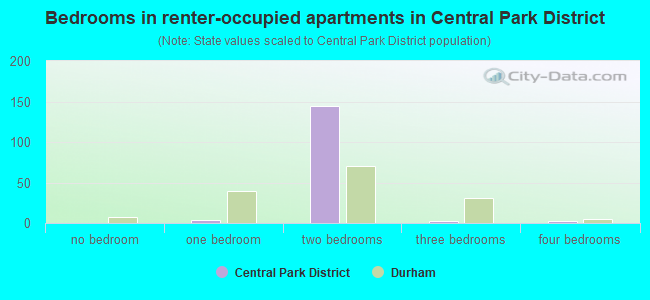
- Bedrooms in renter-occupied apartments in Central Park District
- 0no bedroom
- 41 bedroom
- 1442 bedrooms
- 33 bedrooms
- 24 bedrooms
- 05+ bedrooms
Average number of cars or other vehicles available in houses/condos:
Average number of cars or other vehicles available in apartments:
| This neighborhood: | 2.3 |
| Durham: | 1.9 |
Average number of cars or other vehicles available in apartments:
| Here: | 1.5 |
| city: | 1.3 |
Percentage of units with a mortgage:
| Central Park District: | 94.6% |
| Durham: | 74.8% |
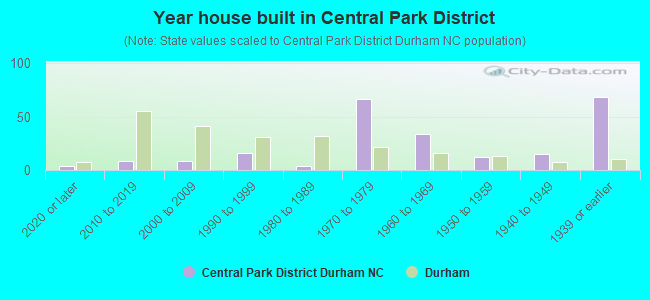
- Year house built in Central Park District
- 42020 or later
- 82010 to 2019
- 82000 to 2009
- 161990 to 1999
- 41980 to 1989
- 661970 to 1979
- 341960 to 1969
- 121950 to 1959
- 151940 to 1949
- 681939 or earlier
City-data.com crime index for city in 2020 (higher means more crime):
| City: | 425.9 |
| U.S. average: | 219.5 |
Travel time to work (commute)
![Travel time to work (commute)]()
- 2Less than 5 minutes
- 85 to 9 minutes
- 4410 to 14 minutes
- 4215 to 19 minutes
- 1620 to 24 minutes
- 325 to 29 minutes
- 630 to 34 minutes
- 945 to 59 minutes
- 460 to 89 minutes
- 1090 or more minutes

Means of transportation to work
![Means of transportation to work]()
- 69.9%272Drove a car alone
- 18.5%72Carpooled
- 0.5%2Bus
- 2.3%9Walked
- 8.7%34Worked at home

Time leaving home to go to work
![Time leaving home to go to work]()
- 1012:00 a.m. to 4:59 a.m.
- 125:00 a.m. to 5:29 a.m.
- 65:30 a.m. to 5:59 a.m.
- 216:30 a.m. to 6:59 a.m.
- 117:00 a.m. to 7:29 a.m.
- 217:30 a.m. to 7:59 a.m.
- 218:00 a.m. to 8:29 a.m.
- 148:30 a.m. to 8:59 a.m.
- 119:00 a.m. to 9:59 a.m.
- 210:00 a.m. to 10:59 a.m.
- 211:00 a.m. to 11:59 a.m.
- 512:00 p.m. to 3:59 p.m.
- 44:00 p.m. to 11:59 p.m.

Occupations of males:
- Percentage of males in management occupations (except farmers):
Here: 5.2% city: 13.6%
- Percentage of males in computer and mathematical occupations:
Here: 3.1% city: 9.2%
- Percentage of males in architecture and engineering occupations:
Here: 2.6% city: 2.7%
- Percentage of males in community and social services occupations:
Here: 2.0% city: 1.3%
- Percentage of males in legal occupations:
Here: 6.6% city: 1.1%
- Percentage of males in education, training, and library occupations:
Here: 5.7% city: 6.0%
- Percentage of males in arts, design, entertainment, sports, and media occupations:
Here: 2.9% city: 2.2%
- Percentage of males in service occupations:
Here: 14.3% city: 13.7%
- Percentage of males in sales and office occupations:
Here: 8.3% city: 12.9%
- Percentage of males in construction, extraction, and maintenance occupations:
Here: 41.3% city: 8.8%
- Percentage of males in production occupations:
Here: 3.2% city: 3.9%
- Percentage of males in transportation occupations:
Here: 7.4% city: 3.3%
Occupations of females:
- Percentage of females in management occupations (except farmers):
Here: 9.9% city: 11.0%
- Percentage of females in business and financial operations occupations:
Here: 4.3% city: 8.1%
- Percentage of females in computer and mathematical occupations:
Here: 1.6% city: 2.8%
- Percentage of females in life, physical, and social science occupations:
Here: 2.3% city: 4.4%
- Percentage of females in education, training, and library occupations:
Here: 6.4% city: 11.8%
- Percentage of females in arts, design, entertainment, sports, and media occupations:
Here: 3.3% city: 2.1%
- Percentage of females in healthcare practitioners and technical occupations:
Here: 2.1% city: 13.6%
- Percentage of females in service occupations:
Here: 31.7% city: 16.8%
- Percentage of females in sales and office occupations:
Here: 33.8% city: 19.6%
- Percentage of females in construction, extraction, and maintenance occupations:
Here: 6.4% city: 0.3%
- Percentage of females in production occupations:
Here: 2.1% city: 1.9%
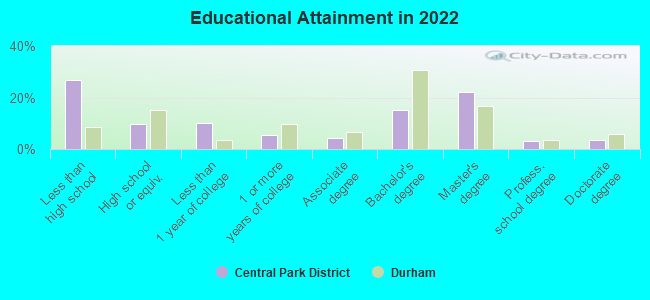
Education in this neighborhood (subdivision or community):
- Percentage of people 3 years and older in K-12 schools:
Central Park District: 9.9% Durham: 14.4%
- Percentage of people 3 years and older in undergraduate colleges:
Central Park District: 3.3% Durham: 5.8%
- Percentage of people 3 years and older in grad. or professional schools:
Central Park District: 0.6% Durham: 4.6%
- Percentage of students K-12 enrolled in private schools:
Central Park District: 2.9% Durham: 16.9%
Percentage of population below poverty level:
| Central Park District: | 30.0% |
| Durham: | 11.2% |
Median year owner moved in (as recorded in 2022):
Median year renter moved in (as recorded in 2022):
| Central Park District: | 2014 |
| Durham: | 2013 |
Median year renter moved in (as recorded in 2022):
| Central Park District: | 2018 |
| Durham: | 2020 |
Percentage of married-couple families with both working:
| Central Park District: | 64.0% |
| Durham: | 68.9% |
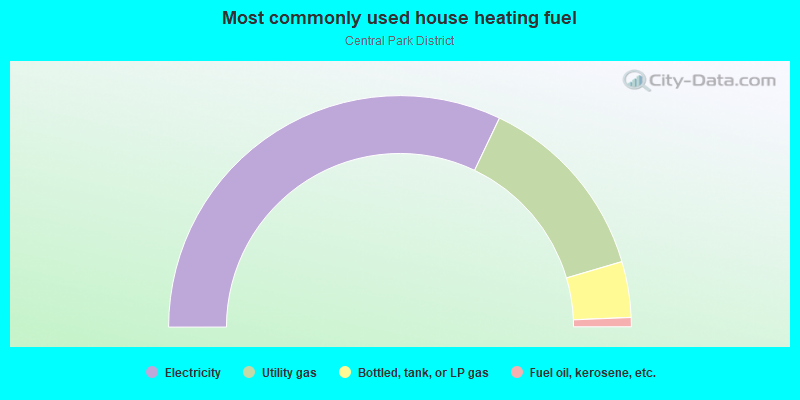
- 64.1%Electricity
- 26.7%Utility gas
- 7.8%Bottled, tank, or LP gas
- 1.3%Fuel oil, kerosene, etc.
Highways in this neighborhood:
US Hwy 70 (W Morgan St, State Hwy 98)
Length: 0.28 miles
Directions: E-W, SE-NW
Address range: 100 to 398
Directions: E-W, SE-NW
Address range: 100 to 398
US Hwy 15 Bus (US Hwy 501 Bus, N Mangum St)
Length: 0.06 miles
Direction: SW-NE
Address range: 414 to 572
Direction: SW-NE
Address range: 414 to 572
Roads and streets:
Foster St
Length: 0.39 miles
Direction: N-S
Address range: 300 to 699
Direction: N-S
Address range: 300 to 699
W Seminary Ave
Length: 0.27 miles
Directions: E-W, SE-NW
Address range: 100 to 299
Directions: E-W, SE-NW
Address range: 100 to 299
Roney St
Length: 0.20 miles
Direction: N-S
Address range: 300 to 499
Direction: N-S
Address range: 300 to 499
Hunt St
Length: 0.16 miles
Direction: E-W
Address range: 200 to 399
Direction: E-W
Address range: 200 to 399
W Corporation St
Length: 0.15 miles
Direction: E-W
Address range: 400 to 549
Direction: E-W
Address range: 400 to 549
Rigsbee Ave
Length: 0.13 miles
Direction: N-S
Address range: 300 to 499
Direction: N-S
Address range: 300 to 499
W Geer St
Length: 0.12 miles
Direction: E-W
Address range: 500 to 599
Direction: E-W
Address range: 500 to 599