Chesney Park neighborhood in Topeka, Kansas (KS), 66604, 66612 detailed profile
Settings
X

Business Search - 14 Million verified businesses
Area: 0.372 square miles
Population: 1,491
Population density:
| Chesney Park: | 4,009 people per square mile |
| Topeka: | 2,240 people per square mile |

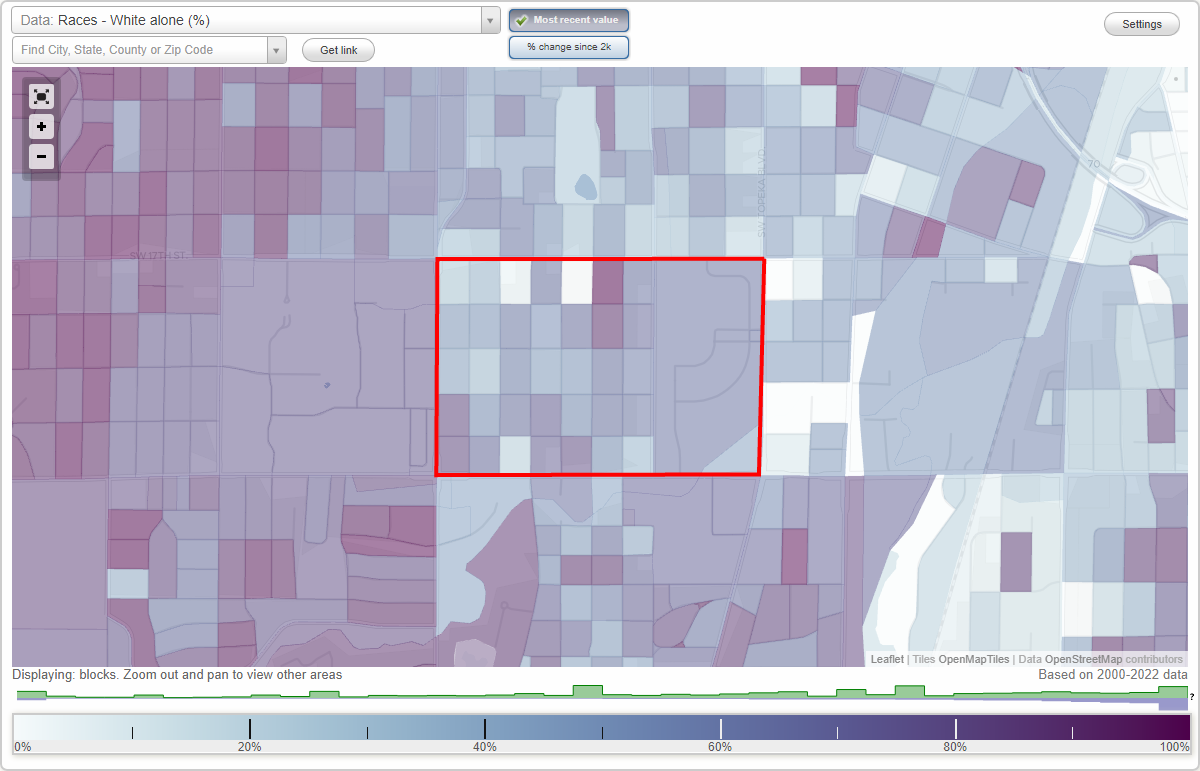
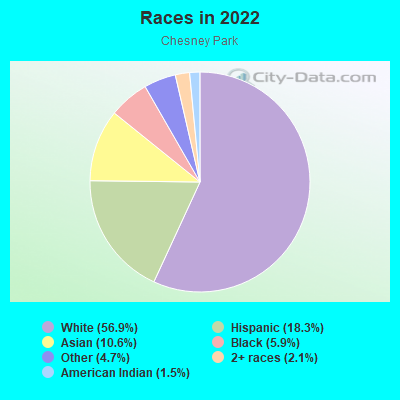
- 96456.9%White
- 31018.3%Hispanic or Latino
- 17910.6%Asian
- 1005.9%Black
- 804.7%Some other race
- 352.1%Two or more races
- 251.5%American Indian
Median household income in 2022:
| Chesney Park: | $36,738 |
| Topeka: | $50,709 |
Distribution of median household income
![Distribution of median household income]()
- 27Less than $10,000
- 91$10,000 to $19,999
- 91$20,000 to $29,999
- 116$30,000 to $39,999
- 46$40,000 to $49,999
- 53$50,000 to $59,999
- 60$60,000 to $74,999
- 8$75,000 to $99,999
- 35$100,000 to $124,999
- 22$125,000 to $149,999
- 10$150,000 to $199,999
- 39$200,000 or more

Distribution of owner-occupied house/condo value
![Distribution of owner-occupied house/condo value]()
- 196Less than $50,000
- 270$50,000 to $99,999
- 64$100,000 to $149,999
- 30$150,000 to $199,999
- 20$200,000 to $249,999
- 2$300,000 to $399,999

Distribution of rent paid by renters
![Distribution of rent paid by renters]()
- 4Less than $100
- 142$200 to $299
- 119$300 to $399
- 81$400 to $499
- 106$500 to $599
- 93$600 to $699
- 42$700 to $799
- 146$800 to $899
- 27$900 to $999
- 36$1,000 to $1,249
- 8$1,250 to $1,499
- 27$1,500 to $1,999
- 19$2,000 or more

Median rent in 2022:
| Chesney Park: | $645 |
| Topeka: | $670 |
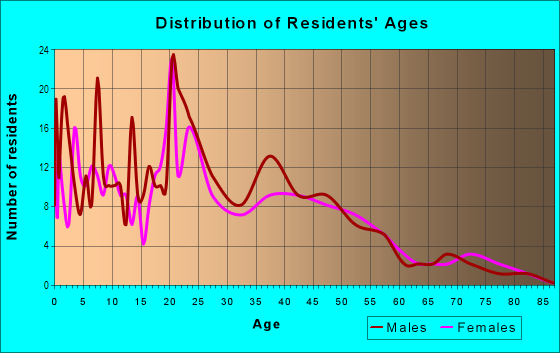
| Males: | 818 |
| Females: | 672 |
Males:
| This neighborhood: | 38.7 years |
| Whole city: | 37.1 years |
| This neighborhood: | 34.5 years |
| Whole city: | 38.8 years |
Average household size:
| Chesney Park: | 2.0 people |
| Topeka: | 2.2 people |
Percentage of family households:
| Chesney Park: | 59.9% |
| Topeka: | 38.2% |
| Here: | 24.5% |
| Topeka: | 35.2% |
Percentage of married-couple families with children (among all households):
| Chesney Park: | 6.1% |
| Topeka: | 27.5% |
Percentage of single-mother households (among all households):
| Chesney Park: | 30.5% |
| Topeka: | 10.7% |
Percentage of never married males 15 years old and over:
Percentage of never married females 15 years old and over:
| Chesney Park: | 22.7% |
| Topeka: | 19.2% |
Percentage of never married females 15 years old and over:
| Chesney Park: | 17.9% |
| city: | 17.5% |
Percentage of people that speak English not well or not at all:
| Chesney Park: | 8.6% |
| Topeka: | 2.2% |
Percentage of people born in this state:
Percentage of people born in another U.S. state:
Percentage of native residents but born outside the U.S.:
Percentage of foreign born residents:
| Here: | 58.0% |
| Topeka: | 67.1% |
Percentage of people born in another U.S. state:
| Chesney Park: | 33.0% |
| Topeka: | 25.0% |
Percentage of native residents but born outside the U.S.:
| Here: | 0.4% |
| city: | 1.7% |
Percentage of foreign born residents:
| Here: | 9.0% |
| Topeka: | 6.3% |
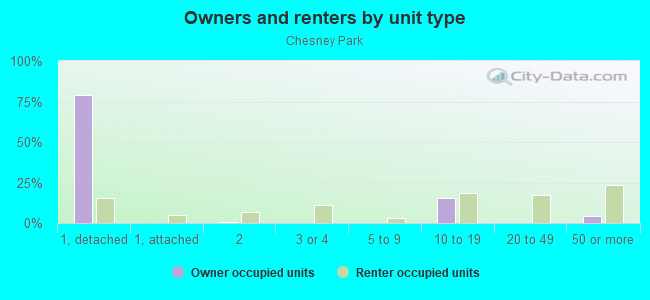
Owner-occupied
Renter-occupied

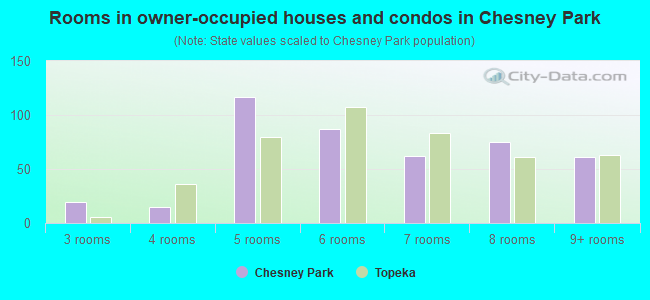
- Rooms in owner-occupied houses and condos in Chesney Park
- 01 room
- 02 rooms
- 193 rooms
- 154 rooms
- 1175 rooms
- 876 rooms
- 627 rooms
- 758 rooms
- 619+ rooms
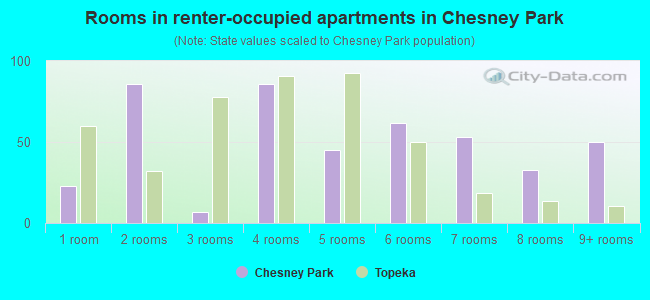
- Rooms in renter-occupied apartments in Chesney Park
- 231 room
- 862 rooms
- 73 rooms
- 864 rooms
- 455 rooms
- 626 rooms
- 537 rooms
- 338 rooms
- 509+ rooms
Owner-occupied
Renter-occupied
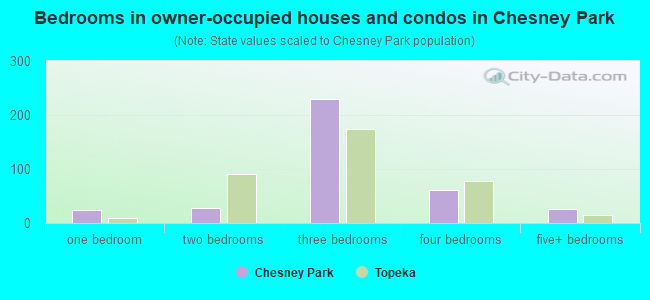
- Bedrooms in owner-occupied houses and condos in Chesney Park
- 0no bedroom
- 241 bedroom
- 272 bedrooms
- 2303 bedrooms
- 614 bedrooms
- 265+ bedrooms
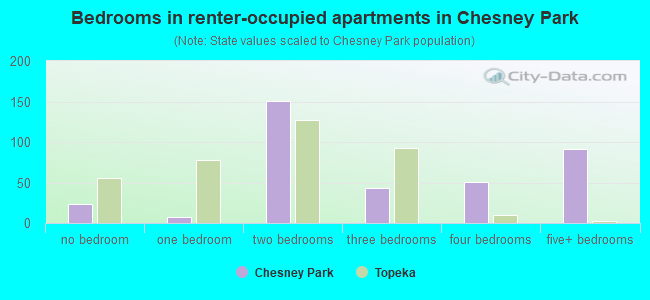
- Bedrooms in renter-occupied apartments in Chesney Park
- 23no bedroom
- 71 bedroom
- 1512 bedrooms
- 433 bedrooms
- 514 bedrooms
- 915+ bedrooms
Average number of cars or other vehicles available in houses/condos:
Average number of cars or other vehicles available in apartments:
| This neighborhood: | 1.8 |
| Topeka: | 1.9 |
Average number of cars or other vehicles available in apartments:
| Here: | 1.1 |
| city: | 1.2 |
Percentage of units with a mortgage:
| Chesney Park: | 53.3% |
| Topeka: | 54.9% |
Average estimated value of detached houses in 2022 (81.2% of all units):
| Chesney Park: | $63,031 |
| Kansas: | $264,181 |
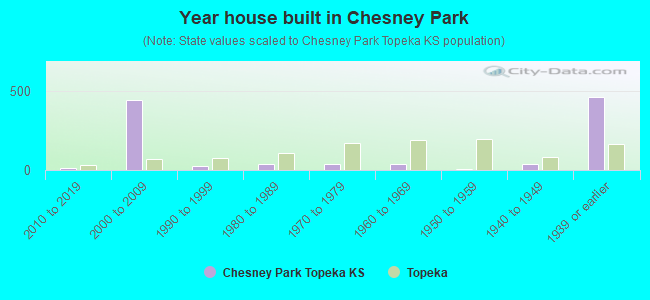
- Year house built in Chesney Park
- 02020 or later
- 102010 to 2019
- 4402000 to 2009
- 251990 to 1999
- 361980 to 1989
- 371970 to 1979
- 361960 to 1969
- 71950 to 1959
- 391940 to 1949
- 4581939 or earlier
City-data.com crime index for city in 2020 (higher means more crime):
| City: | 8.2 |
| U.S. average: | 219.5 |
Travel time to work (commute)
![Travel time to work (commute)]()
- 3Less than 5 minutes
- 475 to 9 minutes
- 13510 to 14 minutes
- 12515 to 19 minutes
- 10520 to 24 minutes
- 3125 to 29 minutes
- 2330 to 34 minutes
- 435 to 39 minutes
- 1540 to 44 minutes
- 5745 to 59 minutes
- 1260 to 89 minutes
- 390 or more minutes

Means of transportation to work
![Means of transportation to work]()
- 77.6%455Drove a car alone
- 14.2%83Carpooled
- 3.9%23Bus
- 1.2%7Bicycle
- 19.8%116Walked
- 9.7%57Other means
- 7.8%46Worked at home

Time leaving home to go to work
![Time leaving home to go to work]()
- 1212:00 a.m. to 4:59 a.m.
- 465:00 a.m. to 5:29 a.m.
- 295:30 a.m. to 5:59 a.m.
- 196:00 a.m. to 6:29 a.m.
- 706:30 a.m. to 6:59 a.m.
- 507:00 a.m. to 7:29 a.m.
- 957:30 a.m. to 7:59 a.m.
- 578:00 a.m. to 8:29 a.m.
- 68:30 a.m. to 8:59 a.m.
- 169:00 a.m. to 9:59 a.m.
- 2510:00 a.m. to 10:59 a.m.
- 511:00 a.m. to 11:59 a.m.
- 6212:00 p.m. to 3:59 p.m.
- 194:00 p.m. to 11:59 p.m.

Occupations of males:
- Percentage of males in architecture and engineering occupations:
Here: 7.2% city: 2.5%
- Percentage of males in community and social services occupations:
Here: 7.5% city: 2.0%
- Percentage of males in legal occupations:
Here: 5.5% city: 1.4%
- Percentage of males in service occupations:
Here: 2.0% city: 16.6%
- Percentage of males in sales and office occupations:
Here: 15.2% city: 14.5%
- Percentage of males in farming, fishing, and forestry occupations:
Here: 1.7% city: 0.8%
- Percentage of males in construction, extraction, and maintenance occupations:
Here: 38.7% city: 9.7%
- Percentage of males in production occupations:
Here: 12.5% city: 8.2%
- Percentage of males in transportation occupations:
Here: 3.0% city: 4.6%
Occupations of females:
- Percentage of females in management occupations (except farmers):
Here: 1.2% city: 6.6%
- Percentage of females in healthcare practitioners and technical occupations:
Here: 7.5% city: 11.5%
- Percentage of females in service occupations:
Here: 40.7% city: 22.2%
- Percentage of females in sales and office occupations:
Here: 36.3% city: 26.9%
- Percentage of females in production occupations:
Here: 15.1% city: 3.3%
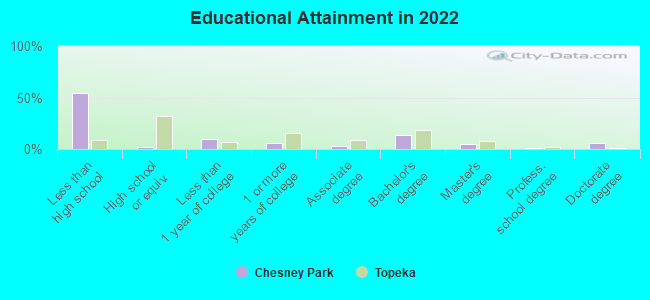
Education in this neighborhood (subdivision or community):
- Percentage of people 3 years and older in K-12 schools:
Chesney Park: 24.0% Topeka: 14.7%
- Percentage of people 3 years and older in undergraduate colleges:
Chesney Park: 2.6% Topeka: 4.3%
- Percentage of people 3 years and older in grad. or professional schools:
Chesney Park: 11.4% Topeka: 1.1%
- Percentage of students K-12 enrolled in private schools:
Chesney Park: 43.2% Topeka: 10.9%
Percentage of population below poverty level:
| Chesney Park: | 30.8% |
| Topeka: | 17.7% |
Median year owner moved in (as recorded in 2022):
Median year renter moved in (as recorded in 2022):
| Chesney Park: | 2009 |
| Topeka: | 2011 |
Median year renter moved in (as recorded in 2022):
| Chesney Park: | 2018 |
| Topeka: | 2020 |
Percentage of married-couple families with both working:
| Chesney Park: | 64.0% |
| Topeka: | 68.4% |
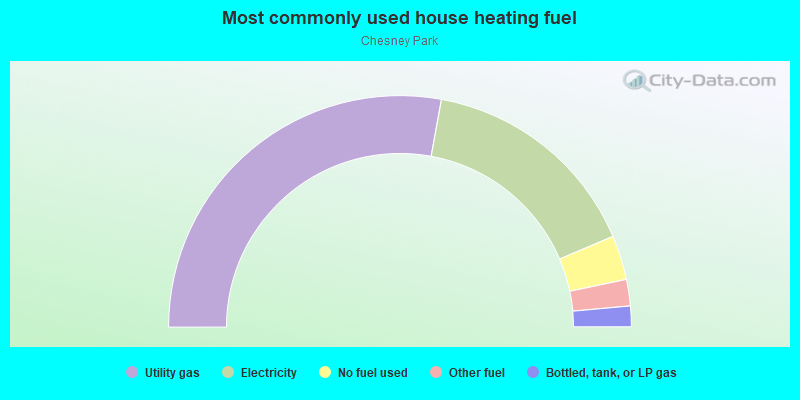
- 55.8%Utility gas
- 31.5%Electricity
- 6.2%No fuel used
- 3.7%Other fuel
- 2.9%Bottled, tank, or LP gas
Highways in this neighborhood:
Topeka Blvd (US Hwy 75 Alt)
Length: 0.08 miles
Direction: N-S
Address range: 1750 to 1839
Direction: N-S
Address range: 1750 to 1839
Roads and streets:
SW 18th St
Length: 0.55 miles
Direction: E-W
Address range: 800 to 1399
Direction: E-W
Address range: 800 to 1399
SW 19th St
Length: 0.55 miles
Direction: E-W
Address range: 800 to 1399
Direction: E-W
Address range: 800 to 1399
SW 20th St
Length: 0.54 miles
Direction: E-W
Address range: 800 to 1399
Direction: E-W
Address range: 800 to 1399
SW Hampton St
Length: 0.54 miles
Direction: E-W
Address range: 800 to 1395
Direction: E-W
Address range: 800 to 1395
SW Lincoln St
Length: 0.39 miles
Direction: N-S
Address range: 1800 to 2099
Direction: N-S
Address range: 1800 to 2099
SW Lane St
Length: 0.39 miles
Direction: N-S
Address range: 1800 to 2099
Direction: N-S
Address range: 1800 to 2099
SW Central Park Ave
Length: 0.30 miles
Direction: N-S
Address range: 1800 to 2038
Direction: N-S
Address range: 1800 to 2038
SW Fillmore St
Length: 0.30 miles
Direction: N-S
Address range: 1800 to 2037
Direction: N-S
Address range: 1800 to 2037
SW Western Ave
Length: 0.30 miles
Direction: N-S
Address range: 1800 to 2035
Direction: N-S
Address range: 1800 to 2035
SW Clay St
Length: 0.30 miles
Direction: N-S
Address range: 1800 to 2030
Direction: N-S
Address range: 1800 to 2030
SW Buchanan St
Length: 0.30 miles
Direction: N-S
Address range: 1800 to 2035
Direction: N-S
Address range: 1800 to 2035
Expocentre Dr
Length: 0.29 miles
Directions: E-W, N-S, SE-NW, SW-NE
Directions: E-W, N-S, SE-NW, SW-NE