Claremont neighborhood in Orinda, California (CA), 94563 detailed profile
Settings
X


Business Search - 14 Million verified businesses
Area: 0.339 square miles
Population: 271
Population density:
| Claremont: | 799 people per square mile |
| Orinda: | 1,547 people per square mile |

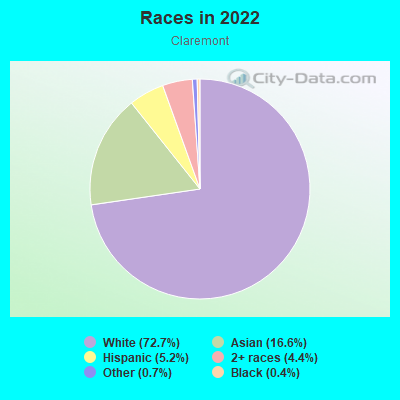
- 19772.7%White
- 4516.6%Asian
- 145.2%Hispanic or Latino
- 124.4%Two or more races
- 20.7%Some other race
- 10.4%Black

Median household income in 2022:
| Claremont: | $234,837 |
| Orinda: | $250,001 |
Distribution of median household income
![Distribution of median household income]()
- 2Less than $10,000
- 17$10,000 to $19,999
- 12$20,000 to $29,999
- 1$30,000 to $39,999
- 28$40,000 to $49,999
- 4$50,000 to $59,999
- 3$60,000 to $74,999
- 6$75,000 to $99,999
- 6$100,000 to $124,999
- 7$125,000 to $149,999
- 8$150,000 to $199,999
- 56$200,000 or more

Distribution of owner-occupied house/condo value
![Distribution of owner-occupied house/condo value]()
- 4Less than $50,000
- 2$500,000 to $749,999
- 7$750,000 to $999,999
- 77$1,000,000 or more

Distribution of rent paid by renters
![Distribution of rent paid by renters]()
- 1$100 to $199
- 2$200 to $299
- 13$300 to $399
- 4$400 to $499
- 3$800 to $899
- 12$2,000 or more

| Males: | 138 |
| Females: | 133 |
Males:
| This neighborhood: | 47.4 years |
| Whole city: | 50.3 years |
| This neighborhood: | 47.7 years |
| Whole city: | 48.0 years |
Average household size:
| Claremont: | 2.6 people |
| Orinda: | 2.6 people |
Percentage of family households:
| Claremont: | 53.5% |
| Orinda: | 48.6% |
| Here: | 63.0% |
| Orinda: | 67.8% |
Percentage of married-couple families with children (among all households):
| Claremont: | 33.7% |
| Orinda: | 36.7% |
Percentage of single-mother households (among all households):
| Claremont: | 1.4% |
| Orinda: | 0.7% |
Percentage of never married males 15 years old and over:
Percentage of never married females 15 years old and over:
| Claremont: | 12.9% |
| Orinda: | 11.4% |
Percentage of never married females 15 years old and over:
| Claremont: | 8.7% |
| city: | 10.3% |
Percentage of people that speak English not well or not at all:
| Claremont: | 0.0% |
| Orinda: | 0.9% |
Percentage of people born in this state:
Percentage of people born in another U.S. state:
Percentage of native residents but born outside the U.S.:
Percentage of foreign born residents:
| Here: | 50.9% |
| Orinda: | 51.1% |
Percentage of people born in another U.S. state:
| Claremont: | 22.3% |
| Orinda: | 29.1% |
Percentage of native residents but born outside the U.S.:
| Here: | 2.0% |
| city: | 1.5% |
Percentage of foreign born residents:
| Here: | 24.8% |
| Orinda: | 18.3% |
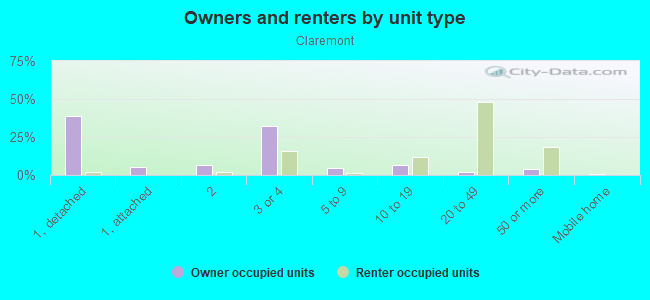
Owner-occupied
Renter-occupied

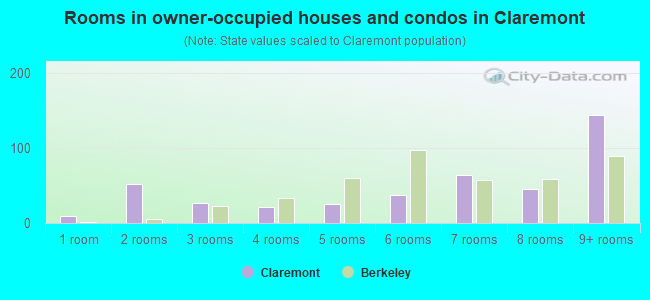
- Rooms in owner-occupied houses and condos in Claremont
- 01 room
- 02 rooms
- 63 rooms
- 24 rooms
- 175 rooms
- 106 rooms
- 147 rooms
- 158 rooms
- 259+ rooms
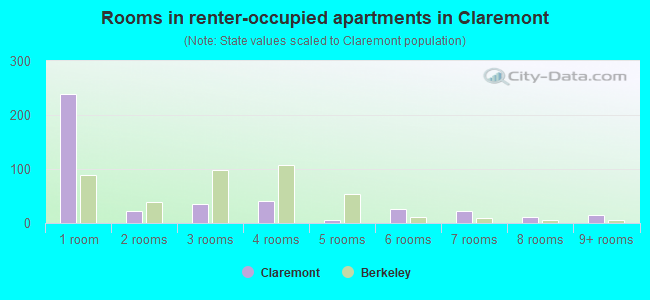
- Rooms in renter-occupied apartments in Claremont
- 01 room
- 02 rooms
- 43 rooms
- 64 rooms
- 05 rooms
- 46 rooms
- 17 rooms
- 48 rooms
- 09+ rooms
Owner-occupied
Renter-occupied
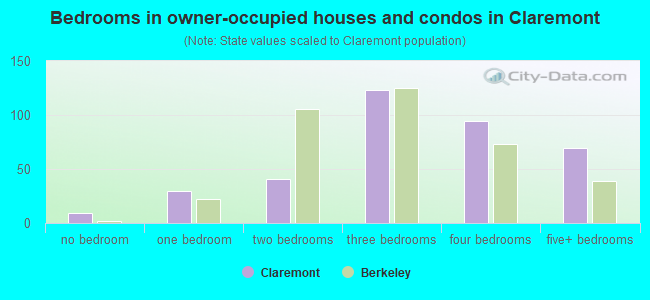
- Bedrooms in owner-occupied houses and condos in Claremont
- 0no bedroom
- 01 bedroom
- 82 bedrooms
- 373 bedrooms
- 284 bedrooms
- 115+ bedrooms
- Bedrooms in renter-occupied apartments in Claremont
- 0no bedroom
- 01 bedroom
- 72 bedrooms
- 33 bedrooms
- 04 bedrooms
- 35+ bedrooms
Average number of cars or other vehicles available in houses/condos:
Average number of cars or other vehicles available in apartments:
| This neighborhood: | 2.0 |
| Orinda: | 2.3 |
Average number of cars or other vehicles available in apartments:
| Here: | 2.1 |
| city: | 1.0 |
Percentage of units with a mortgage:
| Claremont: | 76.3% |
| Orinda: | 70.5% |
Average estimated value of detached houses in 2022 (99.0% of all units):
| Claremont: | $1,662,105 |
| California: | $988,808 |
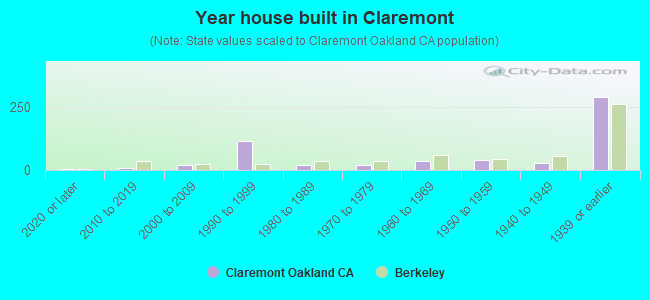
- Year house built in Claremont
- 02020 or later
- 02010 to 2019
- 62000 to 2009
- 01990 to 1999
- 71980 to 1989
- 91970 to 1979
- 121960 to 1969
- 281950 to 1959
- 201940 to 1949
- 101939 or earlier
City-data.com crime index for city in 2020 (higher means more crime):
| City: | 42.7 |
| U.S. average: | 219.5 |
Travel time to work (commute)
![Travel time to work (commute)]()
- 1Less than 5 minutes
- 45 to 9 minutes
- 410 to 14 minutes
- 815 to 19 minutes
- 1320 to 24 minutes
- 225 to 29 minutes
- 1030 to 34 minutes
- 135 to 39 minutes
- 540 to 44 minutes
- 2445 to 59 minutes
- 1060 to 89 minutes
- 490 or more minutes

Means of transportation to work
![Means of transportation to work]()
- 51.0%60Drove a car alone
- 3.4%4Carpooled
- 0.9%1Bus
- 12.8%15Subway or elevated rail
- 1.7%2Long-distance train or commuter rail
- 1.7%2Light rail, streetcar or trolley
- 0.9%1Walked
- 3.4%4Other means
- 26.4%31Worked at home

Time leaving home to go to work
![Time leaving home to go to work]()
- 512:00 a.m. to 4:59 a.m.
- 105:00 a.m. to 5:29 a.m.
- 15:30 a.m. to 5:59 a.m.
- 26:00 a.m. to 6:29 a.m.
- 56:30 a.m. to 6:59 a.m.
- 137:00 a.m. to 7:29 a.m.
- 167:30 a.m. to 7:59 a.m.
- 188:00 a.m. to 8:29 a.m.
- 38:30 a.m. to 8:59 a.m.
- 109:00 a.m. to 9:59 a.m.
- 210:00 a.m. to 10:59 a.m.
- 111:00 a.m. to 11:59 a.m.
- 312:00 p.m. to 3:59 p.m.
- 24:00 p.m. to 11:59 p.m.

Occupations of males:
- Percentage of males in management occupations (except farmers):
Here: 32.1% city: 34.1%
- Percentage of males in business and financial operations occupations:
Here: 9.1% city: 10.7%
- Percentage of males in computer and mathematical occupations:
Here: 2.7% city: 4.2%
- Percentage of males in architecture and engineering occupations:
Here: 6.0% city: 4.1%
- Percentage of males in life, physical, and social science occupations:
Here: 4.2% city: 4.8%
- Percentage of males in legal occupations:
Here: 2.4% city: 6.7%
- Percentage of males in education, training, and library occupations:
Here: 9.6% city: 2.6%
- Percentage of males in arts, design, entertainment, sports, and media occupations:
Here: 12.2% city: 4.0%
- Percentage of males in healthcare practitioners and technical occupations:
Here: 1.7% city: 4.3%
- Percentage of males in service occupations:
Here: 7.7% city: 6.0%
- Percentage of males in sales and office occupations:
Here: 9.8% city: 11.4%
- Percentage of males in transportation occupations:
Here: 1.3% city: 3.4%
Occupations of females:
- Percentage of females in management occupations (except farmers):
Here: 23.5% city: 15.1%
- Percentage of females in business and financial operations occupations:
Here: 8.5% city: 10.2%
- Percentage of females in computer and mathematical occupations:
Here: 2.5% city: 5.9%
- Percentage of females in life, physical, and social science occupations:
Here: 1.5% city: 5.4%
- Percentage of females in community and social services occupations:
Here: 3.6% city: 4.3%
- Percentage of females in legal occupations:
Here: 12.3% city: 7.8%
- Percentage of females in education, training, and library occupations:
Here: 6.0% city: 13.6%
- Percentage of females in arts, design, entertainment, sports, and media occupations:
Here: 11.6% city: 8.8%
- Percentage of females in healthcare practitioners and technical occupations:
Here: 13.9% city: 11.5%
- Percentage of females in service occupations:
Here: 4.3% city: 7.1%
- Percentage of females in sales and office occupations:
Here: 9.9% city: 8.1%
- Percentage of females in construction, extraction, and maintenance occupations:
Here: 2.5% city: 0.3%
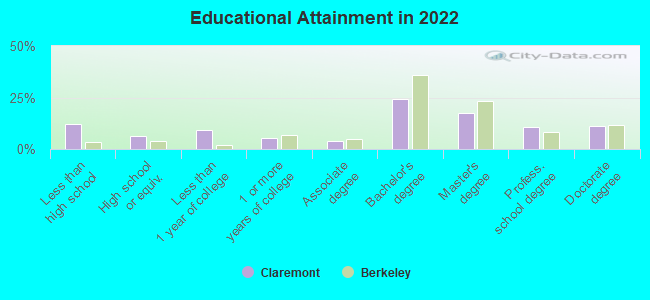
Education in this neighborhood (subdivision or community):
- Percentage of people 3 years and older in K-12 schools:
Claremont: 23.7% Orinda: 20.8%
- Percentage of people 3 years and older in undergraduate colleges:
Claremont: 2.3% Orinda: 3.5%
- Percentage of people 3 years and older in grad. or professional schools:
Claremont: 1.1% Orinda: 1.3%
- Percentage of students K-12 enrolled in private schools:
Claremont: 22.2% Orinda: 7.3%
Percentage of population below poverty level:
| Claremont: | 2.7% |
| Orinda: | 2.1% |
Median year owner moved in (as recorded in 2022):
| Claremont: | 2008 |
| Orinda: | 2005 |
Percentage of married-couple families with both working:
| Claremont: | 69.2% |
| Orinda: | 71.9% |
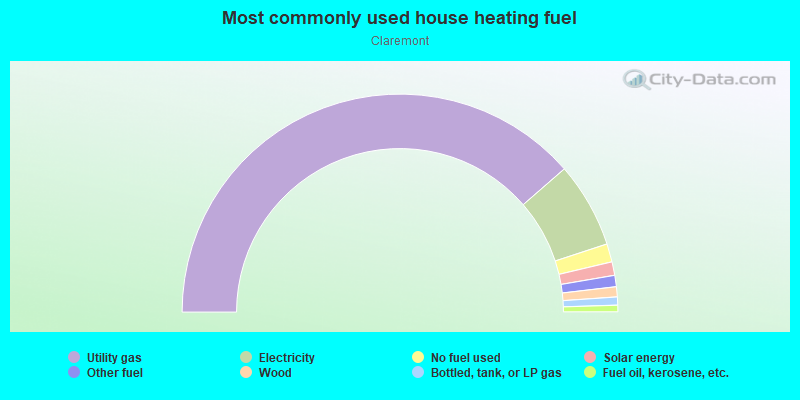
- 77.7%Utility gas
- 12.8%Electricity
- 6.2%No fuel used
- 2.5%Solar energy
- 0.9%Fuel oil, kerosene, etc.
Roads and streets:
Cam Pablo
Length: 1.32 miles
Directions: E-W, SE-NW, SW-NE
Address range: 130 to 299
Directions: E-W, SE-NW, SW-NE
Address range: 130 to 299
Canon Dr
Length: 0.84 miles
Directions: E-W, N-S, SE-NW, SW-NE
Address range: 100 to 299
Directions: E-W, N-S, SE-NW, SW-NE
Address range: 100 to 299
Monte Vista Rd
Length: 0.71 miles
Directions: E-W, N-S, SE-NW, SW-NE
Address range: 1 to 199
Directions: E-W, N-S, SE-NW, SW-NE
Address range: 1 to 199
Claremont Ave
Length: 0.57 miles
Directions: E-W, N-S, SE-NW, SW-NE
Address range: 1 to 198
Directions: E-W, N-S, SE-NW, SW-NE
Address range: 1 to 198
Holly Ln
Length: 0.43 miles
Directions: E-W, N-S, SE-NW, SW-NE
Address range: 100 to 299
Directions: E-W, N-S, SE-NW, SW-NE
Address range: 100 to 299
Crescent Dr
Length: 0.41 miles
Directions: E-W, SW-NE
Address range: 1 to 298
Directions: E-W, SW-NE
Address range: 1 to 298
Ardilla Rd
Length: 0.38 miles
Directions: E-W, N-S, SE-NW, SW-NE
Address range: 1 to 99
Directions: E-W, N-S, SE-NW, SW-NE
Address range: 1 to 99
Monte Vista Ridge Rd
Length: 0.24 miles
Directions: E-W, N-S, SE-NW, SW-NE
Address range: 200 to 299
Directions: E-W, N-S, SE-NW, SW-NE
Address range: 200 to 299
California Ave
Length: 0.23 miles
Directions: E-W, SE-NW
Address range: 1 to 99
Directions: E-W, SE-NW
Address range: 1 to 99
Marston Rd
Length: 0.22 miles
Directions: E-W, N-S, SE-NW, SW-NE
Address range: 1 to 99
Directions: E-W, N-S, SE-NW, SW-NE
Address range: 1 to 99
North Ln
Length: 0.19 miles
Directions: E-W, N-S, SW-NE
Address range: 1 to 99
Directions: E-W, N-S, SW-NE
Address range: 1 to 99
Berkeley Ave
Length: 0.19 miles
Direction: SE-NW
Address range: 1 to 99
Direction: SE-NW
Address range: 1 to 99
Stanton Ct
Length: 0.17 miles
Directions: E-W, SE-NW, SW-NE
Address range: 1 to 99
Directions: E-W, SE-NW, SW-NE
Address range: 1 to 99
Rich Acres Rd
Length: 0.17 miles
Directions: E-W, SE-NW
Address range: 1 to 198
Directions: E-W, SE-NW
Address range: 1 to 198
Stanton Ave
Length: 0.16 miles
Directions: E-W, SE-NW
Address range: 1 to 99
Directions: E-W, SE-NW
Address range: 1 to 99
Piedmont Ave
Length: 0.11 miles
Directions: E-W, N-S, SE-NW, SW-NE
Address range: 1 to 99
Directions: E-W, N-S, SE-NW, SW-NE
Address range: 1 to 99
Los Amigos Ct
Length: 0.11 miles
Directions: E-W, N-S, SW-NE
Address range: 1 to 39
Directions: E-W, N-S, SW-NE
Address range: 1 to 39
Solbrae Way
Length: 0.08 miles
Directions: E-W, SW-NE
Address range: 1 to 16
Directions: E-W, SW-NE
Address range: 1 to 16
Via Corte
Length: 0.07 miles
Directions: N-S, SW-NE
Address range: 1 to 99
Directions: N-S, SW-NE
Address range: 1 to 99
Stanton Ter
Length: 0.07 miles
Directions: N-S, SE-NW
Address range: 200 to 299
Directions: N-S, SE-NW
Address range: 200 to 299
Oakmont Dr (Oakmont Dr)
Length: 0.05 miles
Direction: SE-NW
Direction: SE-NW
Redwood Ter
Length: 0.04 miles
Directions: E-W, SE-NW
Address range: 1 to 99
Directions: E-W, SE-NW
Address range: 1 to 99
Rose Ln
Length: 0.03 miles
Direction: SE-NW
Address range: 1 to 99
Direction: SE-NW
Address range: 1 to 99