Downtown neighborhood in Blacksburg, Virginia (VA), 24060 detailed profile
Settings
X


Business Search - 14 Million verified businesses
Area: 0.201 square miles
Population: 843
Population density:
| Downtown: | 4,191 people per square mile |
| Blacksburg: | 2,332 people per square mile |

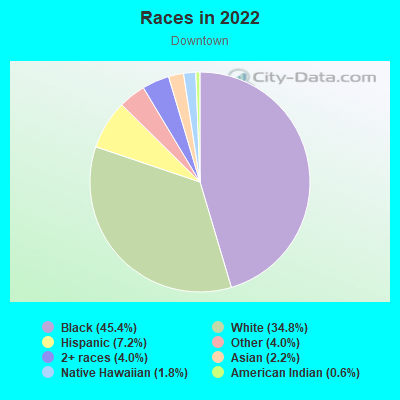
- 62758.8%White
- 14713.8%Some other race
- 11811.1%Black
- 807.5%Two or more races
- 716.7%Asian
- 181.7%Hispanic or Latino
- 60.6%American Indian

Distribution of median household income
![Distribution of median household income]()
- 47Less than $10,000
- 22$10,000 to $19,999
- 45$20,000 to $29,999
- 75$30,000 to $39,999
- 22$40,000 to $49,999
- 10$50,000 to $59,999
- 16$60,000 to $74,999
- 21$75,000 to $99,999
- 16$100,000 to $124,999
- 69$125,000 to $149,999
- 39$150,000 to $199,999
- 24$200,000 or more

Distribution of owner-occupied house/condo value
![Distribution of owner-occupied house/condo value]()
- 4$100,000 to $149,999
- 8$150,000 to $199,999
- 13$200,000 to $249,999
- 25$250,000 to $299,999
- 37$300,000 to $399,999
- 19$400,000 to $499,999
- 28$500,000 to $749,999
- 13$750,000 to $999,999
- 2$1,000,000 or more

Distribution of rent paid by renters
![Distribution of rent paid by renters]()
- 17$200 to $299
- 4$400 to $499
- 26$500 to $599
- 8$600 to $699
- 81$700 to $799
- 36$800 to $899
- 9$900 to $999
- 40$1,000 to $1,249
- 79$1,250 to $1,499
- 19$1,500 to $1,999
- 95$2,000 or more

| Males: | 511 |
| Females: | 331 |
Males:
| This neighborhood: | 21.3 years |
| Whole city: | 21.6 years |
| This neighborhood: | 25.1 years |
| Whole city: | 21.8 years |
Percentage of family households:
| Downtown: | 25.5% |
| Blacksburg: | 26.3% |
| Here: | 32.4% |
| Blacksburg: | 31.1% |
Percentage of married-couple families with children (among all households):
| Downtown: | 36.7% |
| Blacksburg: | 25.9% |
Percentage of single-mother households (among all households):
| Downtown: | 3.4% |
| Blacksburg: | 2.9% |
Percentage of never married males 15 years old and over:
Percentage of never married females 15 years old and over:
| Downtown: | 45.2% |
| Blacksburg: | 42.8% |
Percentage of never married females 15 years old and over:
| Downtown: | 23.8% |
| town: | 30.2% |
Percentage of people that speak English not well or not at all:
| Downtown: | 3.1% |
| Blacksburg: | 0.4% |
Percentage of people born in this state:
Percentage of people born in another U.S. state:
Percentage of native residents but born outside the U.S.:
Percentage of foreign born residents:
| Here: | 43.2% |
| Blacksburg: | 46.3% |
Percentage of people born in another U.S. state:
| Downtown: | 41.2% |
| Blacksburg: | 39.2% |
Percentage of native residents but born outside the U.S.:
| Here: | 3.9% |
| town: | 1.5% |
Percentage of foreign born residents:
| Here: | 11.7% |
| Blacksburg: | 13.1% |
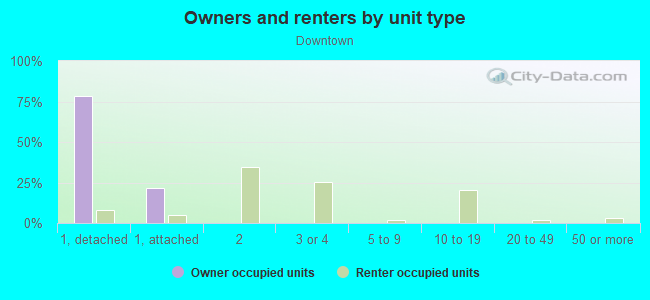
Owner-occupied
Renter-occupied

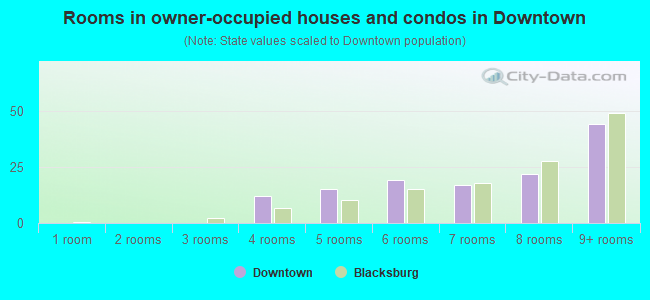
- Rooms in owner-occupied houses and condos in Downtown
- 01 room
- 02 rooms
- 03 rooms
- 124 rooms
- 155 rooms
- 196 rooms
- 177 rooms
- 228 rooms
- 449+ rooms
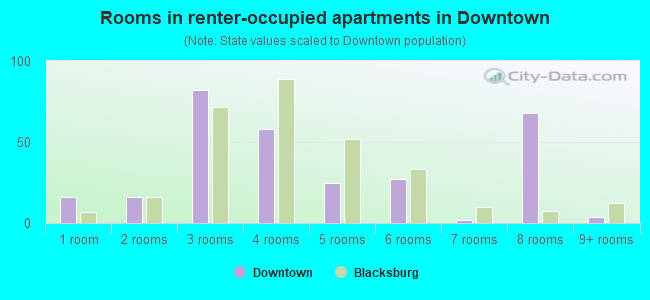
- Rooms in renter-occupied apartments in Downtown
- 161 room
- 162 rooms
- 823 rooms
- 584 rooms
- 255 rooms
- 276 rooms
- 27 rooms
- 688 rooms
- 49+ rooms
Owner-occupied
Renter-occupied
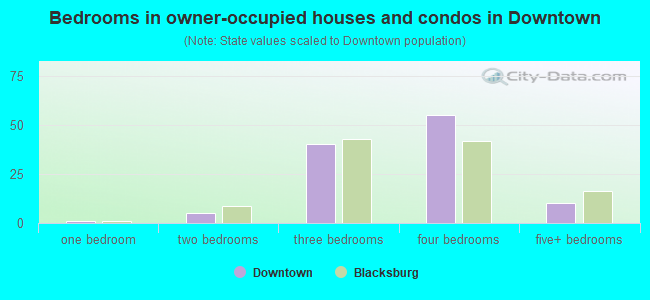
- Bedrooms in owner-occupied houses and condos in Downtown
- 0no bedroom
- 11 bedroom
- 52 bedrooms
- 403 bedrooms
- 554 bedrooms
- 105+ bedrooms
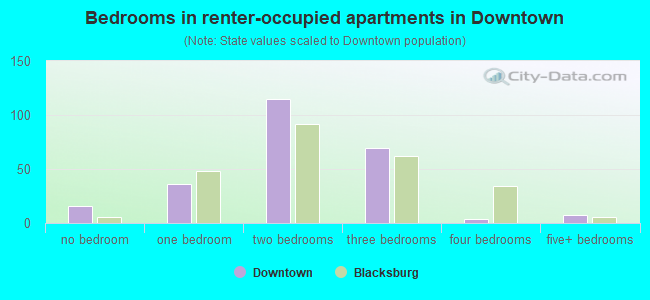
- Bedrooms in renter-occupied apartments in Downtown
- 16no bedroom
- 361 bedroom
- 1152 bedrooms
- 693 bedrooms
- 44 bedrooms
- 75+ bedrooms
Average number of cars or other vehicles available in houses/condos:
Average number of cars or other vehicles available in apartments:
| This neighborhood: | |
| Blacksburg: |
Average number of cars or other vehicles available in apartments:
| Here: | |
| town: |
Percentage of units with a mortgage:
| Downtown: | 38.9% |
| Blacksburg: | 52.1% |
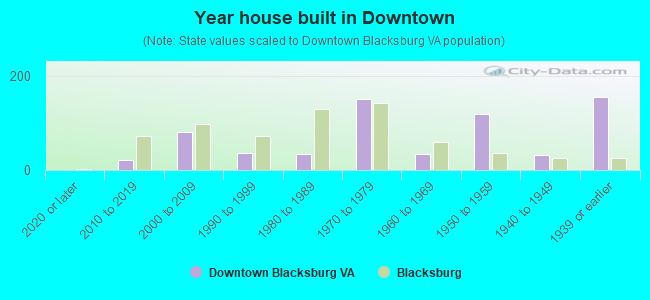
- Year house built in Downtown
- 12020 or later
- 222010 to 2019
- 812000 to 2009
- 361990 to 1999
- 341980 to 1989
- 1521970 to 1979
- 341960 to 1969
- 1201950 to 1959
- 321940 to 1949
- 1551939 or earlier
City-data.com crime index for town in 2020 (higher means more crime):
| City: | 62.3 |
| U.S. average: | 219.5 |
Travel time to work (commute)
![Travel time to work (commute)]()
- 24Less than 5 minutes
- 1435 to 9 minutes
- 29210 to 14 minutes
- 11315 to 19 minutes
- 6120 to 24 minutes
- 425 to 29 minutes
- 5330 to 34 minutes
- 1035 to 39 minutes
- 1440 to 44 minutes
- 3645 to 59 minutes
- 960 to 89 minutes
- 390 or more minutes

Means of transportation to work
![Means of transportation to work]()
- 75.4%340Drove a car alone
- 11.5%52Carpooled
- 0.7%3Subway or elevated rail
- 4.0%18Bicycle
- 30.2%136Walked
- 2.4%11Other means
- 14.9%67Worked at home

Time leaving home to go to work
![Time leaving home to go to work]()
- 1712:00 a.m. to 4:59 a.m.
- 15:00 a.m. to 5:29 a.m.
- 15:30 a.m. to 5:59 a.m.
- 66:00 a.m. to 6:29 a.m.
- 206:30 a.m. to 6:59 a.m.
- 437:00 a.m. to 7:29 a.m.
- 667:30 a.m. to 7:59 a.m.
- 1518:00 a.m. to 8:29 a.m.
- 1048:30 a.m. to 8:59 a.m.
- 1069:00 a.m. to 9:59 a.m.
- 2210:00 a.m. to 10:59 a.m.
- 2711:00 a.m. to 11:59 a.m.
- 9712:00 p.m. to 3:59 p.m.
- 714:00 p.m. to 11:59 p.m.

Occupations of males:
- Percentage of males in management occupations (except farmers):
Here: 18.7% town: 9.2%
- Percentage of males in business and financial operations occupations:
Here: 3.1% town: 2.8%
- Percentage of males in computer and mathematical occupations:
Here: 6.3% town: 8.5%
- Percentage of males in architecture and engineering occupations:
Here: 3.5% town: 4.1%
- Percentage of males in life, physical, and social science occupations:
Here: 2.9% town: 7.6%
- Percentage of males in community and social services occupations:
Here: 1.8% town: 1.3%
- Percentage of males in education, training, and library occupations:
Here: 35.4% town: 21.1%
- Percentage of males in arts, design, entertainment, sports, and media occupations:
Here: 6.8% town: 2.0%
- Percentage of males in service occupations:
Here: 8.6% town: 20.2%
- Percentage of males in sales and office occupations:
Here: 7.5% town: 11.8%
- Percentage of males in production occupations:
Here: 2.9% town: 1.7%
- Percentage of males in transportation occupations:
Here: 3.4% town: 0.8%
Occupations of females:
- Percentage of females in management occupations (except farmers):
Here: 16.4% town: 6.7%
- Percentage of females in business and financial operations occupations:
Here: 6.6% town: 2.1%
- Percentage of females in computer and mathematical occupations:
Here: 2.0% town: 2.5%
- Percentage of females in architecture and engineering occupations:
Here: 4.7% town: 1.8%
- Percentage of females in community and social services occupations:
Here: 3.7% town: 3.4%
- Percentage of females in education, training, and library occupations:
Here: 19.7% town: 26.2%
- Percentage of females in healthcare practitioners and technical occupations:
Here: 13.0% town: 4.9%
- Percentage of females in service occupations:
Here: 8.3% town: 17.8%
- Percentage of females in sales and office occupations:
Here: 44.2% town: 23.8%
Percentage of people 16-64 in Armed Forces:
| Downtown: | 0.2% |
| Blacksburg: | 0.2% |
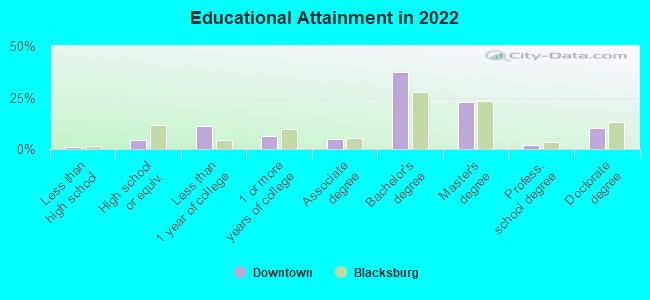
Education in this neighborhood (subdivision or community):
- Percentage of people 3 years and older in K-12 schools:
Downtown: 13.9% Blacksburg: 6.9%
- Percentage of people 3 years and older in undergraduate colleges:
Downtown: 30.2% Blacksburg: 52.6%
- Percentage of people 3 years and older in grad. or professional schools:
Downtown: 7.5% Blacksburg: 6.2%
- Percentage of students K-12 enrolled in private schools:
Downtown: 9.4% Blacksburg: 6.7%
Percentage of population below poverty level:
| Downtown: | 21.5% |
| Blacksburg: | 45.1% |
Percentage of married-couple families with both working:
| Downtown: | 100.0% |
| Blacksburg: | 63.5% |
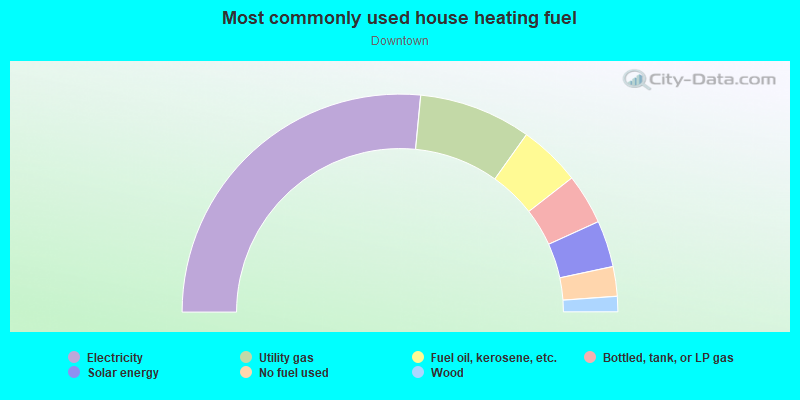
- 53.1%Electricity
- 16.7%Utility gas
- 9.2%Fuel oil, kerosene, etc.
- 7.5%Bottled, tank, or LP gas
- 6.9%Solar energy
- 4.4%No fuel used
- 2.3%Wood
Highways in this neighborhood:
N Main St (US Hwy 460 Bus)
Length: 0.60 miles
Directions: N-S, SE-NW, SW-NE
Address range: 100 to 699
Directions: N-S, SE-NW, SW-NE
Address range: 100 to 699
S Main St (US Hwy 460 Bus)
Length: 0.28 miles
Direction: SE-NW
Address range: 100 to 509
Direction: SE-NW
Address range: 100 to 509
Roads and streets:
Turner St NW (State Rte 412)
Length: 0.34 miles
Directions: E-W, SE-NW, SW-NE
Address range: 100 to 433
Directions: E-W, SE-NW, SW-NE
Address range: 100 to 433
Eheart St SE
Length: 0.32 miles
Direction: SW-NE
Address range: 201 to 1006
Direction: SW-NE
Address range: 201 to 1006
Washington St SW
Length: 0.27 miles
Direction: SW-NE
Address range: 100 to 399
Direction: SW-NE
Address range: 100 to 399
Draper Rd SW
Length: 0.27 miles
Direction: SE-NW
Address range: 100 to 499
Direction: SE-NW
Address range: 100 to 499
Otey St
Length: 0.26 miles
Direction: SE-NW
Address range: 200 to 215
Direction: SE-NW
Address range: 200 to 215
Clay St SW
Length: 0.24 miles
Direction: SW-NE
Address range: 100 to 399
Direction: SW-NE
Address range: 100 to 399
Church St SE
Length: 0.21 miles
Direction: SE-NW
Address range: 100 to 399
Direction: SE-NW
Address range: 100 to 399
Gilbert St
Length: 0.20 miles
Directions: E-W, N-S, SE-NW, SW-NE
Address range: 200 to 219
Directions: E-W, N-S, SE-NW, SW-NE
Address range: 200 to 219
Miller Ave
Length: 0.19 miles
Direction: SW-NE
Direction: SW-NE
W Roanoke St
Length: 0.19 miles
Direction: SW-NE
Address range: 100 to 299
Direction: SW-NE
Address range: 100 to 299
Kent St
Length: 0.14 miles
Direction: SE-NW
Direction: SE-NW
Wall St
Length: 0.13 miles
Direction: SW-NE
Address range: 200 to 299
Direction: SW-NE
Address range: 200 to 299
Barger St
Length: 0.11 miles
Directions: N-S, SE-NW, SW-NE
Address range: 200 to 299
Directions: N-S, SE-NW, SW-NE
Address range: 200 to 299
Clay St SE
Length: 0.10 miles
Direction: SW-NE
Address range: 402 to 409
Direction: SW-NE
Address range: 402 to 409
Ingles Ct
Length: 0.09 miles
Directions: N-S, SE-NW, SW-NE
Address range: 400 to 409
Directions: N-S, SE-NW, SW-NE
Address range: 400 to 409
Church St NE
Length: 0.07 miles
Direction: SE-NW
Address range: 100 to 199
Direction: SE-NW
Address range: 100 to 199
Jackson St NW
Length: 0.07 miles
Direction: SW-NE
Address range: 100 to 199
Direction: SW-NE
Address range: 100 to 199
Washington St SE
Length: 0.07 miles
Direction: SW-NE
Address range: 100 to 199
Direction: SW-NE
Address range: 100 to 199
Draper Rd NW
Length: 0.07 miles
Direction: SE-NW
Address range: 100 to 199
Direction: SE-NW
Address range: 100 to 199
Lee St
Length: 0.07 miles
Direction: SW-NE
Address range: 100 to 199
Direction: SW-NE
Address range: 100 to 199
Clay St
Length: 0.07 miles
Direction: SW-NE
Address range: 100 to 199
Direction: SW-NE
Address range: 100 to 199
E Roanoke St
Length: 0.07 miles
Direction: SW-NE
Address range: 100 to 199
Direction: SW-NE
Address range: 100 to 199
Jackson St NE
Length: 0.07 miles
Direction: SW-NE
Address range: 100 to 199
Direction: SW-NE
Address range: 100 to 199
Lee St SW
Length: 0.06 miles
Direction: SW-NE
Direction: SW-NE
Clay Cir
Length: 0.06 miles
Direction: SE-NW
Address range: 400 to 413
Direction: SE-NW
Address range: 400 to 413
Turner St NE
Length: 0.05 miles
Direction: SW-NE
Address range: 100 to 127
Direction: SW-NE
Address range: 100 to 127
Collegiate Ct
Length: 0.04 miles
Direction: SW-NE
Address range: 100 to 199
Direction: SW-NE
Address range: 100 to 199
Giles Rd
Length: 0.03 miles
Direction: SW-NE
Direction: SW-NE