Dutch Village neighborhood in Newport News, Virginia (VA), 23601 detailed profile
Settings
X


Business Search - 14 Million verified businesses
Area: 0.363 square miles
Population: 736
Population density:
| Dutch Village: | 2,029 people per square mile |
| Newport News: | 2,699 people per square mile |

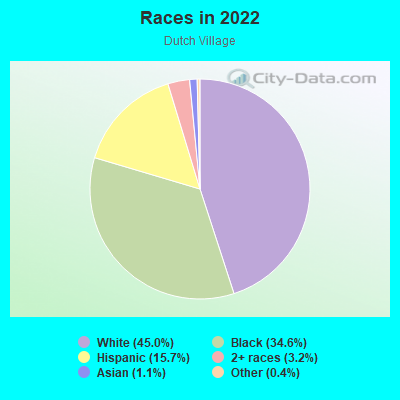
- 33645.0%White
- 25834.6%Black
- 11715.7%Hispanic or Latino
- 243.2%Two or more races
- 81.1%Asian
- 30.4%Some other race
Median household income in 2022:
| Dutch Village: | $67,614 |
| Newport News: | $64,102 |
Distribution of median household income
![Distribution of median household income]()
- 29Less than $10,000
- 43$10,000 to $19,999
- 17$20,000 to $29,999
- 35$30,000 to $39,999
- 50$40,000 to $49,999
- 102$50,000 to $59,999
- 43$60,000 to $74,999
- 8$75,000 to $99,999
- 11$100,000 to $124,999
- 7$125,000 to $149,999
- 47$150,000 to $199,999
- 59$200,000 or more

Distribution of owner-occupied house/condo value
![Distribution of owner-occupied house/condo value]()
- 13Less than $50,000
- 11$50,000 to $99,999
- 43$100,000 to $149,999
- 57$150,000 to $199,999
- 19$200,000 to $249,999
- 11$250,000 to $299,999
- 6$300,000 to $399,999
- 7$400,000 to $499,999
- 8$500,000 to $749,999
- 6$750,000 to $999,999
- 2$1,000,000 or more

Distribution of rent paid by renters
![Distribution of rent paid by renters]()
- 9Less than $100
- 7$400 to $499
- 12$500 to $599
- 9$600 to $699
- 12$700 to $799
- 20$800 to $899
- 108$900 to $999
- 80$1,000 to $1,249
- 40$1,250 to $1,499
- 6$1,500 to $1,999
- 5$2,000 or more

Median rent in 2022:
| Dutch Village: | $987 |
| Newport News: | $1,013 |
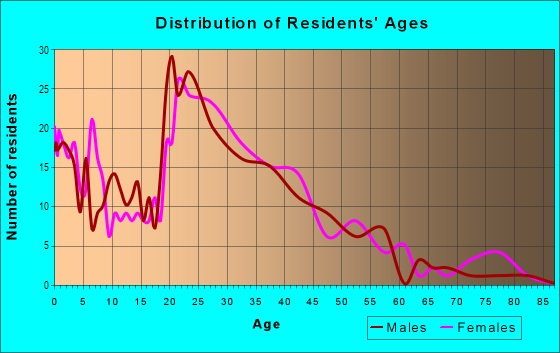
| Males: | 325 |
| Females: | 411 |
Males:
| This neighborhood: | 42.5 years |
| Whole city: | 32.8 years |
| This neighborhood: | 33.7 years |
| Whole city: | 35.9 years |
Average household size:
| Dutch Village: | 2.1 people |
| Newport News: | 2.4 people |
Percentage of family households:
| Dutch Village: | 37.5% |
| Newport News: | 43.1% |
| Here: | 31.4% |
| Newport News: | 36.0% |
Percentage of married-couple families with children (among all households):
| Dutch Village: | 32.5% |
| Newport News: | 23.0% |
Percentage of single-mother households (among all households):
| Dutch Village: | 19.9% |
| Newport News: | 14.6% |
Percentage of never married males 15 years old and over:
Percentage of never married females 15 years old and over:
| Dutch Village: | 9.7% |
| Newport News: | 21.4% |
Percentage of never married females 15 years old and over:
| Dutch Village: | 21.4% |
| city: | 19.2% |
Percentage of people that speak English not well or not at all:
| Dutch Village: | 0.0% |
| Newport News: | 1.4% |
Percentage of people born in this state:
Percentage of people born in another U.S. state:
Percentage of native residents but born outside the U.S.:
Percentage of foreign born residents:
| Here: | 48.2% |
| Newport News: | 52.5% |
Percentage of people born in another U.S. state:
| Dutch Village: | 41.0% |
| Newport News: | 36.1% |
Percentage of native residents but born outside the U.S.:
| Here: | 6.6% |
| city: | 3.4% |
Percentage of foreign born residents:
| Here: | 4.3% |
| Newport News: | 8.1% |
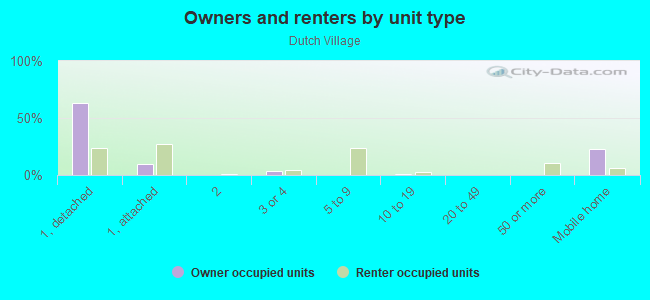
Owner-occupied
Renter-occupied

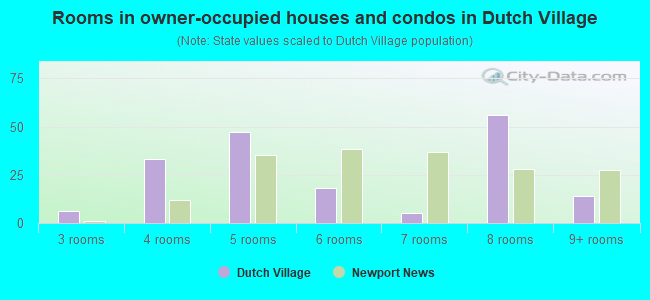
- Rooms in owner-occupied houses and condos in Dutch Village
- 01 room
- 02 rooms
- 63 rooms
- 334 rooms
- 475 rooms
- 186 rooms
- 57 rooms
- 568 rooms
- 149+ rooms
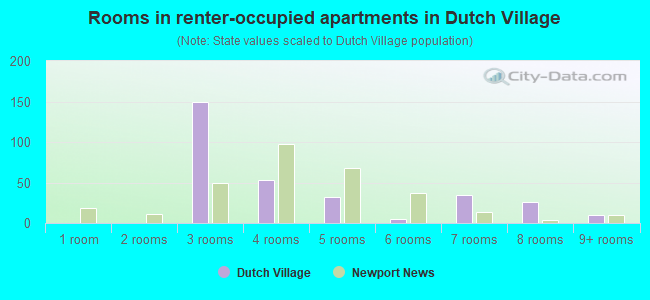
- Rooms in renter-occupied apartments in Dutch Village
- 01 room
- 02 rooms
- 1493 rooms
- 534 rooms
- 325 rooms
- 56 rooms
- 347 rooms
- 268 rooms
- 109+ rooms
Owner-occupied
Renter-occupied
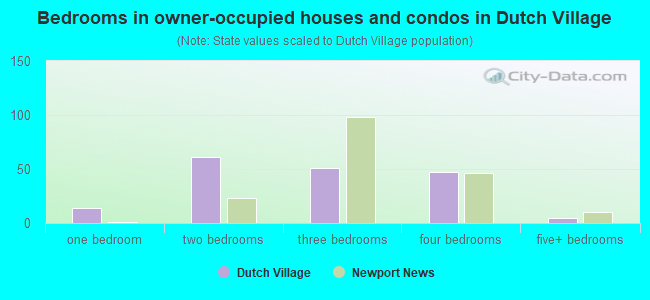
- Bedrooms in owner-occupied houses and condos in Dutch Village
- 0no bedroom
- 141 bedroom
- 612 bedrooms
- 513 bedrooms
- 474 bedrooms
- 55+ bedrooms
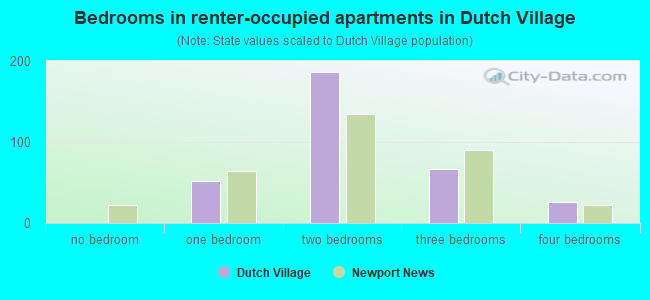
- Bedrooms in renter-occupied apartments in Dutch Village
- 0no bedroom
- 521 bedroom
- 1872 bedrooms
- 673 bedrooms
- 264 bedrooms
- 05+ bedrooms
Average number of cars or other vehicles available in houses/condos:
Average number of cars or other vehicles available in apartments:
| This neighborhood: | 1.7 |
| Newport News: | 2.1 |
Average number of cars or other vehicles available in apartments:
| Here: | 1.3 |
| city: | 1.3 |
Percentage of units with a mortgage:
| Dutch Village: | 67.8% |
| Newport News: | 70.0% |
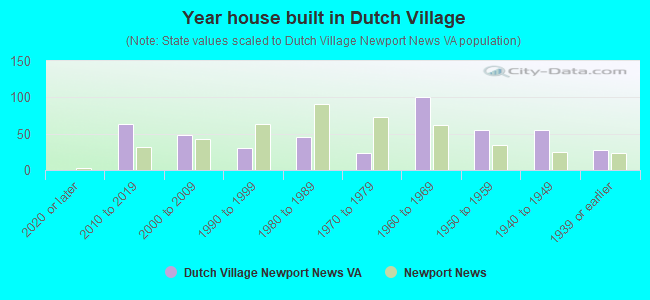
- Year house built in Dutch Village
- 02020 or later
- 632010 to 2019
- 482000 to 2009
- 301990 to 1999
- 461980 to 1989
- 241970 to 1979
- 1001960 to 1969
- 551950 to 1959
- 551940 to 1949
- 281939 or earlier
City-data.com crime index for city in 2020 (higher means more crime):
| City: | 274.6 |
| U.S. average: | 219.5 |
Travel time to work (commute)
![Travel time to work (commute)]()
- 12Less than 5 minutes
- 315 to 9 minutes
- 5710 to 14 minutes
- 2815 to 19 minutes
- 5320 to 24 minutes
- 1625 to 29 minutes
- 4130 to 34 minutes
- 735 to 39 minutes
- 1040 to 44 minutes
- 1345 to 59 minutes
- 760 to 89 minutes
- 6090 or more minutes

Means of transportation to work
![Means of transportation to work]()
- 69.9%274Drove a car alone
- 8.2%32Carpooled
- 0.3%1Bus
- 2.0%8Taxi
- 18.4%72Bicycle
- 4.1%16Walked
- 1.0%4Other means
- 14.3%56Worked at home

Time leaving home to go to work
![Time leaving home to go to work]()
- 1512:00 a.m. to 4:59 a.m.
- 145:00 a.m. to 5:29 a.m.
- 155:30 a.m. to 5:59 a.m.
- 306:00 a.m. to 6:29 a.m.
- 266:30 a.m. to 6:59 a.m.
- 297:00 a.m. to 7:29 a.m.
- 427:30 a.m. to 7:59 a.m.
- 328:00 a.m. to 8:29 a.m.
- 138:30 a.m. to 8:59 a.m.
- 339:00 a.m. to 9:59 a.m.
- 910:00 a.m. to 10:59 a.m.
- 2012:00 p.m. to 3:59 p.m.
- 24:00 p.m. to 11:59 p.m.

Occupations of males:
- Percentage of males in management occupations (except farmers):
Here: 24.8% city: 8.6%
- Percentage of males in business and financial operations occupations:
Here: 7.8% city: 3.5%
- Percentage of males in computer and mathematical occupations:
Here: 1.4% city: 5.6%
- Percentage of males in architecture and engineering occupations:
Here: 5.3% city: 4.7%
- Percentage of males in education, training, and library occupations:
Here: 2.5% city: 2.9%
- Percentage of males in healthcare practitioners and technical occupations:
Here: 2.1% city: 1.2%
- Percentage of males in service occupations:
Here: 5.7% city: 15.8%
- Percentage of males in sales and office occupations:
Here: 24.5% city: 13.9%
- Percentage of males in construction, extraction, and maintenance occupations:
Here: 12.5% city: 10.8%
- Percentage of males in production occupations:
Here: 17.0% city: 9.7%
Occupations of females:
- Percentage of females in business and financial operations occupations:
Here: 3.9% city: 4.7%
- Percentage of females in computer and mathematical occupations:
Here: 3.0% city: 2.2%
- Percentage of females in architecture and engineering occupations:
Here: 1.1% city: 1.0%
- Percentage of females in community and social services occupations:
Here: 3.3% city: 3.9%
- Percentage of females in education, training, and library occupations:
Here: 2.8% city: 8.8%
- Percentage of females in service occupations:
Here: 27.2% city: 22.8%
- Percentage of females in sales and office occupations:
Here: 57.1% city: 27.1%
- Percentage of females in production occupations:
Here: 7.4% city: 4.7%
Percentage of people 16-64 in Armed Forces:
| Dutch Village: | 6.8% |
| Newport News: | 8.2% |
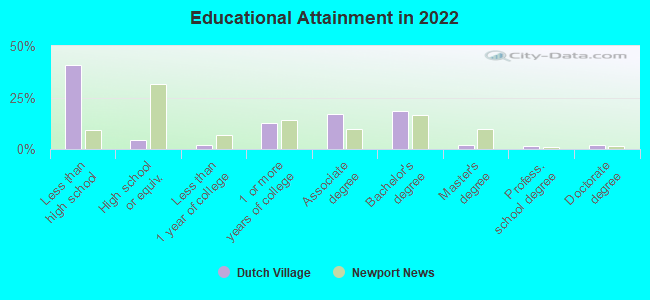
Education in this neighborhood (subdivision or community):
- Percentage of people 3 years and older in K-12 schools:
Dutch Village: 16.4% Newport News: 17.3%
- Percentage of people 3 years and older in undergraduate colleges:
Dutch Village: 5.3% Newport News: 5.4%
- Percentage of people 3 years and older in grad. or professional schools:
Dutch Village: 4.5% Newport News: 1.6%
- Percentage of students K-12 enrolled in private schools:
Dutch Village: 64.8% Newport News: 9.9%
Percentage of population below poverty level:
| Dutch Village: | 12.2% |
| Newport News: | 16.9% |
Median year owner moved in (as recorded in 2022):
Median year renter moved in (as recorded in 2022):
| Dutch Village: | 2007 |
| Newport News: | 2009 |
Median year renter moved in (as recorded in 2022):
| Dutch Village: | 2016 |
| Newport News: | 2020 |
Percentage of married-couple families with both working:
| Dutch Village: | 90.0% |
| Newport News: | 67.5% |
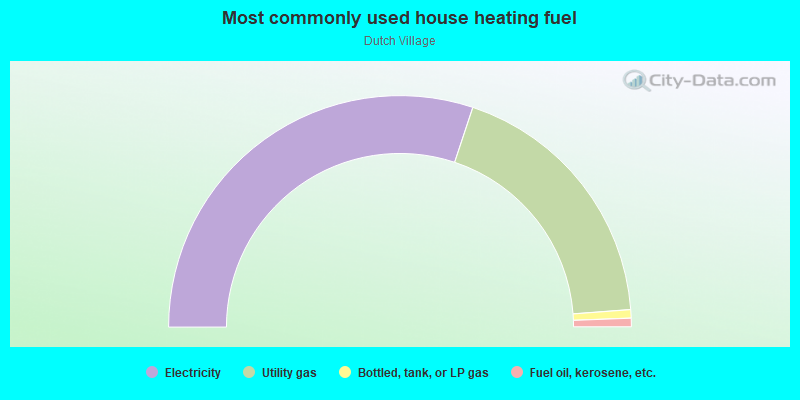
- 60.2%Electricity
- 37.4%Utility gas
- 1.2%Bottled, tank, or LP gas
- 1.2%Fuel oil, kerosene, etc.
Roads and streets:
Gatewood Rd
Length: 0.51 miles
Directions: E-W, SE-NW
Address range: 1200 to 1631
Directions: E-W, SE-NW
Address range: 1200 to 1631
Logan Pl
Length: 0.48 miles
Directions: E-W, N-S, SE-NW, SW-NE
Address range: 401 to 595
Directions: E-W, N-S, SE-NW, SW-NE
Address range: 401 to 595
Export Cir
Length: 0.39 miles
Directions: E-W, N-S, SE-NW, SW-NE
Address range: 400 to 443
Directions: E-W, N-S, SE-NW, SW-NE
Address range: 400 to 443
Nelson Dr
Length: 0.32 miles
Directions: E-W, N-S, SE-NW, SW-NE
Directions: E-W, N-S, SE-NW, SW-NE
Harpersville Rd
Length: 0.28 miles
Directions: N-S, SW-NE
Address range: 18 to 99
Directions: N-S, SW-NE
Address range: 18 to 99
Copeland Ln
Length: 0.19 miles
Direction: SW-NE
Address range: 1 to 67
Direction: SW-NE
Address range: 1 to 67
Commodore Dr E
Length: 0.17 miles
Directions: E-W, SE-NW, SW-NE
Address range: 1 to 24
Directions: E-W, SE-NW, SW-NE
Address range: 1 to 24
Fontaine Rd
Length: 0.16 miles
Direction: SW-NE
Address range: 1 to 20
Direction: SW-NE
Address range: 1 to 20
Commodore Dr W
Length: 0.15 miles
Directions: N-S, SE-NW, SW-NE
Address range: 1 to 21
Directions: N-S, SE-NW, SW-NE
Address range: 1 to 21
Kingsmill Dr
Length: 0.13 miles
Directions: E-W, SE-NW, SW-NE
Address range: 400 to 449
Directions: E-W, SE-NW, SW-NE
Address range: 400 to 449
Matthew Rd
Length: 0.08 miles
Direction: SW-NE
Address range: 1 to 11
Direction: SW-NE
Address range: 1 to 11
Commodore Dr
Length: 0.08 miles
Direction: SE-NW
Address range: 1 to 99
Direction: SE-NW
Address range: 1 to 99
Christopher Newport Dr
Length: 0.04 miles
Directions: N-S, SW-NE
Address range: 1 to 99
Directions: N-S, SW-NE
Address range: 1 to 99
Shade Tree Dr
Length: 0.04 miles
Direction: N-S
Address range: 1 to 99
Direction: N-S
Address range: 1 to 99
Callahan Walk
Length: 0.03 miles
Direction: N-S
Address range: 1 to 99
Direction: N-S
Address range: 1 to 99
Halperin Walk
Length: 0.03 miles
Direction: N-S
Address range: 1 to 99
Direction: N-S
Address range: 1 to 99