Ellwood Heights neighborhood in Berkley, Michigan (MI), 48072, 48073, 48076 detailed profile
Settings
X


Business Search - 14 Million verified businesses
Area: 0.341 square miles
Population: 2,522
Population density:
| Ellwood Heights: | 7,405 people per square mile |
| Berkley: | 5,780 people per square mile |

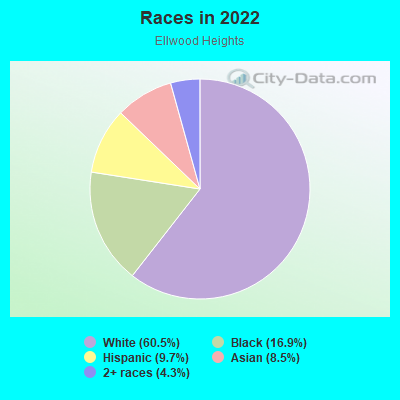
- 1,69260.5%White
- 47316.9%Black
- 2729.7%Hispanic or Latino
- 2398.5%Asian
- 1214.3%Two or more races
Median household income in 2022:
| Ellwood Heights: | $86,124 |
| Berkley: | $108,125 |
Distribution of median household income
![Distribution of median household income]()
- 39Less than $10,000
- 142$10,000 to $19,999
- 112$20,000 to $29,999
- 122$30,000 to $39,999
- 89$40,000 to $49,999
- 89$50,000 to $59,999
- 121$60,000 to $74,999
- 224$75,000 to $99,999
- 111$100,000 to $124,999
- 135$125,000 to $149,999
- 145$150,000 to $199,999
- 104$200,000 or more

Distribution of owner-occupied house/condo value
![Distribution of owner-occupied house/condo value]()
- 85Less than $50,000
- 133$50,000 to $99,999
- 85$100,000 to $149,999
- 222$150,000 to $199,999
- 198$200,000 to $249,999
- 220$250,000 to $299,999
- 170$300,000 to $399,999
- 41$400,000 to $499,999
- 37$500,000 to $749,999
- 25$750,000 to $999,999

Distribution of rent paid by renters
![Distribution of rent paid by renters]()
- 25$200 to $299
- 101$400 to $499
- 89$500 to $599
- 189$700 to $799
- 71$800 to $899
- 52$900 to $999
- 135$1,000 to $1,249
- 51$1,250 to $1,499
- 86$1,500 to $1,999
- 86$2,000 or more

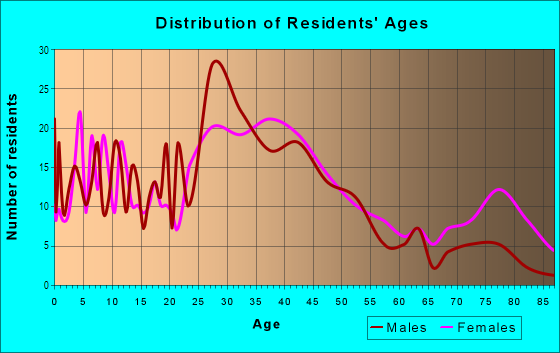
| Males: | 1,252 |
| Females: | 1,270 |
Males:
| This neighborhood: | 36.2 years |
| Whole city: | 36.3 years |
| This neighborhood: | 43.3 years |
| Whole city: | 38.8 years |
Average household size:
| Ellwood Heights: | 5.5 people |
| Berkley: | 2.2 people |
Percentage of family households:
| Ellwood Heights: | 42.9% |
| Berkley: | 42.8% |
| Here: | 39.2% |
| Berkley: | 43.7% |
Percentage of married-couple families with children (among all households):
| Ellwood Heights: | 37.4% |
| Berkley: | 39.2% |
Percentage of single-mother households (among all households):
| Ellwood Heights: | 9.9% |
| Berkley: | 5.8% |
Percentage of never married males 15 years old and over:
Percentage of never married females 15 years old and over:
| Ellwood Heights: | 20.1% |
| Berkley: | 16.3% |
Percentage of never married females 15 years old and over:
| Ellwood Heights: | 15.1% |
| city: | 16.8% |
Percentage of people that speak English not well or not at all:
| Ellwood Heights: | 1.5% |
| Berkley: | 0.3% |
Percentage of people born in this state:
Percentage of people born in another U.S. state:
Percentage of native residents but born outside the U.S.:
Percentage of foreign born residents:
| Here: | 81.1% |
| Berkley: | 82.2% |
Percentage of people born in another U.S. state:
| Ellwood Heights: | 13.4% |
| Berkley: | 13.8% |
Percentage of native residents but born outside the U.S.:
| Here: | 0.5% |
| city: | 0.8% |
Percentage of foreign born residents:
| Here: | 5.0% |
| Berkley: | 3.2% |
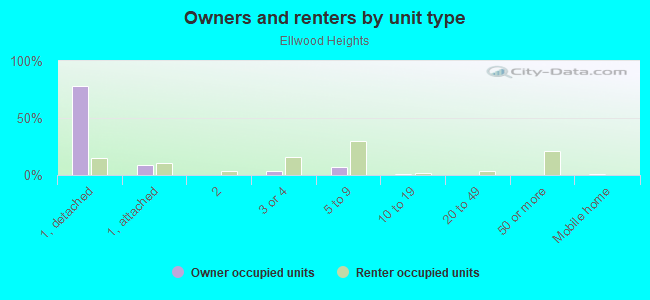
Owner-occupied
Renter-occupied

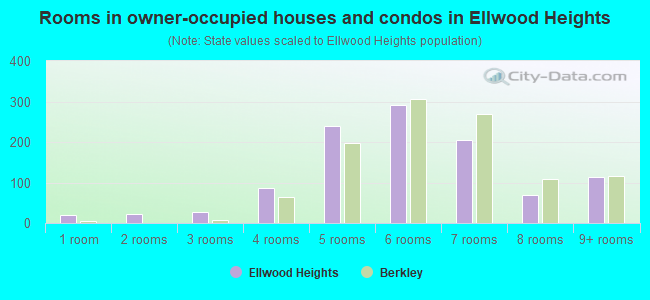
- Rooms in owner-occupied houses and condos in Ellwood Heights
- 201 room
- 212 rooms
- 283 rooms
- 864 rooms
- 2395 rooms
- 2916 rooms
- 2057 rooms
- 688 rooms
- 1149+ rooms
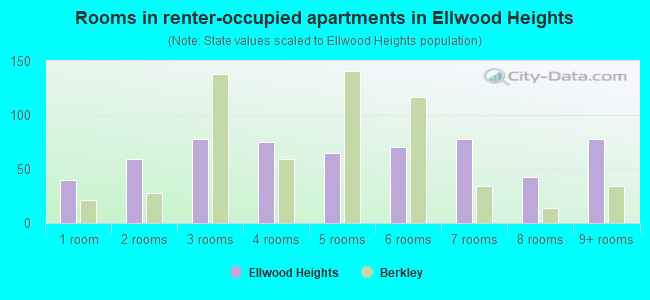
- Rooms in renter-occupied apartments in Ellwood Heights
- 401 room
- 592 rooms
- 783 rooms
- 754 rooms
- 655 rooms
- 706 rooms
- 787 rooms
- 438 rooms
- 789+ rooms
Owner-occupied
Renter-occupied
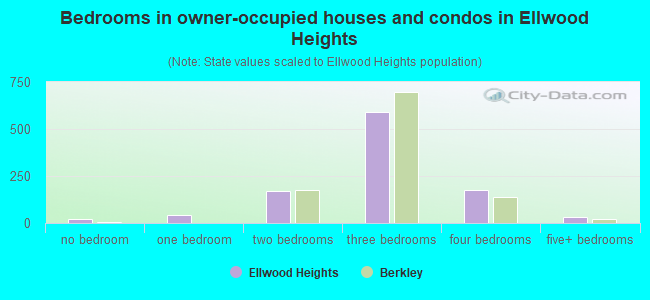
- Bedrooms in owner-occupied houses and condos in Ellwood Heights
- 20no bedroom
- 431 bedroom
- 1682 bedrooms
- 5933 bedrooms
- 1774 bedrooms
- 305+ bedrooms
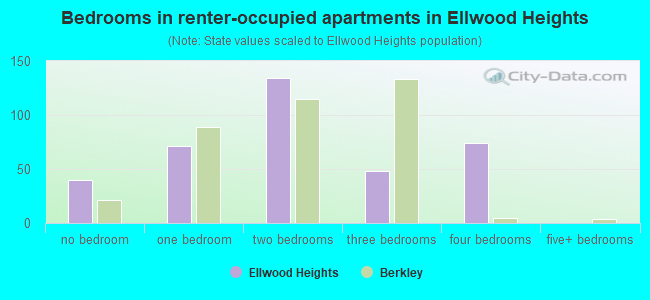
- Bedrooms in renter-occupied apartments in Ellwood Heights
- 40no bedroom
- 711 bedroom
- 1342 bedrooms
- 483 bedrooms
- 744 bedrooms
- 05+ bedrooms
Average number of cars or other vehicles available in houses/condos:
Average number of cars or other vehicles available in apartments:
| This neighborhood: | 2.1 |
| Berkley: | 1.8 |
Average number of cars or other vehicles available in apartments:
| Here: | 2.3 |
| city: | 1.4 |
Percentage of units with a mortgage:
| Ellwood Heights: | 77.6% |
| Berkley: | 75.0% |
Average estimated value of detached houses in 2022 (83.0% of all units):
| Ellwood Heights: | $254,951 |
| Michigan: | $280,038 |
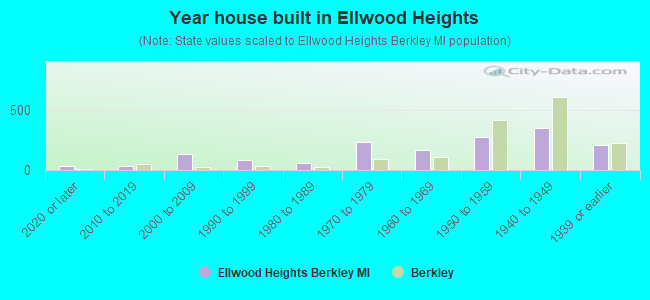
- Year house built in Ellwood Heights
- 352020 or later
- 362010 to 2019
- 1322000 to 2009
- 871990 to 1999
- 551980 to 1989
- 2341970 to 1979
- 1671960 to 1969
- 2741950 to 1959
- 3521940 to 1949
- 2071939 or earlier
City-data.com crime index for city in 2020 (higher means more crime):
| City: | 39.3 |
| U.S. average: | 219.5 |
Travel time to work (commute)
![Travel time to work (commute)]()
- 22Less than 5 minutes
- 905 to 9 minutes
- 14810 to 14 minutes
- 28115 to 19 minutes
- 19520 to 24 minutes
- 13025 to 29 minutes
- 31230 to 34 minutes
- 5635 to 39 minutes
- 6140 to 44 minutes
- 4145 to 59 minutes
- 1960 to 89 minutes
- 1790 or more minutes

Means of transportation to work
![Means of transportation to work]()
- 73.1%1,116Drove a car alone
- 8.1%124Carpooled
- 15.2%232Bus
- 1.2%19Bicycle
- 4.9%75Walked
- 2.8%43Other means
- 17.8%272Worked at home

Time leaving home to go to work
![Time leaving home to go to work]()
- 2612:00 a.m. to 4:59 a.m.
- 225:00 a.m. to 5:29 a.m.
- 395:30 a.m. to 5:59 a.m.
- 796:00 a.m. to 6:29 a.m.
- 976:30 a.m. to 6:59 a.m.
- 2357:00 a.m. to 7:29 a.m.
- 3027:30 a.m. to 7:59 a.m.
- 1978:00 a.m. to 8:29 a.m.
- 1148:30 a.m. to 8:59 a.m.
- 819:00 a.m. to 9:59 a.m.
- 2910:00 a.m. to 10:59 a.m.
- 2611:00 a.m. to 11:59 a.m.
- 7612:00 p.m. to 3:59 p.m.
- 514:00 p.m. to 11:59 p.m.

Occupations of males:
- Percentage of males in management occupations (except farmers):
Here: 13.8% city: 14.2%
- Percentage of males in business and financial operations occupations:
Here: 6.6% city: 9.4%
- Percentage of males in computer and mathematical occupations:
Here: 10.4% city: 7.1%
- Percentage of males in architecture and engineering occupations:
Here: 10.7% city: 8.9%
- Percentage of males in education, training, and library occupations:
Here: 1.6% city: 4.1%
- Percentage of males in arts, design, entertainment, sports, and media occupations:
Here: 3.9% city: 3.9%
- Percentage of males in service occupations:
Here: 10.7% city: 6.7%
- Percentage of males in sales and office occupations:
Here: 12.5% city: 18.2%
- Percentage of males in construction, extraction, and maintenance occupations:
Here: 5.5% city: 4.3%
- Percentage of males in production occupations:
Here: 4.9% city: 6.2%
- Percentage of males in transportation occupations:
Here: 3.5% city: 3.3%
- Percentage of males in material moving occupations:
Here: 9.3% city: 2.8%
Occupations of females:
- Percentage of females in management occupations (except farmers):
Here: 13.3% city: 16.2%
- Percentage of females in business and financial operations occupations:
Here: 13.5% city: 12.0%
- Percentage of females in computer and mathematical occupations:
Here: 2.9% city: 3.6%
- Percentage of females in community and social services occupations:
Here: 4.8% city: 3.8%
- Percentage of females in legal occupations:
Here: 2.5% city: 2.7%
- Percentage of females in education, training, and library occupations:
Here: 7.7% city: 10.1%
- Percentage of females in arts, design, entertainment, sports, and media occupations:
Here: 3.3% city: 3.5%
- Percentage of females in healthcare practitioners and technical occupations:
Here: 9.7% city: 12.8%
- Percentage of females in service occupations:
Here: 17.0% city: 7.4%
- Percentage of females in sales and office occupations:
Here: 22.3% city: 22.5%
- Percentage of females in production occupations:
Here: 1.5% city: 0.8%
Percentage of people 16-64 in Armed Forces:
| Ellwood Heights: | 0.1% |
| Berkley: | 0.1% |
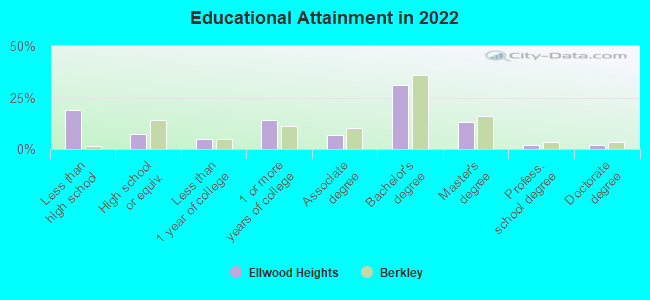
Education in this neighborhood (subdivision or community):
- Percentage of people 3 years and older in K-12 schools:
Ellwood Heights: 15.9% Berkley: 12.3%
- Percentage of people 3 years and older in undergraduate colleges:
Ellwood Heights: 8.8% Berkley: 2.6%
- Percentage of people 3 years and older in grad. or professional schools:
Ellwood Heights: 3.7% Berkley: 2.2%
- Percentage of students K-12 enrolled in private schools:
Ellwood Heights: 47.3% Berkley: 10.2%
Percentage of population below poverty level:
| Ellwood Heights: | 4.5% |
| Berkley: | 3.1% |
Median year owner moved in (as recorded in 2022):
| Ellwood Heights: | 2010 |
| Berkley: | 2009 |
Percentage of married-couple families with both working:
| Ellwood Heights: | 114.6% |
| Berkley: | 78.3% |
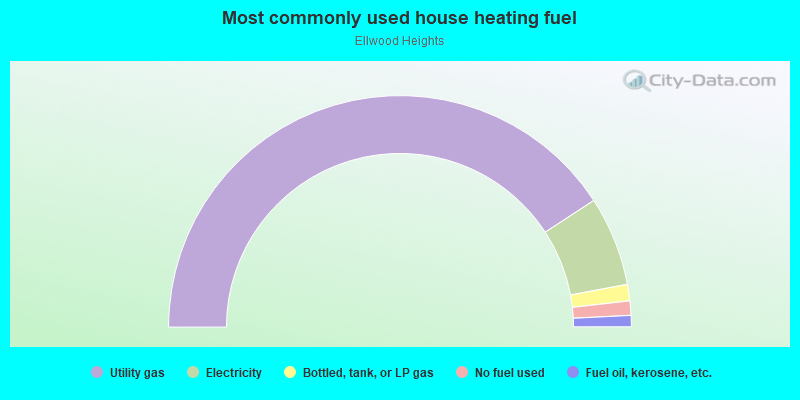
- 81.6%Utility gas
- 12.5%Electricity
- 2.3%Bottled, tank, or LP gas
- 2.0%No fuel used
- 1.6%Fuel oil, kerosene, etc.
Roads and streets:
Thomas Ave
Length: 0.63 miles
Direction: N-S
Address range: 3200 to 4299
Direction: N-S
Address range: 3200 to 4299
Bacon Ave
Length: 0.63 miles
Direction: N-S
Address range: 3200 to 4299
Direction: N-S
Address range: 3200 to 4299
Cummings Ave
Length: 0.63 miles
Direction: N-S
Address range: 3200 to 4299
Direction: N-S
Address range: 3200 to 4299
Phillips Ave
Length: 0.63 miles
Direction: N-S
Address range: 3200 to 4299
Direction: N-S
Address range: 3200 to 4299
Ellwood Ave
Length: 0.63 miles
Direction: N-S
Address range: 3200 to 4299
Direction: N-S
Address range: 3200 to 4299
Greenfield Rd
Length: 0.63 miles
Direction: N-S
Address range: 3200 to 29999
Direction: N-S
Address range: 3200 to 29999
Morrison Ave
Length: 0.51 miles
Direction: E-W
Address range: 3700 to 15599
Direction: E-W
Address range: 3700 to 15599
Edwards Ave
Length: 0.51 miles
Direction: E-W
Address range: 3682 to 15599
Direction: E-W
Address range: 3682 to 15599
Prairie Ave
Length: 0.50 miles
Direction: N-S
Address range: 3400 to 4299
Direction: N-S
Address range: 3400 to 4299
Brentwood St
Length: 0.44 miles
Direction: N-S
Address range: 28700 to 29999
Direction: N-S
Address range: 28700 to 29999
W Webster Rd
Length: 0.44 miles
Direction: E-W
Address range: 3701 to 4498
Direction: E-W
Address range: 3701 to 4498
12 Mile Rd
Length: 0.43 miles
Direction: E-W
Address range: 3684 to 4199
Direction: E-W
Address range: 3684 to 4199
Beverly Blvd
Length: 0.41 miles
Direction: E-W
Address range: 3700 to 4199
Direction: E-W
Address range: 3700 to 4199
W 12 Mile Rd
Length: 0.08 miles
Direction: E-W
Address range: 15500 to 15599
Direction: E-W
Address range: 15500 to 15599
San Rosa Ave
Length: 0.08 miles
Direction: E-W
Address range: 15500 to 15599
Direction: E-W
Address range: 15500 to 15599
Webster Ave
Length: 0.07 miles
Direction: E-W
Address range: 15500 to 15599
Direction: E-W
Address range: 15500 to 15599
Garden Ave
Length: 0.03 miles
Direction: N-S
Direction: N-S