Fitler Square neighborhood in Philadelphia, Pennsylvania (PA), 19103, 19146 detailed profile
Settings
X


Business Search - 14 Million verified businesses
Area: 0.157 square miles
Population: 4,110
Population density:
| Fitler Square: | 26,261 people per square mile |
| Philadelphia: | 11,602 people per square mile |

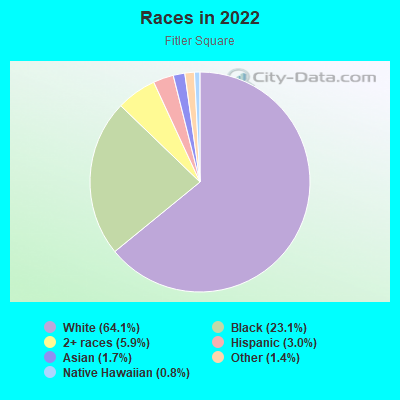
- 2,63464.1%White
- 94723.1%Black
- 2435.9%Two or more races
- 1223.0%Hispanic or Latino
- 701.7%Asian
- 581.4%Some other race
- 330.8%Native Hawaiian and Other
Pacific Islander
Median household income in 2022:
| Fitler Square: | $89,775 |
| Philadelphia: | $56,517 |
Distribution of median household income
![Distribution of median household income]()
- 153Less than $10,000
- 253$10,000 to $19,999
- 122$20,000 to $29,999
- 19$30,000 to $39,999
- 58$40,000 to $49,999
- 78$50,000 to $59,999
- 247$60,000 to $74,999
- 217$75,000 to $99,999
- 269$100,000 to $124,999
- 47$125,000 to $149,999
- 221$150,000 to $199,999
- 444$200,000 or more

Distribution of owner-occupied house/condo value
![Distribution of owner-occupied house/condo value]()
- 44$100,000 to $149,999
- 46$150,000 to $199,999
- 2$200,000 to $249,999
- 53$300,000 to $399,999
- 130$400,000 to $499,999
- 403$500,000 to $749,999
- 318$750,000 to $999,999
- 81$1,000,000 or more

Distribution of rent paid by renters
![Distribution of rent paid by renters]()
- 80$100 to $199
- 84$200 to $299
- 107$300 to $399
- 57$400 to $499
- 31$900 to $999
- 20$1,000 to $1,249
- 160$1,250 to $1,499
- 182$1,500 to $1,999
- 333$2,000 or more

Median rent in 2022:
| Fitler Square: | $1,484 |
| Philadelphia: | $1,073 |
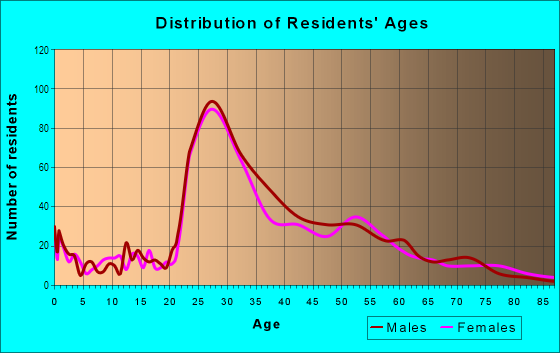
| Males: | 1,923 |
| Females: | 2,187 |
Males:
| This neighborhood: | 37.7 years |
| Whole city: | 34.1 years |
| This neighborhood: | 34.6 years |
| Whole city: | 36.3 years |
Average household size:
| Fitler Square: | 1.9 people |
| Philadelphia: | 2.2 people |
Percentage of family households:
| Fitler Square: | 26.2% |
| Philadelphia: | 36.5% |
| Here: | 31.3% |
| Philadelphia: | 28.0% |
Percentage of married-couple families with children (among all households):
| Fitler Square: | 47.5% |
| Philadelphia: | 23.5% |
Percentage of single-mother households (among all households):
| Fitler Square: | 2.7% |
| Philadelphia: | 17.6% |
Percentage of never married males 15 years old and over:
Percentage of never married females 15 years old and over:
| Fitler Square: | 22.8% |
| Philadelphia: | 23.9% |
Percentage of never married females 15 years old and over:
| Fitler Square: | 25.7% |
| city: | 26.0% |
Percentage of people that speak English not well or not at all:
| Fitler Square: | 0.0% |
| Philadelphia: | 7.0% |
Percentage of people born in this state:
Percentage of people born in another U.S. state:
Percentage of native residents but born outside the U.S.:
Percentage of foreign born residents:
| Here: | 46.1% |
| Philadelphia: | 61.6% |
Percentage of people born in another U.S. state:
| Fitler Square: | 47.6% |
| Philadelphia: | 18.9% |
Percentage of native residents but born outside the U.S.:
| Here: | 1.3% |
| city: | 3.7% |
Percentage of foreign born residents:
| Here: | 5.0% |
| Philadelphia: | 15.7% |
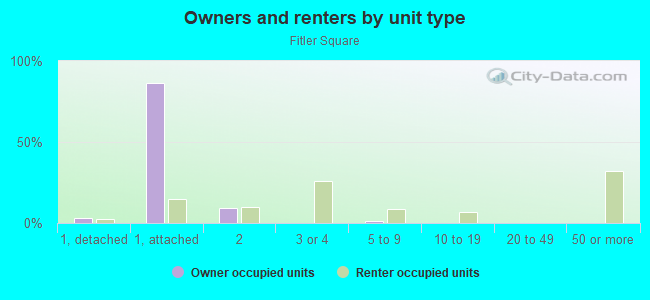
Owner-occupied
Renter-occupied

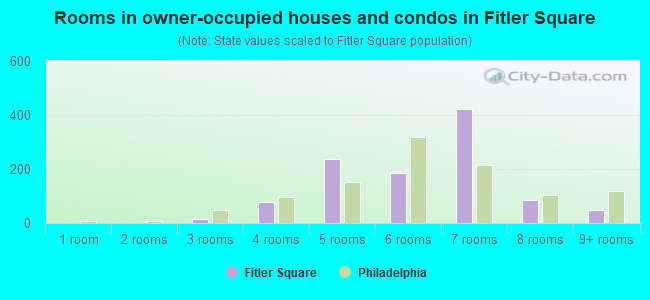
- Rooms in owner-occupied houses and condos in Fitler Square
- 01 room
- 02 rooms
- 133 rooms
- 794 rooms
- 2365 rooms
- 1856 rooms
- 4247 rooms
- 848 rooms
- 489+ rooms
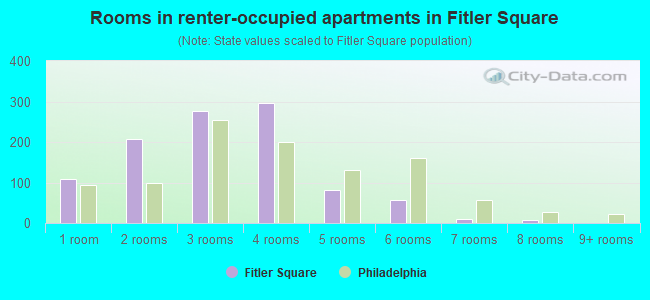
- Rooms in renter-occupied apartments in Fitler Square
- 1081 room
- 2072 rooms
- 2773 rooms
- 2974 rooms
- 825 rooms
- 576 rooms
- 117 rooms
- 78 rooms
- 09+ rooms
Owner-occupied
Renter-occupied
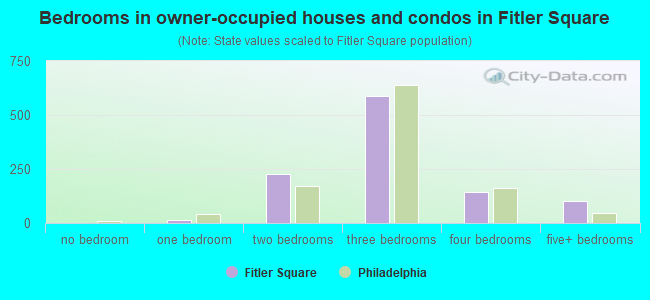
- Bedrooms in owner-occupied houses and condos in Fitler Square
- 0no bedroom
- 131 bedroom
- 2252 bedrooms
- 5863 bedrooms
- 1444 bedrooms
- 1015+ bedrooms
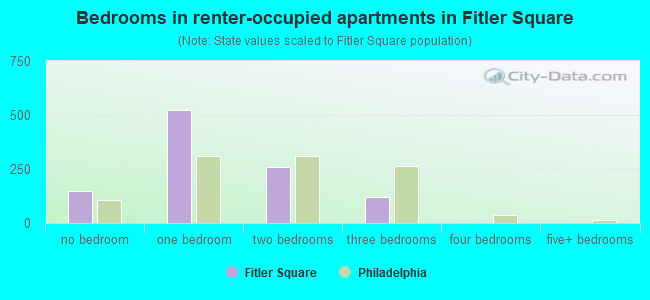
- Bedrooms in renter-occupied apartments in Fitler Square
- 150no bedroom
- 5221 bedroom
- 2572 bedrooms
- 1193 bedrooms
- 04 bedrooms
- 05+ bedrooms
Average number of cars or other vehicles available in houses/condos:
Average number of cars or other vehicles available in apartments:
| This neighborhood: | 1.2 |
| Philadelphia: | 1.3 |
Average number of cars or other vehicles available in apartments:
| Here: | 0.5 |
| city: | 0.8 |
Percentage of units with a mortgage:
| Fitler Square: | 78.0% |
| Philadelphia: | 58.9% |
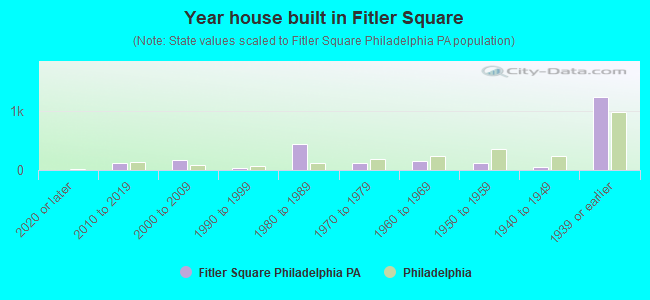
- Year house built in Fitler Square
- 02020 or later
- 1262010 to 2019
- 1712000 to 2009
- 321990 to 1999
- 4381980 to 1989
- 1221970 to 1979
- 1571960 to 1969
- 1211950 to 1959
- 471940 to 1949
- 1,2351939 or earlier
City-data.com crime index for city in 2020 (higher means more crime):
| City: | 169.8 |
| U.S. average: | 219.5 |
Travel time to work (commute)
![Travel time to work (commute)]()
- 65 to 9 minutes
- 9310 to 14 minutes
- 33515 to 19 minutes
- 67920 to 24 minutes
- 11325 to 29 minutes
- 48630 to 34 minutes
- 8935 to 39 minutes
- 6840 to 44 minutes
- 8345 to 59 minutes
- 8460 to 89 minutes
- 5490 or more minutes

Means of transportation to work
![Means of transportation to work]()
- 32.5%820Drove a car alone
- 7.3%183Bus
- 7.5%188Subway or elevated rail
- 4.3%109Long-distance train or commuter rail
- 6.8%172Bicycle
- 24.2%611Walked
- 0.3%8Other means
- 17.0%428Worked at home

Time leaving home to go to work
![Time leaving home to go to work]()
- 1512:00 a.m. to 4:59 a.m.
- 1176:00 a.m. to 6:29 a.m.
- 1866:30 a.m. to 6:59 a.m.
- 2487:00 a.m. to 7:29 a.m.
- 3287:30 a.m. to 7:59 a.m.
- 2738:00 a.m. to 8:29 a.m.
- 5398:30 a.m. to 8:59 a.m.
- 2739:00 a.m. to 9:59 a.m.
- 4310:00 a.m. to 10:59 a.m.
- 4312:00 p.m. to 3:59 p.m.
- 254:00 p.m. to 11:59 p.m.

Occupations of males:
- Percentage of males in management occupations (except farmers):
Here: 11.0% city: 9.1%
- Percentage of males in business and financial operations occupations:
Here: 15.5% city: 6.0%
- Percentage of males in computer and mathematical occupations:
Here: 10.4% city: 4.6%
- Percentage of males in architecture and engineering occupations:
Here: 4.9% city: 2.4%
- Percentage of males in life, physical, and social science occupations:
Here: 3.8% city: 1.7%
- Percentage of males in community and social services occupations:
Here: 1.8% city: 1.9%
- Percentage of males in legal occupations:
Here: 3.5% city: 1.8%
- Percentage of males in education, training, and library occupations:
Here: 11.5% city: 4.0%
- Percentage of males in arts, design, entertainment, sports, and media occupations:
Here: 5.9% city: 2.5%
- Percentage of males in healthcare practitioners and technical occupations:
Here: 8.2% city: 4.3%
- Percentage of males in service occupations:
Here: 2.8% city: 19.3%
- Percentage of males in sales and office occupations:
Here: 12.8% city: 14.1%
- Percentage of males in production occupations:
Here: 3.1% city: 5.0%
- Percentage of males in transportation occupations:
Here: 4.2% city: 6.9%
Occupations of females:
- Percentage of females in management occupations (except farmers):
Here: 9.0% city: 9.1%
- Percentage of females in business and financial operations occupations:
Here: 6.9% city: 6.6%
- Percentage of females in life, physical, and social science occupations:
Here: 9.3% city: 1.6%
- Percentage of females in community and social services occupations:
Here: 5.2% city: 3.6%
- Percentage of females in legal occupations:
Here: 5.2% city: 1.9%
- Percentage of females in education, training, and library occupations:
Here: 13.3% city: 8.5%
- Percentage of females in arts, design, entertainment, sports, and media occupations:
Here: 2.7% city: 2.4%
- Percentage of females in healthcare practitioners and technical occupations:
Here: 18.6% city: 10.3%
- Percentage of females in service occupations:
Here: 11.3% city: 24.4%
- Percentage of females in sales and office occupations:
Here: 15.1% city: 23.4%
- Percentage of females in production occupations:
Here: 2.6% city: 2.4%
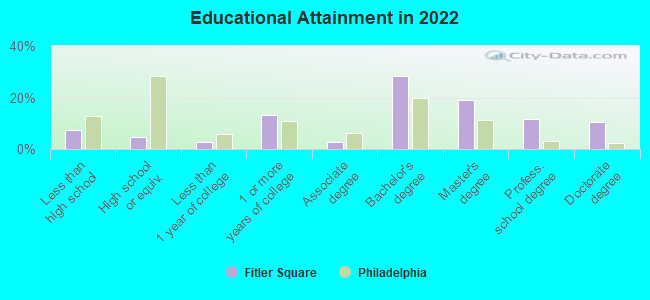
Education in this neighborhood (subdivision or community):
- Percentage of people 3 years and older in K-12 schools:
Fitler Square: 6.8% Philadelphia: 15.6%
- Percentage of people 3 years and older in undergraduate colleges:
Fitler Square: 3.5% Philadelphia: 6.0%
- Percentage of people 3 years and older in grad. or professional schools:
Fitler Square: 5.3% Philadelphia: 2.8%
- Percentage of students K-12 enrolled in private schools:
Fitler Square: 22.4% Philadelphia: 25.0%
Percentage of population below poverty level:
| Fitler Square: | 12.9% |
| Philadelphia: | 21.7% |
Median year owner moved in (as recorded in 2022):
Median year renter moved in (as recorded in 2022):
| Fitler Square: | 2010 |
| Philadelphia: | 2007 |
Median year renter moved in (as recorded in 2022):
| Fitler Square: | 2018 |
| Philadelphia: | 2019 |
Percentage of married-couple families with both working:
| Fitler Square: | 92.8% |
| Philadelphia: | 71.4% |
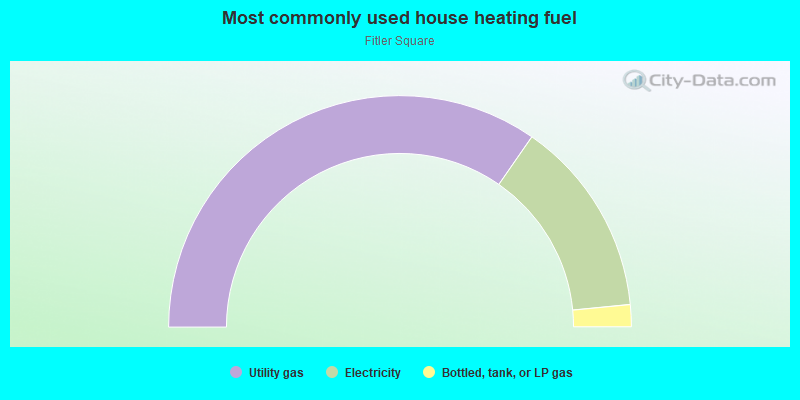
- 69.4%Utility gas
- 27.6%Electricity
- 3.1%Bottled, tank, or LP gas
Roads and streets:
South St
Length: 0.66 miles
Directions: E-W, SE-NW
Address range: 2100 to 2734
Directions: E-W, SE-NW
Address range: 2100 to 2734
Lombard St
Length: 0.51 miles
Direction: E-W
Address range: 2100 to 2699
Direction: E-W
Address range: 2100 to 2699
Naudain St
Length: 0.47 miles
Direction: E-W
Address range: 2100 to 2699
Direction: E-W
Address range: 2100 to 2699
Pine St
Length: 0.46 miles
Direction: E-W
Address range: 2100 to 2699
Direction: E-W
Address range: 2100 to 2699
Delancey St
Length: 0.42 miles
Direction: E-W
Address range: 2100 to 2599
Direction: E-W
Address range: 2100 to 2599
Spruce St
Length: 0.42 miles
Direction: E-W
Address range: 2100 to 2599
Direction: E-W
Address range: 2100 to 2599
Locust St
Length: 0.34 miles
Directions: E-W, N-S
Address range: 2100 to 2498
Directions: E-W, N-S
Address range: 2100 to 2498
S 23rd St
Length: 0.33 miles
Direction: N-S
Address range: 201 to 699
Direction: N-S
Address range: 201 to 699
S 22nd St
Length: 0.32 miles
Direction: N-S
Address range: 235 to 599
Direction: N-S
Address range: 235 to 599
S 24th St
Length: 0.32 miles
Direction: N-S
Address range: 230 to 599
Direction: N-S
Address range: 230 to 599
S 21st St
Length: 0.32 miles
Direction: N-S
Address range: 234 to 599
Direction: N-S
Address range: 234 to 599
S 25th St
Length: 0.32 miles
Direction: N-S
Address range: 200 to 599
Direction: N-S
Address range: 200 to 599
Panama St (Panama Mall)
Length: 0.31 miles
Direction: E-W
Address range: 2200 to 2599
Direction: E-W
Address range: 2200 to 2599
Manning St
Length: 0.29 miles
Direction: E-W
Address range: 2100 to 2499
Direction: E-W
Address range: 2100 to 2499
Cypress St
Length: 0.26 miles
Direction: E-W
Address range: 2100 to 2499
Direction: E-W
Address range: 2100 to 2499
S 26th St
Length: 0.24 miles
Direction: N-S
Address range: 300 to 599
Direction: N-S
Address range: 300 to 599
Waverly St
Length: 0.23 miles
Direction: E-W
Address range: 2300 to 2599
Direction: E-W
Address range: 2300 to 2599
S Van Pelt St
Length: 0.15 miles
Direction: N-S
Address range: 247 to 499
Direction: N-S
Address range: 247 to 499
S Taney St
Length: 0.14 miles
Directions: E-W, N-S
Address range: 400 to 599
Directions: E-W, N-S
Address range: 400 to 599
Tryon St
Length: 0.11 miles
Direction: E-W
Address range: 2100 to 2199
Direction: E-W
Address range: 2100 to 2199
Rodman St
Length: 0.11 miles
Direction: E-W
Address range: 2100 to 2199
Direction: E-W
Address range: 2100 to 2199
S 27th St
Length: 0.08 miles
Direction: N-S
Address range: 500 to 599
Direction: N-S
Address range: 500 to 599
Latimer St
Length: 0.08 miles
Direction: E-W
Address range: 2200 to 2299
Direction: E-W
Address range: 2200 to 2299
Rittenhouse Sq
Length: 0.08 miles
Direction: E-W
Address range: 2200 to 2299
Direction: E-W
Address range: 2200 to 2299
Fitlers Walk
Length: 0.08 miles
Direction: E-W
Address range: 2400 to 2499
Direction: E-W
Address range: 2400 to 2499
Rainey Ct
Length: 0.07 miles
Direction: E-W
Address range: 1 to 6
Direction: E-W
Address range: 1 to 6
S Croskey St
Length: 0.06 miles
Direction: N-S
Address range: 400 to 499
Direction: N-S
Address range: 400 to 499
Addison St
Length: 0.06 miles
Direction: E-W
Address range: 2100 to 2199
Direction: E-W
Address range: 2100 to 2199
Grays Ferry Ave
Length: 0.03 miles
Direction: SW-NE
Direction: SW-NE
Railroad features:
Baltimore and Ohio RR
Length: 0.32 miles
Direction: SW-NE
Direction: SW-NE