Forest Park neighborhood in Baltimore, Maryland (MD), 21216 detailed profile
Settings
X

Business Search - 14 Million verified businesses
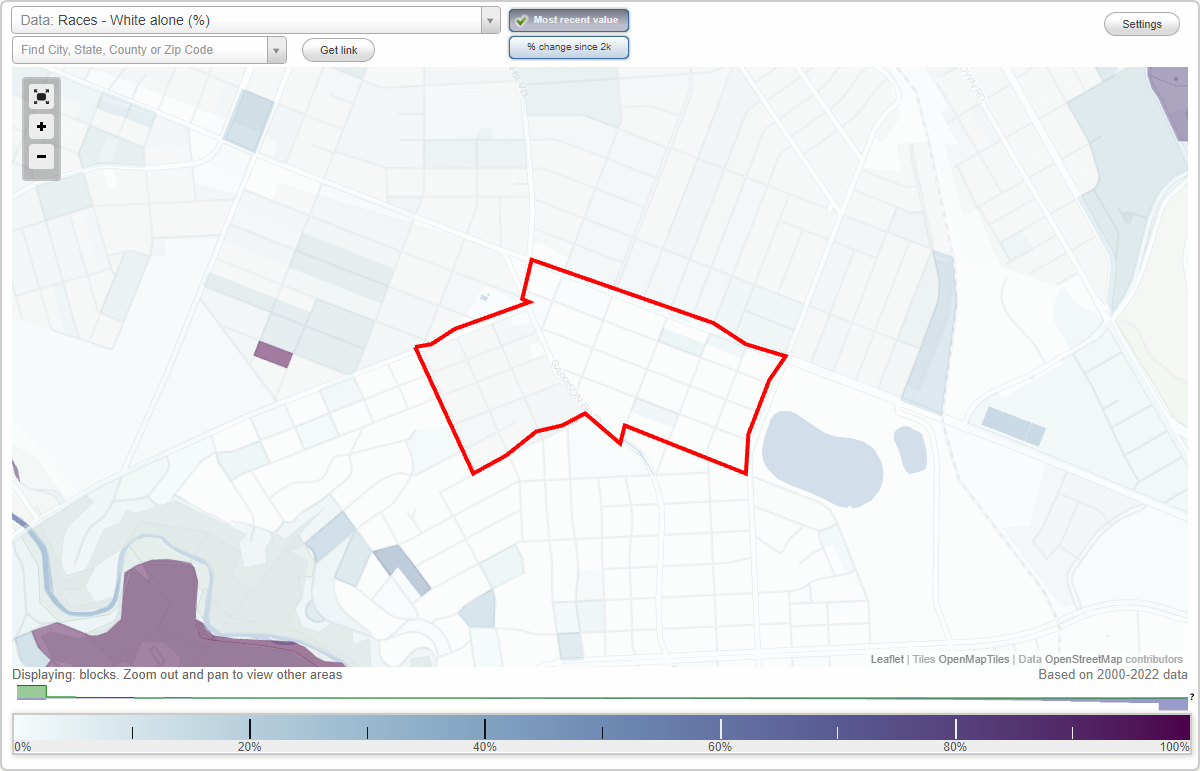
Area: 0.237 square miles
Population: 2,902
Population density:
| Forest Park: | 12,227 people per square mile |
| Baltimore: | 7,053 people per square mile |

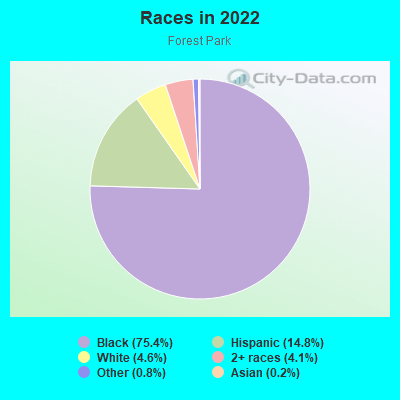
- 2,78175.4%Black
- 54614.8%Hispanic or Latino
- 1704.6%White
- 1524.1%Two or more races
- 310.8%Some other race
- 80.2%Asian
- 20.05%Native Hawaiian and Other
Pacific Islander
Distribution of median household income
![Distribution of median household income]()
- 114Less than $10,000
- 262$10,000 to $19,999
- 334$20,000 to $29,999
- 167$30,000 to $39,999
- 358$40,000 to $49,999
- 167$50,000 to $59,999
- 216$60,000 to $74,999
- 167$75,000 to $99,999
- 135$100,000 to $124,999
- 96$125,000 to $149,999
- 60$150,000 to $199,999
- 63$200,000 or more

Distribution of owner-occupied house/condo value
![Distribution of owner-occupied house/condo value]()
- 163Less than $50,000
- 207$50,000 to $99,999
- 221$100,000 to $149,999
- 241$150,000 to $199,999
- 187$200,000 to $249,999
- 88$250,000 to $299,999
- 116$300,000 to $399,999
- 39$400,000 to $499,999
- 12$500,000 to $749,999
- 31$750,000 to $999,999
- 193$1,000,000 or more

Distribution of rent paid by renters
![Distribution of rent paid by renters]()
- 16Less than $100
- 36$100 to $199
- 29$200 to $299
- 110$300 to $399
- 107$500 to $599
- 270$600 to $699
- 63$700 to $799
- 323$800 to $899
- 193$900 to $999
- 356$1,000 to $1,249
- 72$1,250 to $1,499
- 77$1,500 to $1,999
- 55$2,000 or more

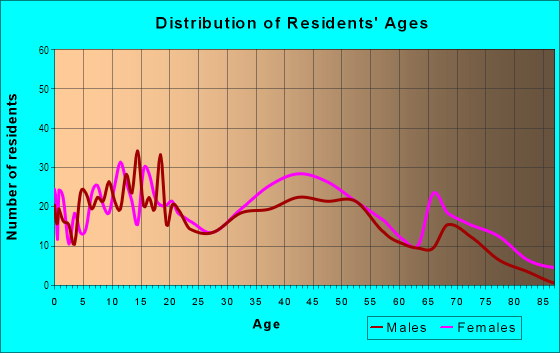
| Males: | 1,264 |
| Females: | 1,638 |
Males:
| This neighborhood: | |
| Whole city: |
| This neighborhood: | 44.6 years |
| Whole city: | 38.2 years |
Average household size:
| Forest Park: | 11.0 people |
| Baltimore: | 2.2 people |
Percentage of family households:
| Forest Park: | 20.7% |
| Baltimore: | 34.2% |
| Here: | 15.5% |
| Baltimore: | 23.3% |
Percentage of married-couple families with children (among all households):
| Forest Park: | 30.9% |
| Baltimore: | 22.4% |
Percentage of single-mother households (among all households):
| Forest Park: | 15.4% |
| Baltimore: | 18.7% |
Percentage of never married males 15 years old and over:
Percentage of never married females 15 years old and over:
| Forest Park: | 25.0% |
| Baltimore: | 25.1% |
Percentage of never married females 15 years old and over:
| Forest Park: | 34.3% |
| city: | 27.5% |
Percentage of people that speak English not well or not at all:
| Forest Park: | 0.0% |
| Baltimore: | 2.3% |
Percentage of people born in this state:
Percentage of people born in another U.S. state:
Percentage of native residents but born outside the U.S.:
Percentage of foreign born residents:
| Here: | 74.3% |
| Baltimore: | 64.4% |
Percentage of people born in another U.S. state:
| Forest Park: | 21.8% |
| Baltimore: | 25.0% |
Percentage of native residents but born outside the U.S.:
| Here: | 0.9% |
| city: | 0.9% |
Percentage of foreign born residents:
| Here: | 3.6% |
| Baltimore: | 9.7% |
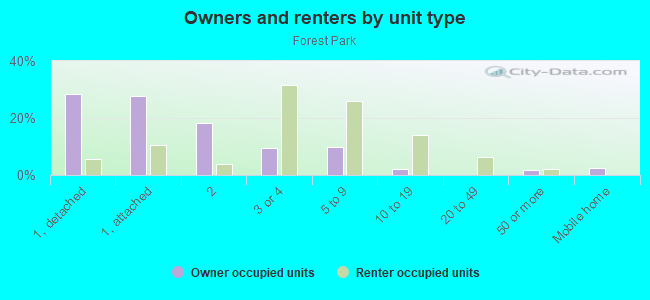
Owner-occupied
Renter-occupied

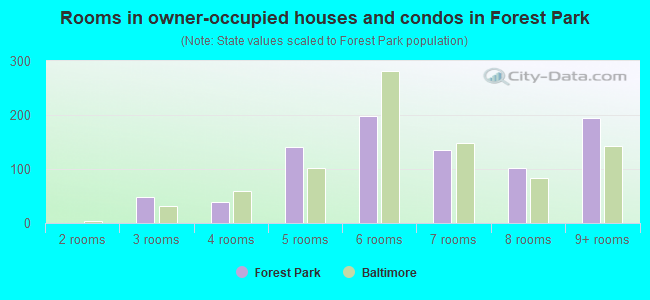
- Rooms in owner-occupied houses and condos in Forest Park
- 01 room
- 02 rooms
- 493 rooms
- 384 rooms
- 1415 rooms
- 1986 rooms
- 1357 rooms
- 1018 rooms
- 1949+ rooms
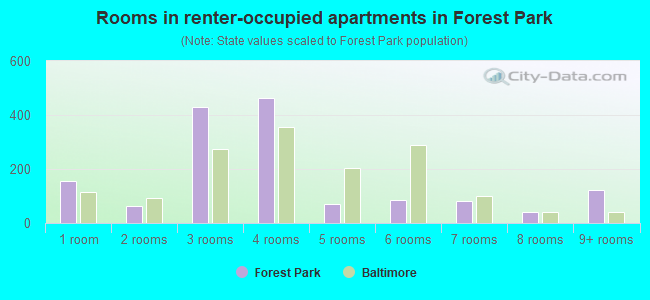
- Rooms in renter-occupied apartments in Forest Park
- 1541 room
- 642 rooms
- 4303 rooms
- 4644 rooms
- 715 rooms
- 846 rooms
- 837 rooms
- 418 rooms
- 1219+ rooms
Owner-occupied
Renter-occupied
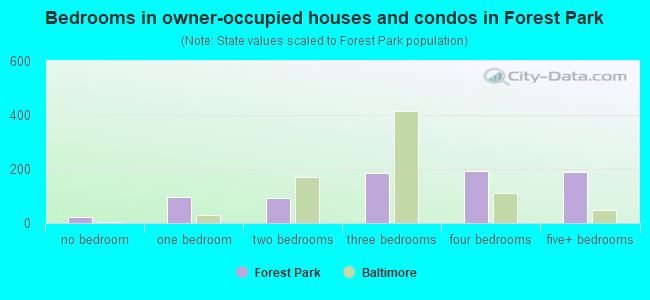
- Bedrooms in owner-occupied houses and condos in Forest Park
- 22no bedroom
- 951 bedroom
- 932 bedrooms
- 1873 bedrooms
- 1914 bedrooms
- 1885+ bedrooms
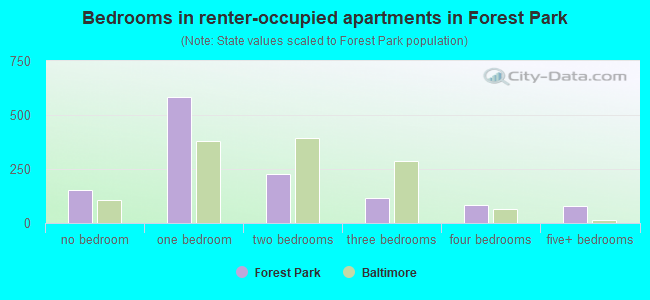
- Bedrooms in renter-occupied apartments in Forest Park
- 154no bedroom
- 5841 bedroom
- 2262 bedrooms
- 1183 bedrooms
- 834 bedrooms
- 795+ bedrooms
Average number of cars or other vehicles available in houses/condos:
Average number of cars or other vehicles available in apartments:
| This neighborhood: | 1.5 |
| Baltimore: | 1.5 |
Average number of cars or other vehicles available in apartments:
| Here: | |
| city: |
Percentage of units with a mortgage:
| Forest Park: | 76.1% |
| Baltimore: | 64.3% |
Average estimated value of detached houses in 2022 (21.1% of all units):
| Forest Park: | $1,796,963 |
| Baltimore: | $350,815 |
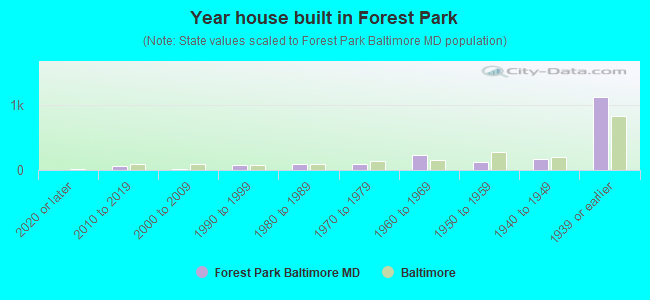
- Year house built in Forest Park
- 02020 or later
- 562010 to 2019
- 142000 to 2009
- 721990 to 1999
- 951980 to 1989
- 921970 to 1979
- 2261960 to 1969
- 1221950 to 1959
- 1641940 to 1949
- 1,1141939 or earlier
Travel time to work (commute)
![Travel time to work (commute)]()
- 54Less than 5 minutes
- 355 to 9 minutes
- 2410 to 14 minutes
- 25715 to 19 minutes
- 19720 to 24 minutes
- 7925 to 29 minutes
- 14630 to 34 minutes
- 3235 to 39 minutes
- 1440 to 44 minutes
- 31745 to 59 minutes
- 5960 to 89 minutes
- 4590 or more minutes

Means of transportation to work
![Means of transportation to work]()
- 60.5%668Drove a car alone
- 25.6%282Carpooled
- 14.9%164Bus
- 7.4%82Subway or elevated rail
- 3.7%41Long-distance train or commuter rail
- 8.7%96Light rail, streetcar or trolley
- 5.5%61Taxi
- 15.8%174Walked
- 8.9%98Other means
- 8.4%93Worked at home

Time leaving home to go to work
![Time leaving home to go to work]()
- 10812:00 a.m. to 4:59 a.m.
- 195:00 a.m. to 5:29 a.m.
- 915:30 a.m. to 5:59 a.m.
- 1816:00 a.m. to 6:29 a.m.
- 1116:30 a.m. to 6:59 a.m.
- 1687:00 a.m. to 7:29 a.m.
- 997:30 a.m. to 7:59 a.m.
- 408:00 a.m. to 8:29 a.m.
- 208:30 a.m. to 8:59 a.m.
- 789:00 a.m. to 9:59 a.m.
- 1010:00 a.m. to 10:59 a.m.
- 1811:00 a.m. to 11:59 a.m.
- 2912:00 p.m. to 3:59 p.m.
- 834:00 p.m. to 11:59 p.m.

Occupations of males:
- Percentage of males in management occupations (except farmers):
Here: 11.3% city: 10.7%
- Percentage of males in business and financial operations occupations:
Here: 3.5% city: 5.9%
- Percentage of males in community and social services occupations:
Here: 2.6% city: 1.6%
- Percentage of males in education, training, and library occupations:
Here: 1.4% city: 5.4%
- Percentage of males in healthcare practitioners and technical occupations:
Here: 4.9% city: 4.0%
- Percentage of males in service occupations:
Here: 23.8% city: 14.7%
- Percentage of males in sales and office occupations:
Here: 7.9% city: 14.2%
- Percentage of males in construction, extraction, and maintenance occupations:
Here: 3.3% city: 5.6%
- Percentage of males in transportation occupations:
Here: 21.7% city: 6.8%
- Percentage of males in material moving occupations:
Here: 7.6% city: 7.0%
Occupations of females:
- Percentage of females in management occupations (except farmers):
Here: 10.0% city: 10.1%
- Percentage of females in business and financial operations occupations:
Here: 3.6% city: 6.6%
- Percentage of females in computer and mathematical occupations:
Here: 3.4% city: 2.4%
- Percentage of females in community and social services occupations:
Here: 3.7% city: 3.6%
- Percentage of females in education, training, and library occupations:
Here: 6.9% city: 10.7%
- Percentage of females in healthcare practitioners and technical occupations:
Here: 1.6% city: 9.8%
- Percentage of females in service occupations:
Here: 33.0% city: 20.4%
- Percentage of females in sales and office occupations:
Here: 29.4% city: 22.3%
- Percentage of females in transportation occupations:
Here: 2.0% city: 1.7%
- Percentage of females in material moving occupations:
Here: 5.3% city: 1.9%
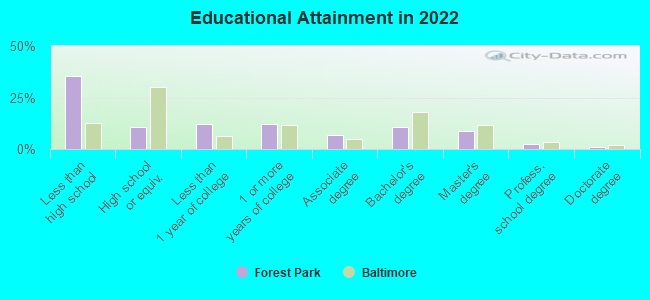
Education in this neighborhood (subdivision or community):
- Percentage of people 3 years and older in K-12 schools:
Forest Park: 34.3% Baltimore: 14.7%
- Percentage of people 3 years and older in undergraduate colleges:
Forest Park: 7.2% Baltimore: 6.0%
- Percentage of people 3 years and older in grad. or professional schools:
Forest Park: 7.4% Baltimore: 2.8%
- Percentage of students K-12 enrolled in private schools:
Forest Park: 40.9% Baltimore: 12.7%
Percentage of population below poverty level:
| Forest Park: | 17.5% |
| Baltimore: | 18.5% |
Percentage of married-couple families with both working:
| Forest Park: | 210.5% |
| Baltimore: | 79.2% |
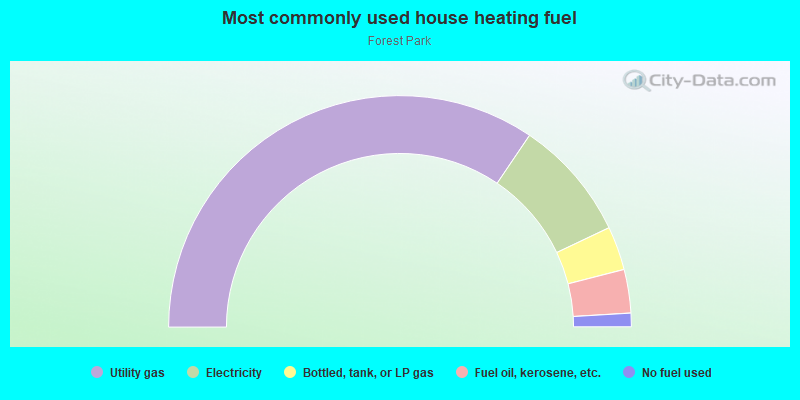
- 69.0%Utility gas
- 17.0%Electricity
- 6.1%Bottled, tank, or LP gas
- 6.1%Fuel oil, kerosene, etc.
- 1.9%No fuel used
Highways in this neighborhood:
State Hwy 26 (Liberty Heights Ave)
Length: 1.06 miles
Directions: E-W, SE-NW
Address range: 3521 to 3799
Directions: E-W, SE-NW
Address range: 3521 to 3799
Roads and streets:
Fairview Ave
Length: 0.83 miles
Direction: E-W
Address range: 3400 to 4099
Direction: E-W
Address range: 3400 to 4099
W Forest Park Ave
Length: 0.79 miles
Direction: E-W
Address range: 3400 to 3999
Direction: E-W
Address range: 3400 to 3999
Garrison Blvd
Length: 0.61 miles
Direction: SE-NW
Address range: 3000 to 3218
Direction: SE-NW
Address range: 3000 to 3218
Springdale Ave
Length: 0.58 miles
Direction: E-W
Address range: 3400 to 3793
Direction: E-W
Address range: 3400 to 3793
Bonner Rd
Length: 0.33 miles
Direction: E-W
Address range: 3800 to 4099
Direction: E-W
Address range: 3800 to 4099
Oakfield Ave
Length: 0.33 miles
Direction: SE-NW
Address range: 2900 to 3299
Direction: SE-NW
Address range: 2900 to 3299
Grantley Rd
Length: 0.33 miles
Direction: SW-NE
Address range: 3014 to 3389
Direction: SW-NE
Address range: 3014 to 3389
Norfolk Ave
Length: 0.32 miles
Direction: E-W
Address range: 3800 to 4099
Direction: E-W
Address range: 3800 to 4099
Wolcott Ave
Length: 0.32 miles
Direction: SE-NW
Address range: 3000 to 3399
Direction: SE-NW
Address range: 3000 to 3399
Denison St
Length: 0.29 miles
Directions: N-S, SW-NE
Address range: 3000 to 3389
Directions: N-S, SW-NE
Address range: 3000 to 3389
Callaway Ave
Length: 0.27 miles
Direction: SW-NE
Address range: 3100 to 3399
Direction: SW-NE
Address range: 3100 to 3399
Edgewood St
Length: 0.25 miles
Direction: SW-NE
Address range: 3052 to 3389
Direction: SW-NE
Address range: 3052 to 3389
Chelsea Ter
Length: 0.25 miles
Direction: SE-NW
Address range: 3009 to 3399
Direction: SE-NW
Address range: 3009 to 3399
Fairfax Rd
Length: 0.16 miles
Directions: E-W, SW-NE
Address range: 3900 to 4099
Directions: E-W, SW-NE
Address range: 3900 to 4099
Ayrdale Ave
Length: 0.16 miles
Direction: SW-NE
Address range: 3200 to 3399
Direction: SW-NE
Address range: 3200 to 3399
Woodhaven Ave
Length: 0.11 miles
Direction: SW-NE
Address range: 4000 to 4099
Direction: SW-NE
Address range: 4000 to 4099
Powhatan Ave
Length: 0.08 miles
Direction: E-W
Address range: 3338 to 3399
Direction: E-W
Address range: 3338 to 3399