Fountain Square neighborhood in Indianapolis, Indiana (IN), 46203 detailed profile
Settings
X


Business Search - 14 Million verified businesses
Area: 0.066 square miles
Population: 524
Population density:
| Fountain Square: | 7,905 people per square mile |
| Indianapolis: | 2,425 people per square mile |

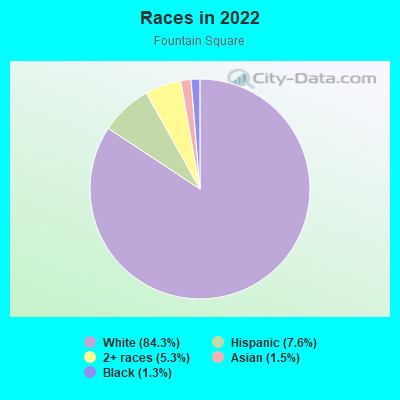
- 45884.3%White
- 417.6%Hispanic or Latino
- 295.3%Two or more races
- 81.5%Asian
- 71.3%Black
Median household income in 2022:
| Fountain Square: | $99,390 |
| Indianapolis: | $61,501 |
Distribution of median household income
![Distribution of median household income]()
- 14Less than $10,000
- 31$10,000 to $19,999
- 20$20,000 to $29,999
- 15$30,000 to $39,999
- 13$40,000 to $49,999
- 11$50,000 to $59,999
- 22$60,000 to $74,999
- 16$75,000 to $99,999
- 26$100,000 to $124,999
- 20$125,000 to $149,999
- 51$150,000 to $199,999
- 41$200,000 or more

Distribution of owner-occupied house/condo value
![Distribution of owner-occupied house/condo value]()
- 18Less than $50,000
- 50$50,000 to $99,999
- 11$100,000 to $149,999
- 15$150,000 to $199,999
- 10$200,000 to $249,999
- 24$250,000 to $299,999
- 59$300,000 to $399,999
- 24$400,000 to $499,999
- 41$500,000 to $749,999
- 1$1,000,000 or more

Distribution of rent paid by renters
![Distribution of rent paid by renters]()
- 26Less than $100
- 2$400 to $499
- 12$500 to $599
- 20$600 to $699
- 9$700 to $799
- 10$800 to $899
- 12$900 to $999
- 16$1,000 to $1,249
- 9$1,250 to $1,499
- 5$1,500 to $1,999
- 10$2,000 or more

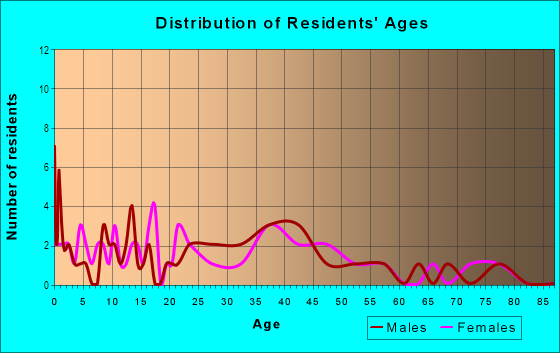
| Males: | 264 |
| Females: | 260 |
Males:
| This neighborhood: | 32.4 years |
| Whole city: | 32.9 years |
| This neighborhood: | 32.2 years |
| Whole city: | 35.4 years |
Average household size:
| Fountain Square: | 2.4 people |
| Indianapolis: | 2.3 people |
Percentage of family households:
| Fountain Square: | 53.1% |
| Indianapolis: | 42.9% |
| Here: | 44.7% |
| Indianapolis: | 37.4% |
Percentage of married-couple families with children (among all households):
| Fountain Square: | 18.1% |
| Indianapolis: | 26.5% |
Percentage of single-mother households (among all households):
| Fountain Square: | 34.6% |
| Indianapolis: | 12.9% |
Percentage of never married males 15 years old and over:
Percentage of never married females 15 years old and over:
| Fountain Square: | 18.4% |
| Indianapolis: | 19.9% |
Percentage of never married females 15 years old and over:
| Fountain Square: | 23.3% |
| city: | 19.2% |
Percentage of people that speak English not well or not at all:
| Fountain Square: | 1.5% |
| Indianapolis: | 4.2% |
Percentage of people born in this state:
Percentage of people born in another U.S. state:
Percentage of native residents but born outside the U.S.:
Percentage of foreign born residents:
| Here: | 65.9% |
| Indianapolis: | 63.1% |
Percentage of people born in another U.S. state:
| Fountain Square: | 27.6% |
| Indianapolis: | 23.6% |
Percentage of native residents but born outside the U.S.:
| Here: | 0.7% |
| city: | 1.1% |
Percentage of foreign born residents:
| Here: | 5.8% |
| Indianapolis: | 12.2% |
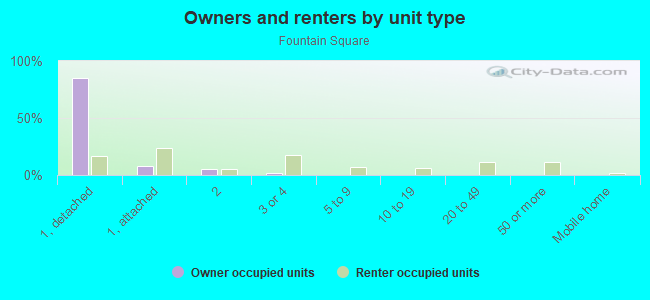
Owner-occupied
Renter-occupied

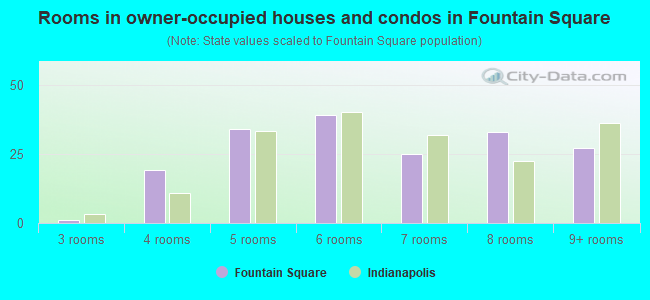
- Rooms in owner-occupied houses and condos in Fountain Square
- 01 room
- 02 rooms
- 13 rooms
- 194 rooms
- 345 rooms
- 396 rooms
- 257 rooms
- 338 rooms
- 279+ rooms
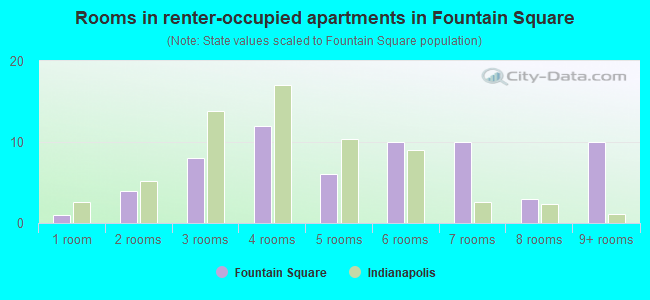
- Rooms in renter-occupied apartments in Fountain Square
- 11 room
- 42 rooms
- 83 rooms
- 124 rooms
- 65 rooms
- 106 rooms
- 107 rooms
- 38 rooms
- 109+ rooms
Owner-occupied
Renter-occupied
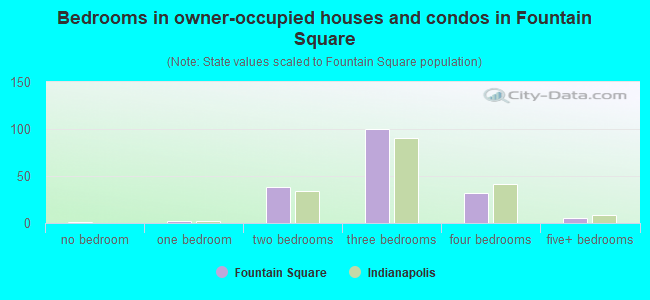
- Bedrooms in owner-occupied houses and condos in Fountain Square
- 1no bedroom
- 21 bedroom
- 382 bedrooms
- 1003 bedrooms
- 324 bedrooms
- 55+ bedrooms
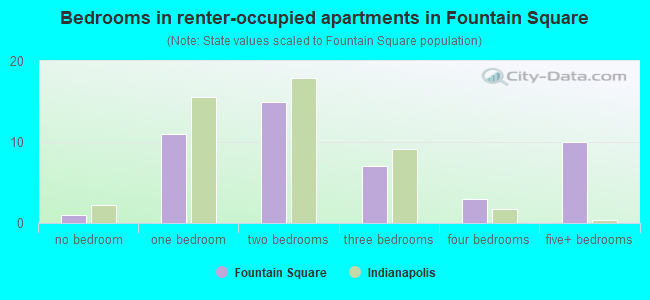
- Bedrooms in renter-occupied apartments in Fountain Square
- 1no bedroom
- 111 bedroom
- 152 bedrooms
- 73 bedrooms
- 34 bedrooms
- 105+ bedrooms
Average number of cars or other vehicles available in houses/condos:
Average number of cars or other vehicles available in apartments:
| This neighborhood: | 1.9 |
| Indianapolis: | 2.0 |
Average number of cars or other vehicles available in apartments:
| Here: | 2.1 |
| city: | 1.2 |
Percentage of units with a mortgage:
| Fountain Square: | 77.7% |
| Indianapolis: | 68.8% |
Average estimated value of detached houses in 2022 (76.9% of all units):
| Fountain Square: | $358,574 |
| Indiana: | $257,916 |
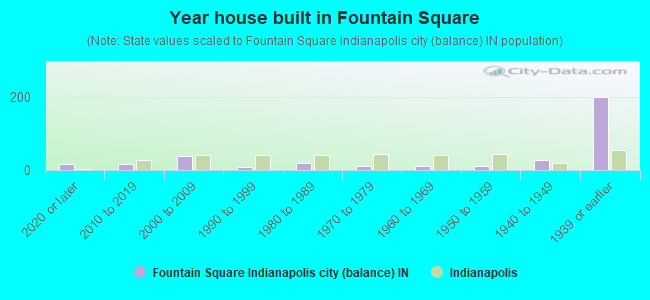
- Year house built in Fountain Square
- 162020 or later
- 172010 to 2019
- 392000 to 2009
- 91990 to 1999
- 181980 to 1989
- 111970 to 1979
- 121960 to 1969
- 101950 to 1959
- 271940 to 1949
- 2001939 or earlier
City-data.com crime index for city in 2020 (higher means more crime):
| City: | 465.4 |
| U.S. average: | 219.5 |
Travel time to work (commute)
![Travel time to work (commute)]()
- 2Less than 5 minutes
- 275 to 9 minutes
- 3010 to 14 minutes
- 3115 to 19 minutes
- 3520 to 24 minutes
- 1525 to 29 minutes
- 2430 to 34 minutes
- 435 to 39 minutes
- 140 to 44 minutes
- 1945 to 59 minutes
- 360 to 89 minutes
- 490 or more minutes

Means of transportation to work
![Means of transportation to work]()
- 66.9%231Drove a car alone
- 9.3%32Carpooled
- 1.2%4Bus
- 8.7%30Bicycle
- 2.3%8Walked
- 1.2%4Other means
- 17.4%60Worked at home

Time leaving home to go to work
![Time leaving home to go to work]()
- 612:00 a.m. to 4:59 a.m.
- 35:00 a.m. to 5:29 a.m.
- 45:30 a.m. to 5:59 a.m.
- 146:00 a.m. to 6:29 a.m.
- 136:30 a.m. to 6:59 a.m.
- 397:00 a.m. to 7:29 a.m.
- 227:30 a.m. to 7:59 a.m.
- 368:00 a.m. to 8:29 a.m.
- 78:30 a.m. to 8:59 a.m.
- 209:00 a.m. to 9:59 a.m.
- 410:00 a.m. to 10:59 a.m.
- 211:00 a.m. to 11:59 a.m.
- 1112:00 p.m. to 3:59 p.m.
- 24:00 p.m. to 11:59 p.m.

Occupations of males:
- Percentage of males in management occupations (except farmers):
Here: 25.7% city: 10.3%
- Percentage of males in business and financial operations occupations:
Here: 10.8% city: 5.4%
- Percentage of males in computer and mathematical occupations:
Here: 6.3% city: 4.6%
- Percentage of males in architecture and engineering occupations:
Here: 3.5% city: 2.6%
- Percentage of males in life, physical, and social science occupations:
Here: 1.7% city: 1.0%
- Percentage of males in community and social services occupations:
Here: 1.3% city: 1.3%
- Percentage of males in legal occupations:
Here: 1.3% city: 1.4%
- Percentage of males in education, training, and library occupations:
Here: 3.0% city: 2.8%
- Percentage of males in healthcare practitioners and technical occupations:
Here: 1.6% city: 2.7%
- Percentage of males in service occupations:
Here: 10.4% city: 12.5%
- Percentage of males in sales and office occupations:
Here: 11.0% city: 15.6%
- Percentage of males in construction, extraction, and maintenance occupations:
Here: 9.8% city: 7.9%
- Percentage of males in production occupations:
Here: 3.1% city: 9.0%
- Percentage of males in transportation occupations:
Here: 2.9% city: 6.4%
- Percentage of males in material moving occupations:
Here: 1.3% city: 9.4%
Occupations of females:
- Percentage of females in management occupations (except farmers):
Here: 9.8% city: 8.6%
- Percentage of females in business and financial operations occupations:
Here: 14.8% city: 6.9%
- Percentage of females in computer and mathematical occupations:
Here: 2.4% city: 2.0%
- Percentage of females in architecture and engineering occupations:
Here: 11.3% city: 0.7%
- Percentage of females in life, physical, and social science occupations:
Here: 2.9% city: 1.2%
- Percentage of females in community and social services occupations:
Here: 2.4% city: 2.8%
- Percentage of females in legal occupations:
Here: 5.3% city: 1.3%
- Percentage of females in education, training, and library occupations:
Here: 5.9% city: 7.5%
- Percentage of females in arts, design, entertainment, sports, and media occupations:
Here: 1.0% city: 2.1%
- Percentage of females in healthcare practitioners and technical occupations:
Here: 19.7% city: 10.8%
- Percentage of females in service occupations:
Here: 8.5% city: 18.5%
- Percentage of females in sales and office occupations:
Here: 17.2% city: 26.4%
- Percentage of females in construction, extraction, and maintenance occupations:
Here: 9.8% city: 0.4%
- Percentage of females in production occupations:
Here: 1.2% city: 4.5%
- Percentage of females in transportation occupations:
Here: 1.6% city: 1.2%
- Percentage of females in material moving occupations:
Here: 3.0% city: 4.9%
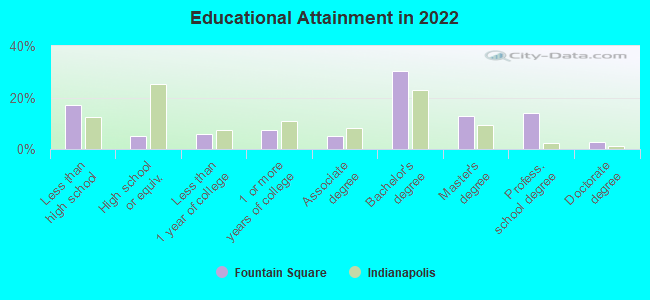
Education in this neighborhood (subdivision or community):
- Percentage of people 3 years and older in K-12 schools:
Fountain Square: 14.6% Indianapolis: 17.3%
- Percentage of people 3 years and older in undergraduate colleges:
Fountain Square: 16.3% Indianapolis: 4.5%
- Percentage of people 3 years and older in grad. or professional schools:
Fountain Square: 4.5% Indianapolis: 1.9%
- Percentage of students K-12 enrolled in private schools:
Fountain Square: 9.3% Indianapolis: 14.8%
Percentage of population below poverty level:
| Fountain Square: | 14.4% |
| Indianapolis: | 15.9% |
Median year renter moved in (as recorded in 2022):
| Fountain Square: | 2017 |
| Indianapolis: | 2020 |
Percentage of married-couple families with both working:
| Fountain Square: | 99.8% |
| Indianapolis: | 72.1% |
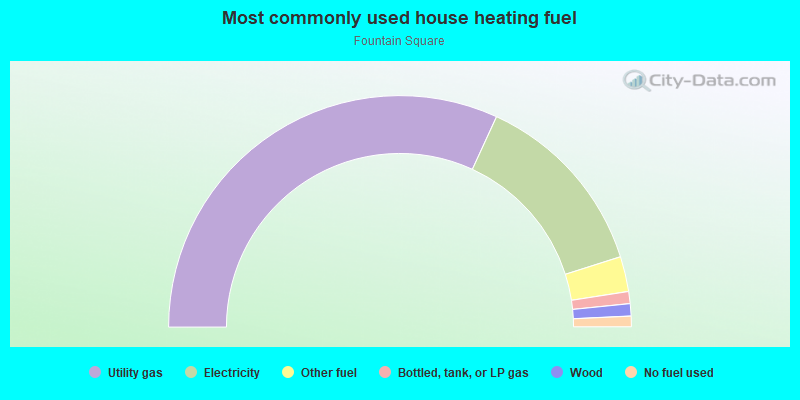
- 63.7%Utility gas
- 26.5%Electricity
- 4.9%Other fuel
- 1.7%Bottled, tank, or LP gas
- 1.7%Wood
- 1.5%No fuel used
Limited-access highways (interstate or state) in this neighborhood:
I- 65
Length: 0.14 miles
Directions: N-S, SE-NW
Directions: N-S, SE-NW
Roads and streets:
Prospect St
Length: 0.53 miles
Directions: E-W, SE-NW, SW-NE
Address range: 900 to 1153
Directions: E-W, SE-NW, SW-NE
Address range: 900 to 1153
E Morris St
Length: 0.50 miles
Directions: E-W, N-S, SW-NE
Address range: 801 to 1169
Directions: E-W, N-S, SW-NE
Address range: 801 to 1169
Sanders St
Length: 0.24 miles
Direction: E-W
Address range: 850 to 1099
Direction: E-W
Address range: 850 to 1099
Shelby St
Length: 0.12 miles
Direction: N-S
Address range: 1100 to 1279
Direction: N-S
Address range: 1100 to 1279
Virginia Ave
Length: 0.10 miles
Direction: SE-NW
Address range: 1080 to 1120
Direction: SE-NW
Address range: 1080 to 1120
Leonard St
Length: 0.07 miles
Directions: N-S, SW-NE
Directions: N-S, SW-NE
St Patrick St
Length: 0.05 miles
Direction: N-S
Address range: 1100 to 1199
Direction: N-S
Address range: 1100 to 1199