Franklin Canyon neighborhood in Hercules, California (CA), 94547, 94553 detailed profile
Settings
X


Business Search - 14 Million verified businesses
Area: 0.449 square miles
Population: 272
Population density:
| Franklin Canyon: | 606 people per square mile |
| Hercules: | 4,020 people per square mile |

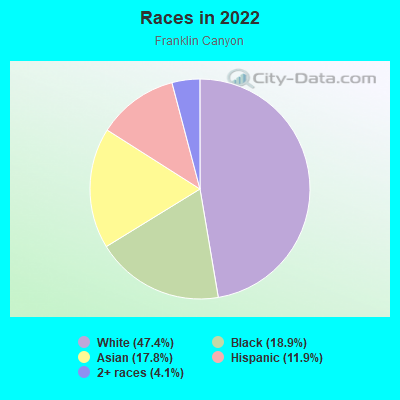
- 12847.4%White
- 5118.9%Black
- 4817.8%Asian
- 3211.9%Hispanic or Latino
- 114.1%Two or more races
Median household income in 2022:
| Franklin Canyon: | $183,647 |
| Hercules: | $125,880 |
Distribution of median household income
![Distribution of median household income]()
- 2Less than $10,000
- 9$10,000 to $19,999
- 11$20,000 to $29,999
- 2$30,000 to $39,999
- 3$40,000 to $49,999
- 4$50,000 to $59,999
- 4$60,000 to $74,999
- 7$75,000 to $99,999
- 5$100,000 to $124,999
- 7$125,000 to $149,999
- 11$150,000 to $199,999
- 49$200,000 or more

Distribution of owner-occupied house/condo value
![Distribution of owner-occupied house/condo value]()
- 31Less than $50,000
- 15$50,000 to $99,999
- 5$100,000 to $149,999
- 1$250,000 to $299,999
- 2$300,000 to $399,999
- 2$400,000 to $499,999
- 10$500,000 to $749,999
- 22$750,000 to $999,999
- 97$1,000,000 or more

Distribution of rent paid by renters
![Distribution of rent paid by renters]()
- 6$500 to $599
- 1$900 to $999
- 1$1,500 to $1,999
- 9$2,000 or more

Median rent in 2022:
| Franklin Canyon: | $3,226 |
| Hercules: | $2,001 |
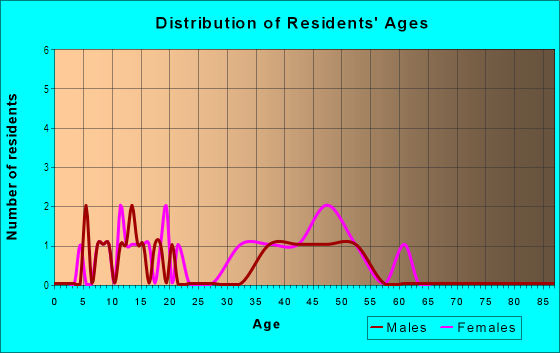
| Males: | 128 |
| Females: | 144 |
Males:
| This neighborhood: | 48.8 years |
| Whole city: | 42.1 years |
| This neighborhood: | 47.5 years |
| Whole city: | 43.0 years |
Average household size:
| Franklin Canyon: | 2.8 people |
| Hercules: | 2.9 people |
Percentage of family households:
| Franklin Canyon: | 42.1% |
| Hercules: | 45.9% |
| Here: | 66.1% |
| Hercules: | 55.9% |
Percentage of married-couple families with children (among all households):
| Franklin Canyon: | 35.4% |
| Hercules: | 28.8% |
Percentage of single-mother households (among all households):
| Franklin Canyon: | 1.6% |
| Hercules: | 5.2% |
Percentage of never married males 15 years old and over:
Percentage of never married females 15 years old and over:
| Franklin Canyon: | 11.1% |
| Hercules: | 14.8% |
Percentage of never married females 15 years old and over:
| Franklin Canyon: | 15.0% |
| city: | 16.1% |
Percentage of people that speak English not well or not at all:
| Franklin Canyon: | 1.1% |
| Hercules: | 4.2% |
Percentage of people born in this state:
Percentage of people born in another U.S. state:
Percentage of native residents but born outside the U.S.:
Percentage of foreign born residents:
| Here: | 62.8% |
| Hercules: | 53.9% |
Percentage of people born in another U.S. state:
| Franklin Canyon: | 11.5% |
| Hercules: | 9.6% |
Percentage of native residents but born outside the U.S.:
| Here: | 1.4% |
| city: | 4.2% |
Percentage of foreign born residents:
| Here: | 24.3% |
| Hercules: | 32.3% |
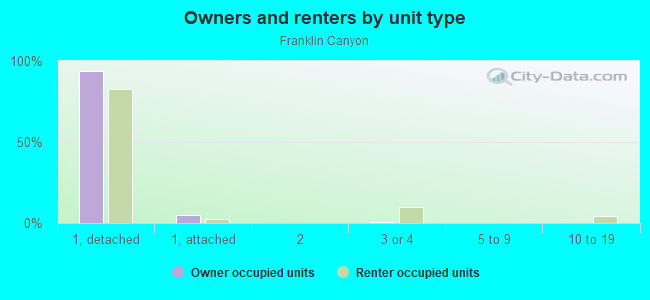
Owner-occupied
Renter-occupied

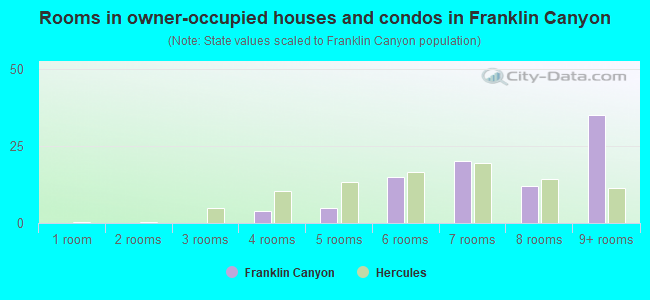
- Rooms in owner-occupied houses and condos in Franklin Canyon
- 01 room
- 02 rooms
- 03 rooms
- 44 rooms
- 55 rooms
- 156 rooms
- 207 rooms
- 128 rooms
- 359+ rooms
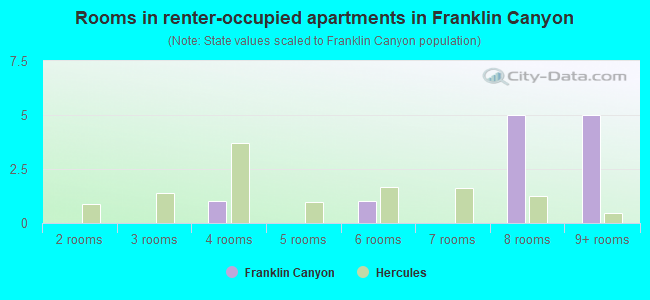
- Rooms in renter-occupied apartments in Franklin Canyon
- 01 room
- 02 rooms
- 03 rooms
- 14 rooms
- 05 rooms
- 16 rooms
- 07 rooms
- 58 rooms
- 59+ rooms
Owner-occupied
Renter-occupied
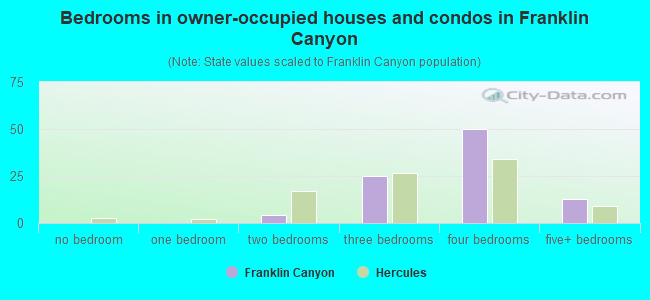
- Bedrooms in owner-occupied houses and condos in Franklin Canyon
- 0no bedroom
- 01 bedroom
- 42 bedrooms
- 253 bedrooms
- 504 bedrooms
- 135+ bedrooms
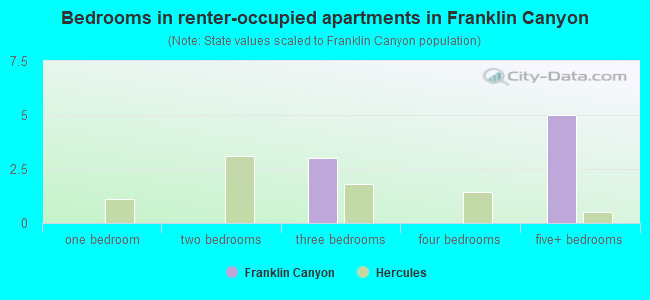
- Bedrooms in renter-occupied apartments in Franklin Canyon
- 0no bedroom
- 01 bedroom
- 02 bedrooms
- 33 bedrooms
- 04 bedrooms
- 55+ bedrooms
Average number of cars or other vehicles available in houses/condos:
Average number of cars or other vehicles available in apartments:
| This neighborhood: | 2.7 |
| Hercules: | 2.2 |
Average number of cars or other vehicles available in apartments:
| Here: | 1.8 |
| city: | 1.9 |
Percentage of units with a mortgage:
| Franklin Canyon: | 60.0% |
| Hercules: | 80.1% |
Housing prices:
- Average estimated value of detached houses in 2022 (92.2% of all units):
Franklin Canyon: $1,173,393 California: $988,808
- Average estimated value of townhouses or other attached units in 2022 (3.9% of all units):
This neighborhood: $1,387,470 California: $838,546
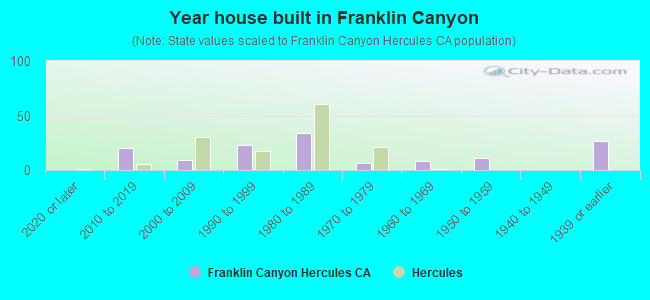
- Year house built in Franklin Canyon
- 02020 or later
- 202010 to 2019
- 92000 to 2009
- 231990 to 1999
- 341980 to 1989
- 61970 to 1979
- 81960 to 1969
- 111950 to 1959
- 01940 to 1949
- 271939 or earlier
City-data.com crime index for city in 2020 (higher means more crime):
| City: | 77.5 |
| U.S. average: | 219.5 |
Travel time to work (commute)
![Travel time to work (commute)]()
- 1Less than 5 minutes
- 25 to 9 minutes
- 310 to 14 minutes
- 915 to 19 minutes
- 620 to 24 minutes
- 625 to 29 minutes
- 1630 to 34 minutes
- 240 to 44 minutes
- 545 to 59 minutes
- 1560 to 89 minutes
- 790 or more minutes

Means of transportation to work
![Means of transportation to work]()
- 55.8%73Drove a car alone
- 3.8%5Carpooled
- 2.3%3Subway or elevated rail
- 5.3%7Long-distance train or commuter rail
- 6.9%9Bicycle
- 16.0%21Walked
- 1.5%2Other means
- 28.3%37Worked at home

Time leaving home to go to work
![Time leaving home to go to work]()
- 612:00 a.m. to 4:59 a.m.
- 75:00 a.m. to 5:29 a.m.
- 45:30 a.m. to 5:59 a.m.
- 76:00 a.m. to 6:29 a.m.
- 36:30 a.m. to 6:59 a.m.
- 107:00 a.m. to 7:29 a.m.
- 147:30 a.m. to 7:59 a.m.
- 128:00 a.m. to 8:29 a.m.
- 38:30 a.m. to 8:59 a.m.
- 59:00 a.m. to 9:59 a.m.
- 211:00 a.m. to 11:59 a.m.
- 512:00 p.m. to 3:59 p.m.
- 14:00 p.m. to 11:59 p.m.

Occupations of males:
- Percentage of males in management occupations (except farmers):
Here: 31.1% city: 11.6%
- Percentage of males in business and financial operations occupations:
Here: 2.3% city: 7.0%
- Percentage of males in computer and mathematical occupations:
Here: 9.6% city: 9.5%
- Percentage of males in architecture and engineering occupations:
Here: 8.1% city: 3.1%
- Percentage of males in legal occupations:
Here: 5.2% city: 0.6%
- Percentage of males in healthcare practitioners and technical occupations:
Here: 1.1% city: 5.1%
- Percentage of males in service occupations:
Here: 9.9% city: 8.8%
- Percentage of males in sales and office occupations:
Here: 16.5% city: 20.8%
- Percentage of males in farming, fishing, and forestry occupations:
Here: 1.9% city: 0.6%
- Percentage of males in construction, extraction, and maintenance occupations:
Here: 1.5% city: 5.4%
- Percentage of males in production occupations:
Here: 6.3% city: 5.0%
- Percentage of males in material moving occupations:
Here: 3.2% city: 3.1%
Occupations of females:
- Percentage of females in management occupations (except farmers):
Here: 25.2% city: 11.6%
- Percentage of females in business and financial operations occupations:
Here: 16.2% city: 8.6%
- Percentage of females in computer and mathematical occupations:
Here: 1.3% city: 2.2%
- Percentage of females in life, physical, and social science occupations:
Here: 2.2% city: 2.2%
- Percentage of females in community and social services occupations:
Here: 8.2% city: 4.7%
- Percentage of females in education, training, and library occupations:
Here: 2.8% city: 6.0%
- Percentage of females in arts, design, entertainment, sports, and media occupations:
Here: 1.8% city: 1.4%
- Percentage of females in healthcare practitioners and technical occupations:
Here: 11.1% city: 14.5%
- Percentage of females in service occupations:
Here: 5.1% city: 14.7%
- Percentage of females in sales and office occupations:
Here: 25.9% city: 29.1%
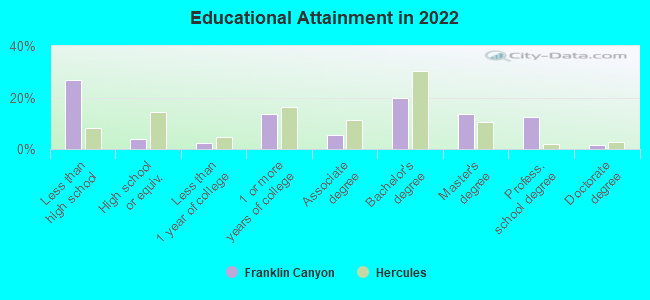
Education in this neighborhood (subdivision or community):
- Percentage of people 3 years and older in K-12 schools:
Franklin Canyon: 14.7% Hercules: 15.4%
- Percentage of people 3 years and older in undergraduate colleges:
Franklin Canyon: 4.4% Hercules: 6.7%
- Percentage of people 3 years and older in grad. or professional schools:
Franklin Canyon: 4.8% Hercules: 1.4%
- Percentage of students K-12 enrolled in private schools:
Franklin Canyon: 100.0% Hercules: 18.3%
Percentage of population below poverty level:
| Franklin Canyon: | 8.4% |
| Hercules: | 4.7% |
Median year owner moved in (as recorded in 2022):
Median year renter moved in (as recorded in 2022):
| Franklin Canyon: | 2003 |
| Hercules: | 2006 |
Median year renter moved in (as recorded in 2022):
| Franklin Canyon: | 2017 |
| Hercules: | 2015 |
Percentage of married-couple families with both working:
| Franklin Canyon: | 80.5% |
| Hercules: | 77.0% |
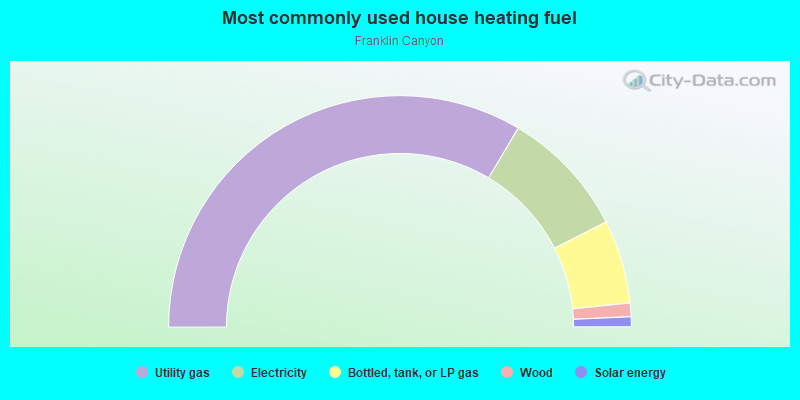
- 67.1%Utility gas
- 17.9%Electricity
- 11.7%Bottled, tank, or LP gas
- 1.9%Wood
- 1.4%Solar energy
Roads and streets:
Carson Rd (Carson St)
Length: 0.20 miles
Direction: SE-NW
Address range: 100 to 199
Direction: SE-NW
Address range: 100 to 199
Stanley Ct
Length: 0.09 miles
Direction: E-W
Address range: 100 to 199
Direction: E-W
Address range: 100 to 199