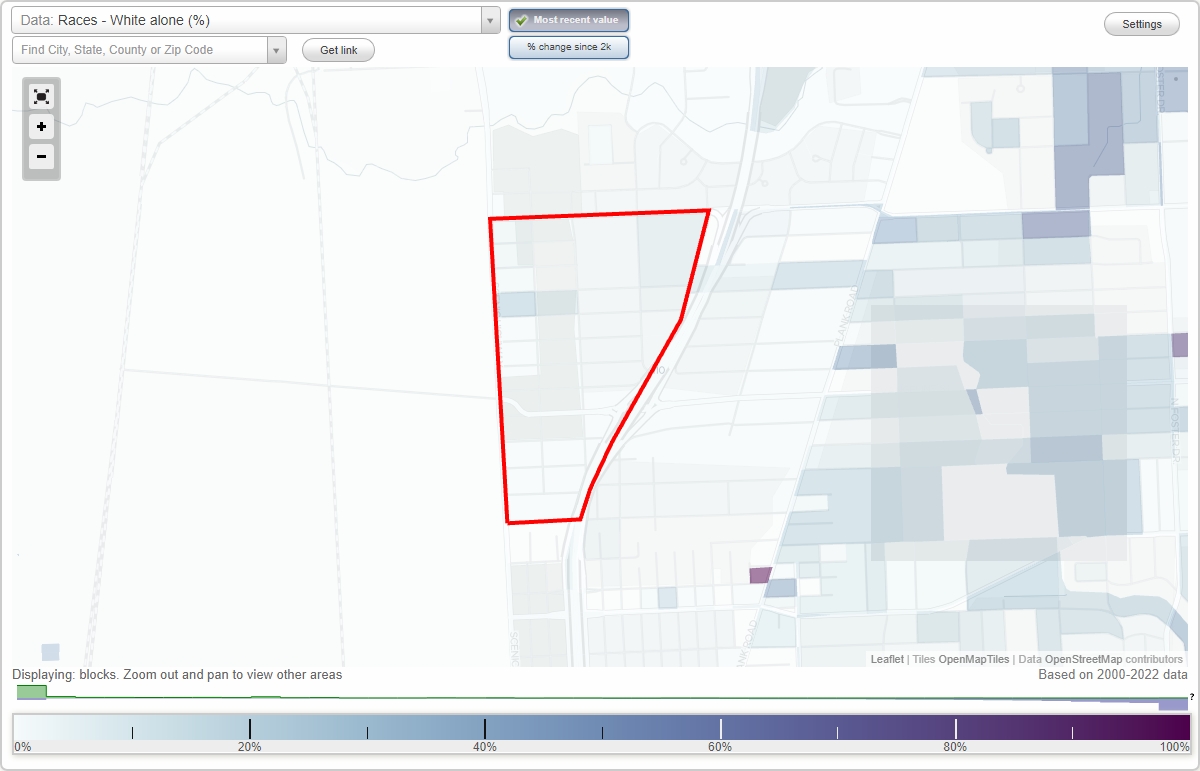
Garden City neighborhood in Baton Rouge, Louisiana (LA), 70805 detailed profile
Settings
X

Business Search - 14 Million verified businesses
Area: 0.302 square miles
Population: 955
Population density:
| Garden City: | 3,163 people per square mile |
| Baton Rouge: | 2,882 people per square mile |

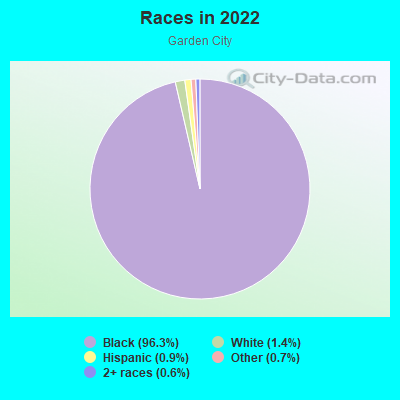
- 94496.3%Black
- 141.4%White
- 90.9%Hispanic or Latino
- 70.7%Some other race
- 60.6%Two or more races
Median household income in 2022:
| Garden City: | $37,708 |
| Baton Rouge: | $50,304 |
Distribution of median household income
![Distribution of median household income]()
- 72Less than $10,000
- 61$10,000 to $19,999
- 72$20,000 to $29,999
- 8$30,000 to $39,999
- 62$40,000 to $49,999
- 6$50,000 to $59,999
- 87$60,000 to $74,999
- 84$75,000 to $99,999
- 21$100,000 to $124,999
- 13$125,000 to $149,999
- 4$150,000 to $199,999
- 1$200,000 or more

Distribution of owner-occupied house/condo value
![Distribution of owner-occupied house/condo value]()
- 88Less than $50,000
- 155$50,000 to $99,999
- 32$100,000 to $149,999
- 9$150,000 to $199,999
- 1$200,000 to $249,999
- 1$250,000 to $299,999
- 32$300,000 to $399,999
- 2$750,000 to $999,999
- 18$1,000,000 or more

Distribution of rent paid by renters
![Distribution of rent paid by renters]()
- 3Less than $100
- 14$100 to $199
- 33$200 to $299
- 89$400 to $499
- 91$500 to $599
- 57$600 to $699
- 53$700 to $799
- 37$800 to $899
- 17$900 to $999
- 42$1,000 to $1,249
- 51$1,500 to $1,999

Median rent in 2022:
| Garden City: | $601 |
| Baton Rouge: | $832 |
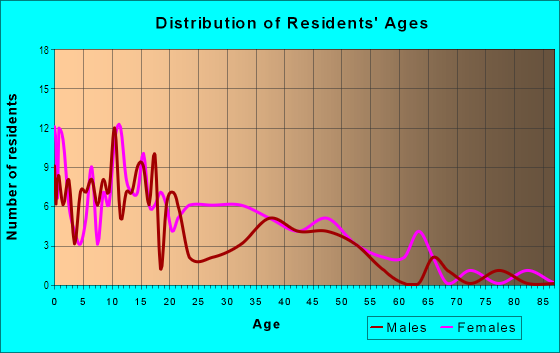
| Males: | 391 |
| Females: | 563 |
Males:
| This neighborhood: | 39.9 years |
| Whole city: | 29.6 years |
| This neighborhood: | 37.5 years |
| Whole city: | 32.8 years |
Average household size:
| Garden City: | 2.1 people |
| Baton Rouge: | 2.3 people |
Percentage of family households:
| Garden City: | 23.6% |
| Baton Rouge: | 36.6% |
| Here: | 20.2% |
| Baton Rouge: | 27.8% |
Percentage of married-couple families with children (among all households):
| Garden City: | 30.9% |
| Baton Rouge: | 15.1% |
Percentage of single-mother households (among all households):
| Garden City: | 8.3% |
| Baton Rouge: | 22.4% |
Percentage of never married males 15 years old and over:
Percentage of never married females 15 years old and over:
| Garden City: | 21.1% |
| Baton Rouge: | 27.3% |
Percentage of never married females 15 years old and over:
| Garden City: | 23.0% |
| city: | 27.2% |
Percentage of people that speak English not well or not at all:
| Garden City: | 0.0% |
| Baton Rouge: | 1.8% |
Percentage of people born in this state:
Percentage of people born in another U.S. state:
Percentage of native residents but born outside the U.S.:
Percentage of foreign born residents:
| Here: | 93.6% |
| Baton Rouge: | 74.7% |
Percentage of people born in another U.S. state:
| Garden City: | 6.4% |
| Baton Rouge: | 17.8% |
Percentage of native residents but born outside the U.S.:
| Here: | 0.0% |
| city: | 0.5% |
Percentage of foreign born residents:
| Here: | 0.3% |
| Baton Rouge: | 7.0% |
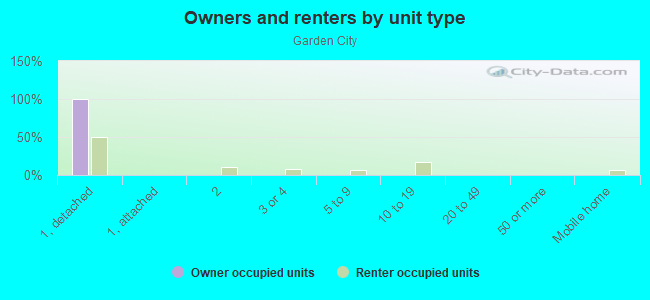
Owner-occupied
Renter-occupied

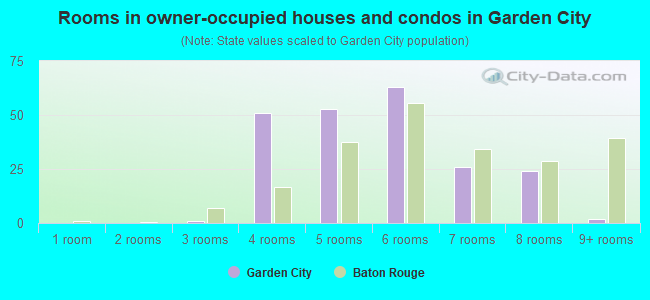
- Rooms in owner-occupied houses and condos in Garden City
- 01 room
- 02 rooms
- 13 rooms
- 514 rooms
- 535 rooms
- 636 rooms
- 267 rooms
- 248 rooms
- 29+ rooms
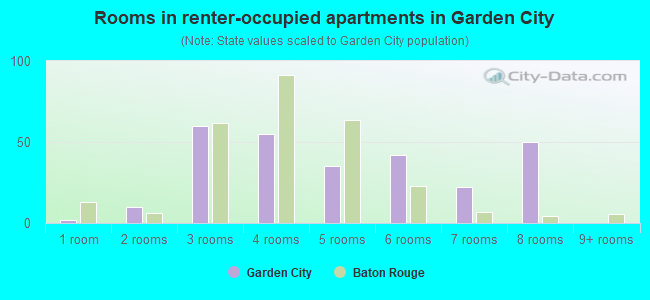
- Rooms in renter-occupied apartments in Garden City
- 21 room
- 102 rooms
- 603 rooms
- 554 rooms
- 355 rooms
- 426 rooms
- 227 rooms
- 508 rooms
- 09+ rooms
Owner-occupied
Renter-occupied
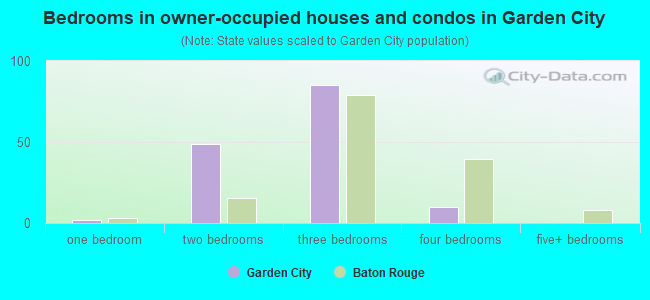
- Bedrooms in owner-occupied houses and condos in Garden City
- 0no bedroom
- 21 bedroom
- 492 bedrooms
- 853 bedrooms
- 104 bedrooms
- 05+ bedrooms
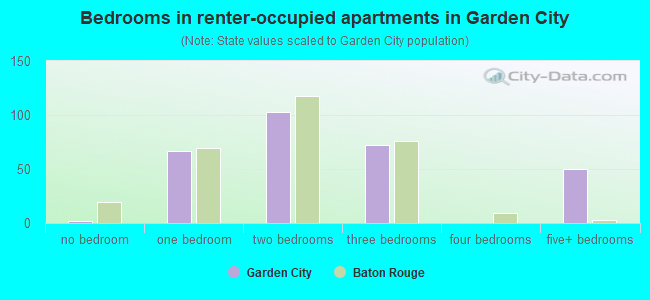
- Bedrooms in renter-occupied apartments in Garden City
- 2no bedroom
- 671 bedroom
- 1032 bedrooms
- 723 bedrooms
- 04 bedrooms
- 505+ bedrooms
Average number of cars or other vehicles available in houses/condos:
Average number of cars or other vehicles available in apartments:
| This neighborhood: | 1.4 |
| Baton Rouge: | 1.7 |
Average number of cars or other vehicles available in apartments:
| Here: | 1.6 |
| city: | 1.3 |
Percentage of units with a mortgage:
| Garden City: | 28.6% |
| Baton Rouge: | 56.3% |
Average estimated value of detached houses in 2022 (78.3% of all units):
| Garden City: | $69,957 |
| Louisiana: | $273,555 |
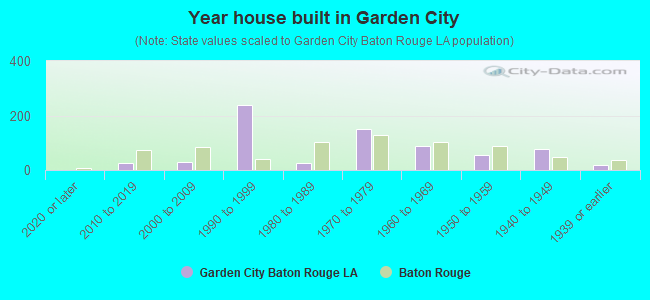
- Year house built in Garden City
- 02020 or later
- 262010 to 2019
- 282000 to 2009
- 2391990 to 1999
- 251980 to 1989
- 1501970 to 1979
- 891960 to 1969
- 561950 to 1959
- 781940 to 1949
- 171939 or earlier
City-data.com crime index for city in 2020 (higher means more crime):
| City: | 544.1 |
| U.S. average: | 219.5 |
Travel time to work (commute)
![Travel time to work (commute)]()
- 38Less than 5 minutes
- 235 to 9 minutes
- 2810 to 14 minutes
- 4915 to 19 minutes
- 1520 to 24 minutes
- 525 to 29 minutes
- 2330 to 34 minutes
- 2635 to 39 minutes
- 1840 to 44 minutes
- 8545 to 59 minutes
- 1160 to 89 minutes
- 1290 or more minutes

Means of transportation to work
![Means of transportation to work]()
- 97.6%410Drove a car alone
- 2.1%9Carpooled
- 1.7%7Bus
- 4.3%18Bicycle
- 28.1%118Walked
- 0.2%1Other means
- 1.2%5Worked at home

Time leaving home to go to work
![Time leaving home to go to work]()
- 712:00 a.m. to 4:59 a.m.
- 355:00 a.m. to 5:29 a.m.
- 85:30 a.m. to 5:59 a.m.
- 56:00 a.m. to 6:29 a.m.
- 426:30 a.m. to 6:59 a.m.
- 857:00 a.m. to 7:29 a.m.
- 167:30 a.m. to 7:59 a.m.
- 318:00 a.m. to 8:29 a.m.
- 38:30 a.m. to 8:59 a.m.
- 129:00 a.m. to 9:59 a.m.
- 610:00 a.m. to 10:59 a.m.
- 1411:00 a.m. to 11:59 a.m.
- 2212:00 p.m. to 3:59 p.m.
- 194:00 p.m. to 11:59 p.m.

Occupations of males:
- Percentage of males in management occupations (except farmers):
Here: 18.9% city: 9.5%
- Percentage of males in education, training, and library occupations:
Here: 15.1% city: 6.9%
- Percentage of males in sales and office occupations:
Here: 10.1% city: 12.7%
- Percentage of males in construction, extraction, and maintenance occupations:
Here: 28.3% city: 8.7%
- Percentage of males in production occupations:
Here: 9.8% city: 6.5%
- Percentage of males in transportation occupations:
Here: 3.2% city: 6.6%
- Percentage of males in material moving occupations:
Here: 14.7% city: 7.0%
Occupations of females:
- Percentage of females in management occupations (except farmers):
Here: 33.9% city: 8.6%
- Percentage of females in architecture and engineering occupations:
Here: 1.1% city: 1.0%
- Percentage of females in education, training, and library occupations:
Here: 45.8% city: 10.7%
- Percentage of females in service occupations:
Here: 5.6% city: 24.5%
- Percentage of females in sales and office occupations:
Here: 4.3% city: 26.5%
- Percentage of females in production occupations:
Here: 2.4% city: 1.8%
- Percentage of females in transportation occupations:
Here: 6.9% city: 1.4%
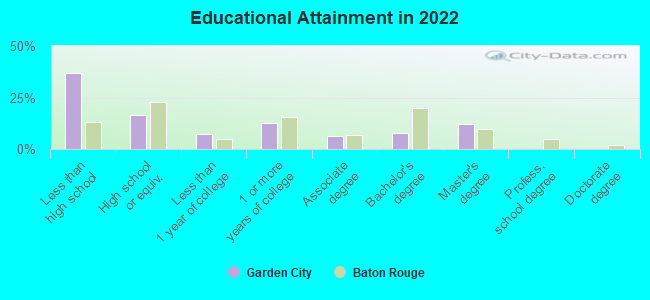
Education in this neighborhood (subdivision or community):
- Percentage of people 3 years and older in K-12 schools:
Garden City: 33.0% Baton Rouge: 14.3%
- Percentage of people 3 years and older in undergraduate colleges:
Garden City: 6.4% Baton Rouge: 14.0%
- Percentage of people 3 years and older in grad. or professional schools:
Garden City: 10.9% Baton Rouge: 2.5%
- Percentage of students K-12 enrolled in private schools:
Garden City: 4.6% Baton Rouge: 22.0%
Percentage of population below poverty level:
| Garden City: | 34.1% |
| Baton Rouge: | 22.4% |
Median year owner moved in (as recorded in 2022):
Median year renter moved in (as recorded in 2022):
| Garden City: | 1995 |
| Baton Rouge: | 2007 |
Median year renter moved in (as recorded in 2022):
| Garden City: | 2014 |
| Baton Rouge: | 2020 |
Percentage of married-couple families with both working:
| Garden City: | 92.0% |
| Baton Rouge: | 80.7% |
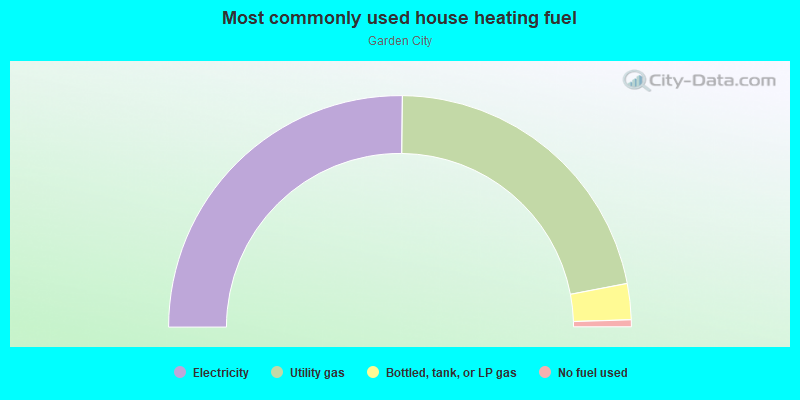
- 50.3%Electricity
- 43.6%Utility gas
- 5.0%Bottled, tank, or LP gas
- 1.0%No fuel used
Limited-access highways (interstate or state) in this neighborhood:
I- 110
Length: 0.34 miles
Directions: N-S, SW-NE
Directions: N-S, SW-NE
Roads and streets:
Baton Rouge Ave
Length: 0.72 miles
Directions: N-S, SW-NE
Address range: 4300 to 5399
Directions: N-S, SW-NE
Address range: 4300 to 5399
Alamoster Ave (Alamoster Dr)
Length: 0.67 miles
Directions: N-S, SE-NW
Address range: 4300 to 5399
Directions: N-S, SE-NW
Address range: 4300 to 5399
Lorraine St
Length: 0.46 miles
Direction: E-W
Address range: 2300 to 2899
Direction: E-W
Address range: 2300 to 2899
Iberia St
Length: 0.43 miles
Direction: E-W
Address range: 2300 to 2899
Direction: E-W
Address range: 2300 to 2899
Beech St
Length: 0.41 miles
Direction: E-W
Address range: 2300 to 2899
Direction: E-W
Address range: 2300 to 2899
Douglas Ave
Length: 0.33 miles
Directions: N-S, SW-NE
Address range: 4801 to 5461
Directions: N-S, SW-NE
Address range: 4801 to 5461
Farrar St
Length: 0.32 miles
Directions: E-W, SW-NE
Address range: 2300 to 2699
Directions: E-W, SW-NE
Address range: 2300 to 2699
Evangeline St
Length: 0.32 miles
Directions: E-W, SE-NW, SW-NE
Address range: 2300 to 2599
Directions: E-W, SE-NW, SW-NE
Address range: 2300 to 2599
Galvez St
Length: 0.31 miles
Direction: E-W
Address range: 2300 to 2699
Direction: E-W
Address range: 2300 to 2699
Breckenridge Ave
Length: 0.24 miles
Directions: N-S, SE-NW
Address range: 4901 to 5199
Directions: N-S, SE-NW
Address range: 4901 to 5199
Shelley St
Length: 0.18 miles
Direction: E-W
Address range: 2300 to 2599
Direction: E-W
Address range: 2300 to 2599
Cable St
Length: 0.14 miles
Direction: E-W
Address range: 2300 to 2611
Direction: E-W
Address range: 2300 to 2611
Kelvin St
Length: 0.13 miles
Direction: E-W
Address range: 2300 to 2499
Direction: E-W
Address range: 2300 to 2499
Riley St
Length: 0.12 miles
Direction: E-W
Address range: 2300 to 2499
Direction: E-W
Address range: 2300 to 2499
Sherwood St
Length: 0.11 miles
Direction: E-W
Address range: 2300 to 2499
Direction: E-W
Address range: 2300 to 2499
(Interstate 110 (Mlk Expressway) Hwy N)
Length: 0.02 miles
Direction: SW-NE
Direction: SW-NE
(Sherman St)
Length: 0.02 miles
Direction: E-W
Direction: E-W
Dayton St
Length: 0.01 miles
Direction: E-W
Address range: 2412 to 2511
Direction: E-W
Address range: 2412 to 2511