Garvinwood neighborhood in Evansville, Indiana (IN), 47711 detailed profile
Settings
X


Business Search - 14 Million verified businesses
Area: 0.165 square miles
Population: 911
Population density:
| Garvinwood: | 5,529 people per square mile |
| Evansville: | 2,912 people per square mile |

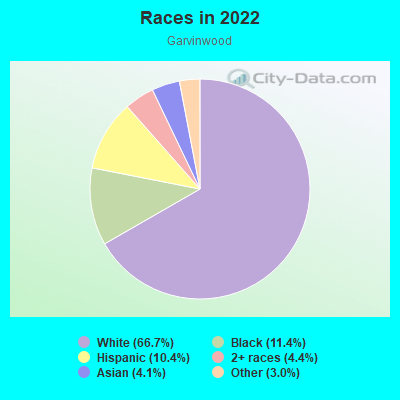
- 62766.7%White
- 10711.4%Black
- 9810.4%Hispanic or Latino
- 414.4%Two or more races
- 394.1%Asian
- 283.0%Some other race
Median household income in 2022:
| Garvinwood: | $43,031 |
| Evansville: | $48,127 |
Distribution of median household income
![Distribution of median household income]()
- 49Less than $10,000
- 52$10,000 to $19,999
- 27$20,000 to $29,999
- 49$30,000 to $39,999
- 49$40,000 to $49,999
- 14$50,000 to $59,999
- 41$60,000 to $74,999
- 24$75,000 to $99,999
- 34$100,000 to $124,999
- 31$125,000 to $149,999
- 9$150,000 to $199,999
- 2$200,000 or more

Distribution of owner-occupied house/condo value
![Distribution of owner-occupied house/condo value]()
- 58Less than $50,000
- 134$50,000 to $99,999
- 30$100,000 to $149,999
- 18$150,000 to $199,999
- 2$250,000 to $299,999
- 3$400,000 to $499,999
- 2$500,000 to $749,999

Distribution of rent paid by renters
![Distribution of rent paid by renters]()
- 12Less than $100
- 12$200 to $299
- 66$300 to $399
- 20$400 to $499
- 35$500 to $599
- 43$600 to $699
- 72$700 to $799
- 51$800 to $899
- 7$900 to $999
- 8$1,000 to $1,249
- 9$1,250 to $1,499

Median rent in 2022:
| Garvinwood: | $700 |
| Evansville: | $691 |
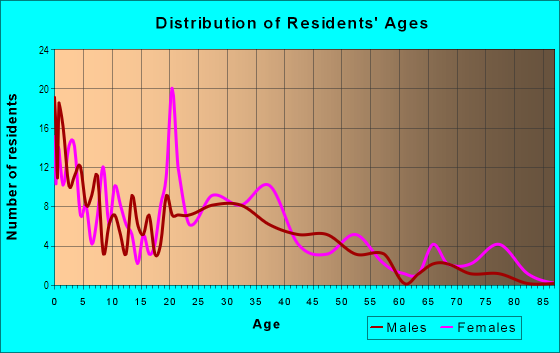
| Males: | 442 |
| Females: | 468 |
Males:
| This neighborhood: | 26.4 years |
| Whole city: | 36.6 years |
| This neighborhood: | 28.9 years |
| Whole city: | 38.9 years |
Average household size:
| Garvinwood: | 2.2 people |
| Evansville: | 2.1 people |
Percentage of family households:
| Garvinwood: | 36.1% |
| Evansville: | 38.3% |
| Here: | 28.0% |
| Evansville: | 33.7% |
Percentage of married-couple families with children (among all households):
| Garvinwood: | 23.3% |
| Evansville: | 25.3% |
Percentage of single-mother households (among all households):
| Garvinwood: | 56.7% |
| Evansville: | 15.6% |
Percentage of never married males 15 years old and over:
Percentage of never married females 15 years old and over:
| Garvinwood: | 22.4% |
| Evansville: | 19.5% |
Percentage of never married females 15 years old and over:
| Garvinwood: | 33.9% |
| city: | 17.0% |
Percentage of people that speak English not well or not at all:
| Garvinwood: | 0.0% |
| Evansville: | 0.7% |
Percentage of people born in this state:
Percentage of people born in another U.S. state:
Percentage of native residents but born outside the U.S.:
Percentage of foreign born residents:
| Here: | 71.3% |
| Evansville: | 70.5% |
Percentage of people born in another U.S. state:
| Garvinwood: | 24.4% |
| Evansville: | 25.5% |
Percentage of native residents but born outside the U.S.:
| Here: | 1.1% |
| city: | 0.8% |
Percentage of foreign born residents:
| Here: | 3.2% |
| Evansville: | 3.2% |
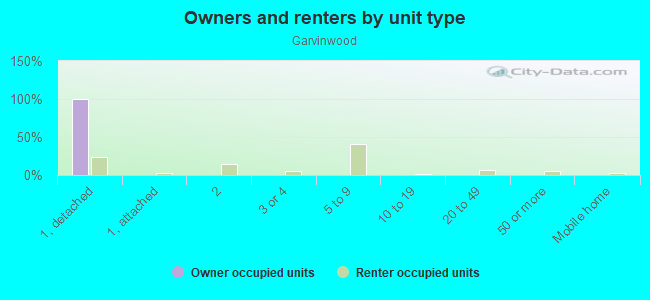
Owner-occupied
Renter-occupied

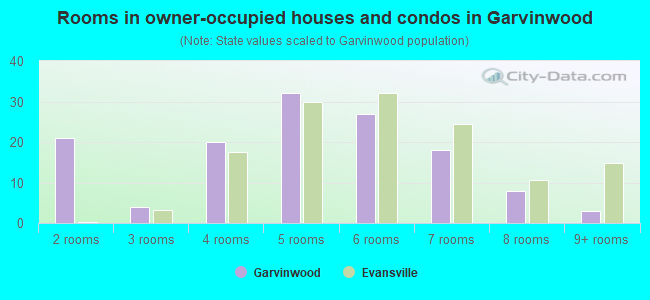
- Rooms in owner-occupied houses and condos in Garvinwood
- 01 room
- 212 rooms
- 43 rooms
- 204 rooms
- 325 rooms
- 276 rooms
- 187 rooms
- 88 rooms
- 39+ rooms
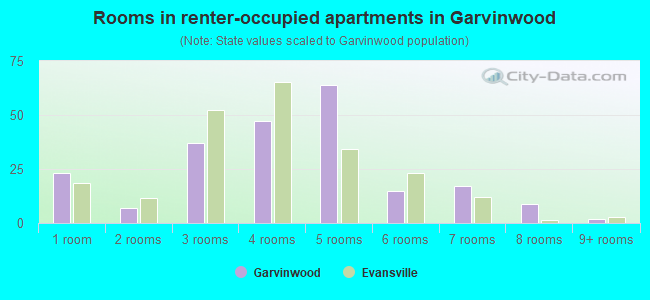
- Rooms in renter-occupied apartments in Garvinwood
- 231 room
- 72 rooms
- 373 rooms
- 474 rooms
- 645 rooms
- 156 rooms
- 177 rooms
- 98 rooms
- 29+ rooms
Owner-occupied
Renter-occupied
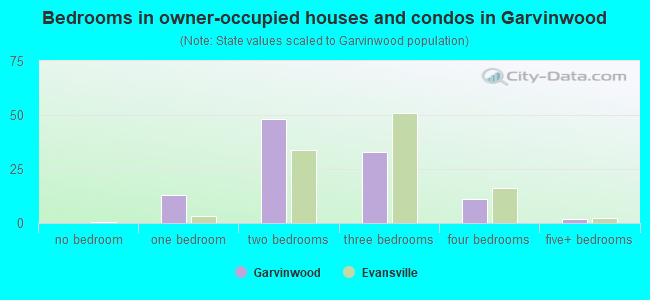
- Bedrooms in owner-occupied houses and condos in Garvinwood
- 0no bedroom
- 131 bedroom
- 482 bedrooms
- 333 bedrooms
- 114 bedrooms
- 25+ bedrooms
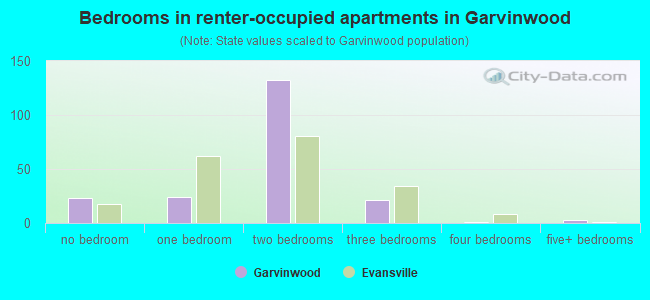
- Bedrooms in renter-occupied apartments in Garvinwood
- 23no bedroom
- 241 bedroom
- 1322 bedrooms
- 213 bedrooms
- 14 bedrooms
- 35+ bedrooms
Average number of cars or other vehicles available in houses/condos:
Average number of cars or other vehicles available in apartments:
| This neighborhood: | 1.9 |
| Evansville: | 1.8 |
Average number of cars or other vehicles available in apartments:
| Here: | 0.9 |
| city: | 1.1 |
Percentage of units with a mortgage:
| Garvinwood: | 67.2% |
| Evansville: | 58.5% |
Average estimated value of detached houses in 2022 (64.6% of all units):
| Garvinwood: | $85,718 |
| Indiana: | $257,916 |
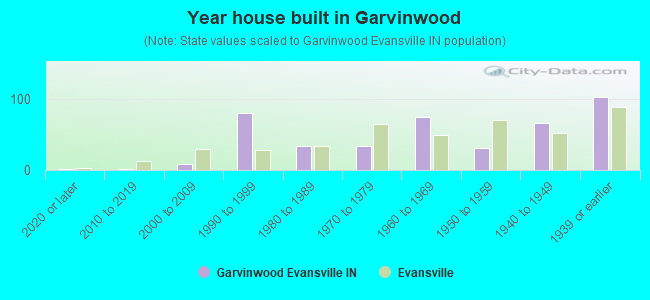
- Year house built in Garvinwood
- 22020 or later
- 22010 to 2019
- 82000 to 2009
- 801990 to 1999
- 331980 to 1989
- 331970 to 1979
- 751960 to 1969
- 311950 to 1959
- 661940 to 1949
- 1021939 or earlier
City-data.com crime index for city in 2020 (higher means more crime):
| City: | 440.8 |
| U.S. average: | 219.5 |
Travel time to work (commute)
![Travel time to work (commute)]()
- 19Less than 5 minutes
- 405 to 9 minutes
- 11910 to 14 minutes
- 7815 to 19 minutes
- 3720 to 24 minutes
- 925 to 29 minutes
- 2130 to 34 minutes
- 435 to 39 minutes
- 3145 to 59 minutes
- 460 to 89 minutes
- 1090 or more minutes

Means of transportation to work
![Means of transportation to work]()
- 70.9%264Drove a car alone
- 2.1%8Carpooled
- 0.8%3Bus
- 0.3%1Motorcycle
- 0.8%3Bicycle
- 51.6%192Walked
- 1.1%4Other means
- 9.7%36Worked at home

Time leaving home to go to work
![Time leaving home to go to work]()
- 3212:00 a.m. to 4:59 a.m.
- 205:00 a.m. to 5:29 a.m.
- 205:30 a.m. to 5:59 a.m.
- 256:00 a.m. to 6:29 a.m.
- 136:30 a.m. to 6:59 a.m.
- 527:00 a.m. to 7:29 a.m.
- 277:30 a.m. to 7:59 a.m.
- 168:00 a.m. to 8:29 a.m.
- 198:30 a.m. to 8:59 a.m.
- 179:00 a.m. to 9:59 a.m.
- 1010:00 a.m. to 10:59 a.m.
- 411:00 a.m. to 11:59 a.m.
- 5812:00 p.m. to 3:59 p.m.
- 414:00 p.m. to 11:59 p.m.

Occupations of males:
- Percentage of males in management occupations (except farmers):
Here: 4.5% city: 8.4%
- Percentage of males in business and financial operations occupations:
Here: 105.3% city: 3.1%
- Percentage of males in computer and mathematical occupations:
Here: 147.4% city: 3.0%
- Percentage of males in architecture and engineering occupations:
Here: 1.9% city: 3.0%
- Percentage of males in education, training, and library occupations:
Here: 5.8% city: 2.7%
- Percentage of males in arts, design, entertainment, sports, and media occupations:
Here: 5.8% city: 1.4%
- Percentage of males in service occupations:
Here: 22.6% city: 15.9%
- Percentage of males in sales and office occupations:
Here: 22.4% city: 14.7%
- Percentage of males in production occupations:
Here: 10.5% city: 14.9%
- Percentage of males in transportation occupations:
Here: 11.9% city: 7.3%
- Percentage of males in material moving occupations:
Here: 2.8% city: 8.2%
Occupations of females:
- Percentage of females in management occupations (except farmers):
Here: 1.9% city: 6.4%
- Percentage of females in business and financial operations occupations:
Here: 2.3% city: 4.6%
- Percentage of females in community and social services occupations:
Here: 50.8% city: 2.7%
- Percentage of females in education, training, and library occupations:
Here: 10.9% city: 5.7%
- Percentage of females in arts, design, entertainment, sports, and media occupations:
Here: 3.2% city: 1.3%
- Percentage of females in healthcare practitioners and technical occupations:
Here: 2.9% city: 8.9%
- Percentage of females in service occupations:
Here: 35.3% city: 26.1%
- Percentage of females in sales and office occupations:
Here: 29.5% city: 30.9%
- Percentage of females in production occupations:
Here: 11.4% city: 5.3%
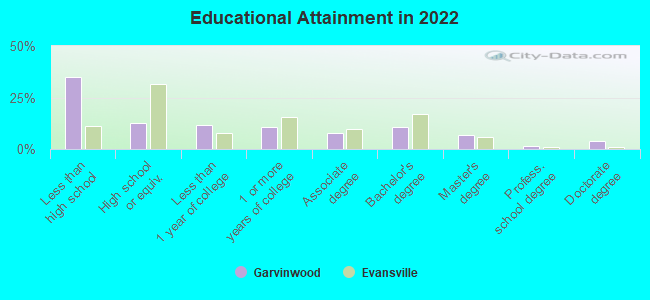
Education in this neighborhood (subdivision or community):
- Percentage of people 3 years and older in K-12 schools:
Garvinwood: 26.1% Evansville: 15.5%
- Percentage of people 3 years and older in undergraduate colleges:
Garvinwood: 58.5% Evansville: 5.1%
- Percentage of people 3 years and older in grad. or professional schools:
Garvinwood: 3.8% Evansville: 0.8%
- Percentage of students K-12 enrolled in private schools:
Garvinwood: 61.6% Evansville: 15.2%
Percentage of population below poverty level:
| Garvinwood: | 24.2% |
| Evansville: | 19.3% |
Median year owner moved in (as recorded in 2022):
Median year renter moved in (as recorded in 2022):
| Garvinwood: | 2008 |
| Evansville: | 2011 |
Median year renter moved in (as recorded in 2022):
| Garvinwood: | 2019 |
| Evansville: | 2020 |
Percentage of married-couple families with both working:
| Garvinwood: | 109.7% |
| Evansville: | 71.5% |
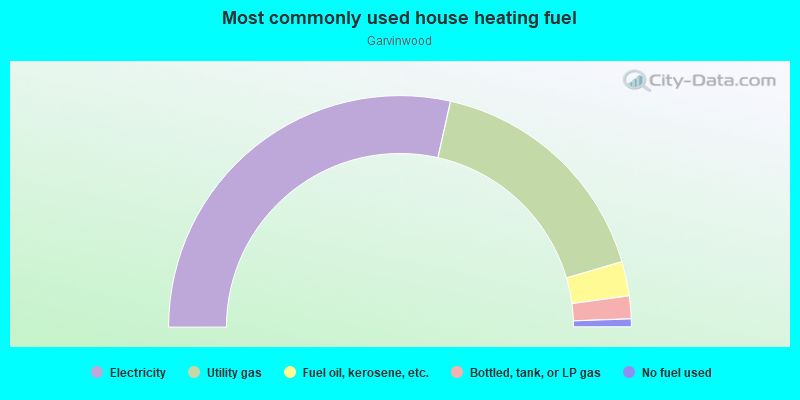
- 57.1%Electricity
- 33.9%Utility gas
- 4.8%Fuel oil, kerosene, etc.
- 3.2%Bottled, tank, or LP gas
- 1.1%No fuel used
Highways in this neighborhood:
Roads and streets:
E Indiana St
Length: 0.64 miles
Direction: E-W
Address range: 1212 to 1648
Direction: E-W
Address range: 1212 to 1648
E Illinois St
Length: 0.63 miles
Direction: E-W
Address range: 1201 to 1648
Direction: E-W
Address range: 1201 to 1648
E Division St
Length: 0.59 miles
Directions: E-W, N-S, SE-NW, SW-NE
Address range: 1300 to 1698
Directions: E-W, N-S, SE-NW, SW-NE
Address range: 1300 to 1698
E Franklin St
Length: 0.57 miles
Direction: E-W
Address range: 1301 to 1699
Direction: E-W
Address range: 1301 to 1699
E Michigan St
Length: 0.38 miles
Directions: E-W, N-S, SW-NE
Address range: 1200 to 1699
Directions: E-W, N-S, SW-NE
Address range: 1200 to 1699
N Willow Rd
Length: 0.23 miles
Direction: N-S
Address range: 17 to 399
Direction: N-S
Address range: 17 to 399
N Englewood Ave
Length: 0.23 miles
Direction: N-S
Address range: 1 to 399
Direction: N-S
Address range: 1 to 399
N Harlan Ave
Length: 0.19 miles
Direction: N-S
Direction: N-S
N Rotherwood Ave
Length: 0.12 miles
Direction: N-S
Address range: 33 to 399
Direction: N-S
Address range: 33 to 399
N Fares Ave
Length: 0.10 miles
Directions: E-W, N-S, SW-NE
Directions: E-W, N-S, SW-NE
Canal St
Length: 0.08 miles
Directions: E-W, N-S, SE-NW, SW-NE
Directions: E-W, N-S, SE-NW, SW-NE
Underhill Pl
Length: 0.06 miles
Directions: E-W, N-S, SE-NW
Address range: 500 to 513
Directions: E-W, N-S, SE-NW
Address range: 500 to 513
Underhill Ct
Length: 0.04 miles
Directions: E-W, N-S, SW-NE
Address range: 501 to 526
Directions: E-W, N-S, SW-NE
Address range: 501 to 526
Railroad features:
Southern Rlwy
Length: 0.56 miles
Directions: E-W, SW-NE
Directions: E-W, SW-NE