Glenwood neighborhood in Raleigh, North Carolina (NC), 27605 detailed profile
Settings
X


Business Search - 14 Million verified businesses
Area: 0.095 square miles
Population: 593
Population density:
| Glenwood: | 6,247 people per square mile |
| Raleigh: | 4,163 people per square mile |

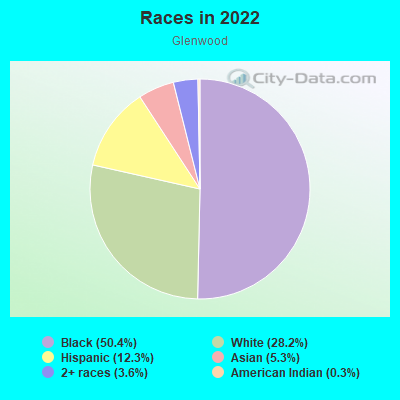
- 51984.7%White
- 426.9%Two or more races
- 254.1%Black
- 213.4%Asian
- 61.0%Hispanic or Latino
Distribution of median household income
![Distribution of median household income]()
- 9Less than $10,000
- 76$10,000 to $19,999
- 39$20,000 to $29,999
- 23$30,000 to $39,999
- 53$40,000 to $49,999
- 23$50,000 to $59,999
- 28$60,000 to $74,999
- 46$75,000 to $99,999
- 36$100,000 to $124,999
- 17$125,000 to $149,999
- 34$150,000 to $199,999
- 59$200,000 or more

Distribution of owner-occupied house/condo value
![Distribution of owner-occupied house/condo value]()
- 6Less than $50,000
- 27$200,000 to $249,999
- 48$250,000 to $299,999
- 38$300,000 to $399,999
- 42$400,000 to $499,999
- 18$500,000 to $749,999
- 23$750,000 to $999,999

Distribution of rent paid by renters
![Distribution of rent paid by renters]()
- 35$200 to $299
- 12$300 to $399
- 5$400 to $499
- 22$600 to $699
- 17$700 to $799
- 17$800 to $899
- 23$900 to $999
- 19$1,000 to $1,249
- 18$1,250 to $1,499
- 37$1,500 to $1,999
- 32$2,000 or more

Median rent in 2022:
| Glenwood: | $1,146 |
| Raleigh: | $1,309 |
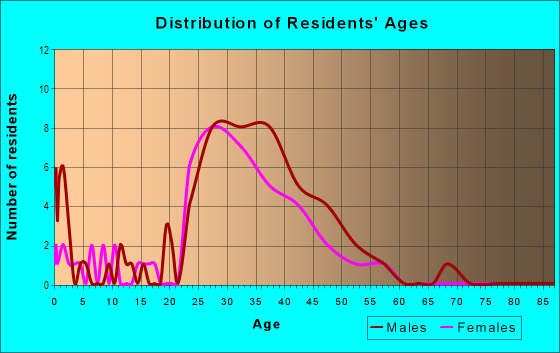
| Males: | 320 |
| Females: | 272 |
Males:
| This neighborhood: | 41.1 years |
| Whole city: | 33.9 years |
| This neighborhood: | 33.4 years |
| Whole city: | 35.8 years |
Average household size:
| Glenwood: | 1.5 people |
| Raleigh: | 2.3 people |
Percentage of family households:
| Glenwood: | 14.3% |
| Raleigh: | 41.5% |
| Here: | 18.0% |
| Raleigh: | 39.7% |
Percentage of married-couple families with children (among all households):
| Glenwood: | 48.7% |
| Raleigh: | 28.1% |
Percentage of single-mother households (among all households):
| Glenwood: | 13.7% |
| Raleigh: | 10.7% |
Percentage of never married males 15 years old and over:
Percentage of never married females 15 years old and over:
| Glenwood: | 25.3% |
| Raleigh: | 22.3% |
Percentage of never married females 15 years old and over:
| Glenwood: | 29.5% |
| city: | 21.9% |
Percentage of people that speak English not well or not at all:
| Glenwood: | 0.7% |
| Raleigh: | 2.3% |
Percentage of people born in this state:
Percentage of people born in another U.S. state:
Percentage of native residents but born outside the U.S.:
Percentage of foreign born residents:
| Here: | 37.0% |
| Raleigh: | 44.8% |
Percentage of people born in another U.S. state:
| Glenwood: | 60.1% |
| Raleigh: | 39.8% |
Percentage of native residents but born outside the U.S.:
| Here: | 0.0% |
| city: | 1.9% |
Percentage of foreign born residents:
| Here: | 2.9% |
| Raleigh: | 13.5% |
Owner-occupied
Renter-occupied

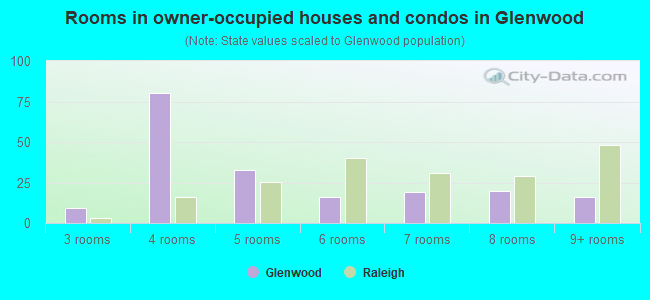
- Rooms in owner-occupied houses and condos in Glenwood
- 01 room
- 02 rooms
- 93 rooms
- 804 rooms
- 335 rooms
- 166 rooms
- 197 rooms
- 208 rooms
- 169+ rooms
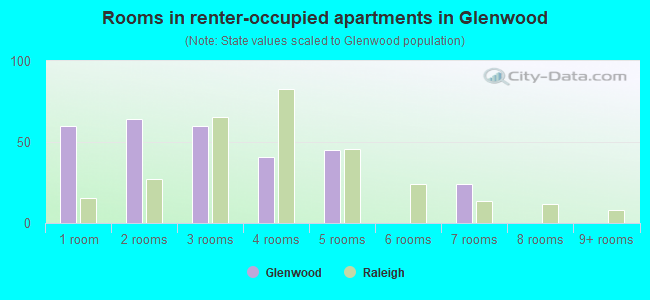
- Rooms in renter-occupied apartments in Glenwood
- 601 room
- 642 rooms
- 603 rooms
- 414 rooms
- 455 rooms
- 06 rooms
- 247 rooms
- 08 rooms
- 09+ rooms
Owner-occupied
Renter-occupied
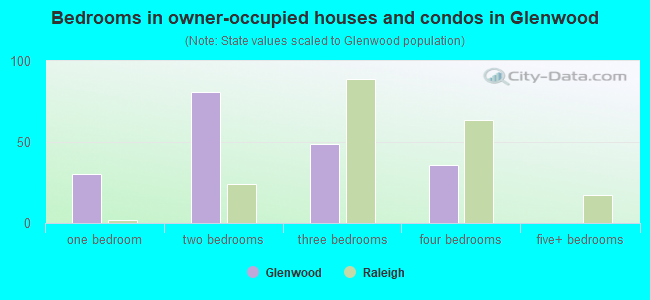
- Bedrooms in owner-occupied houses and condos in Glenwood
- 0no bedroom
- 301 bedroom
- 812 bedrooms
- 493 bedrooms
- 364 bedrooms
- 05+ bedrooms
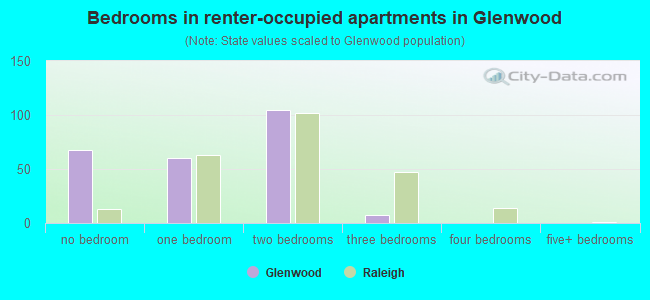
- Bedrooms in renter-occupied apartments in Glenwood
- 68no bedroom
- 601 bedroom
- 1052 bedrooms
- 73 bedrooms
- 04 bedrooms
- 05+ bedrooms
Average number of cars or other vehicles available in houses/condos:
Average number of cars or other vehicles available in apartments:
| This neighborhood: | 1.6 |
| Raleigh: | 2.0 |
Average number of cars or other vehicles available in apartments:
| Here: | 1.2 |
| city: | 1.4 |
Percentage of units with a mortgage:
| Glenwood: | 66.8% |
| Raleigh: | 74.4% |
Average estimated '22 value of housing units in 5-or-more-unit structures (9.9% of all units):
| Glenwood: | $433,967 |
| North Carolina: | $329,290 |
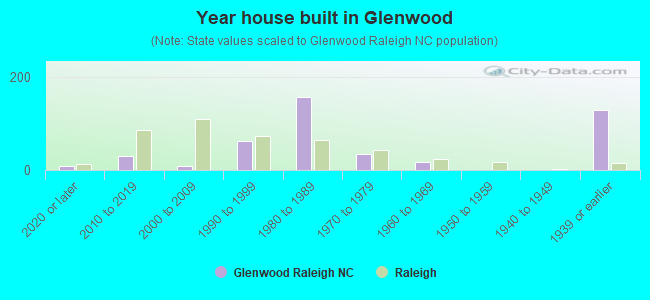
- Year house built in Glenwood
- 92020 or later
- 312010 to 2019
- 82000 to 2009
- 621990 to 1999
- 1561980 to 1989
- 341970 to 1979
- 171960 to 1969
- 11950 to 1959
- 01940 to 1949
- 1281939 or earlier
City-data.com crime index for city in 2020 (higher means more crime):
| City: | 216.7 |
| U.S. average: | 219.5 |
Travel time to work (commute)
![Travel time to work (commute)]()
- 15Less than 5 minutes
- 625 to 9 minutes
- 7210 to 14 minutes
- 3115 to 19 minutes
- 4320 to 24 minutes
- 1425 to 29 minutes
- 3630 to 34 minutes
- 635 to 39 minutes
- 1540 to 44 minutes
- 1045 to 59 minutes
- 460 to 89 minutes
- 1690 or more minutes

Means of transportation to work
![Means of transportation to work]()
- 68.7%301Drove a car alone
- 0.9%4Bus
- 0.5%2Long-distance train or commuter rail
- 2.1%9Motorcycle
- 11.0%48Walked
- 27.4%120Worked at home

Time leaving home to go to work
![Time leaving home to go to work]()
- 65:00 a.m. to 5:29 a.m.
- 366:00 a.m. to 6:29 a.m.
- 206:30 a.m. to 6:59 a.m.
- 587:00 a.m. to 7:29 a.m.
- 497:30 a.m. to 7:59 a.m.
- 318:00 a.m. to 8:29 a.m.
- 468:30 a.m. to 8:59 a.m.
- 429:00 a.m. to 9:59 a.m.
- 410:00 a.m. to 10:59 a.m.
- 1511:00 a.m. to 11:59 a.m.
- 1812:00 p.m. to 3:59 p.m.
- 104:00 p.m. to 11:59 p.m.

Occupations of males:
- Percentage of males in management occupations (except farmers):
Here: 14.7% city: 14.5%
- Percentage of males in computer and mathematical occupations:
Here: 1.4% city: 9.1%
- Percentage of males in architecture and engineering occupations:
Here: 5.6% city: 4.3%
- Percentage of males in legal occupations:
Here: 10.5% city: 1.8%
- Percentage of males in education, training, and library occupations:
Here: 3.9% city: 3.6%
- Percentage of males in healthcare practitioners and technical occupations:
Here: 12.5% city: 3.2%
- Percentage of males in service occupations:
Here: 12.1% city: 11.6%
- Percentage of males in sales and office occupations:
Here: 26.7% city: 16.9%
- Percentage of males in construction, extraction, and maintenance occupations:
Here: 11.4% city: 6.8%
Occupations of females:
- Percentage of females in management occupations (except farmers):
Here: 12.9% city: 12.5%
- Percentage of females in business and financial operations occupations:
Here: 21.6% city: 10.5%
- Percentage of females in computer and mathematical occupations:
Here: 1.5% city: 3.2%
- Percentage of females in architecture and engineering occupations:
Here: 2.0% city: 1.4%
- Percentage of females in community and social services occupations:
Here: 7.5% city: 2.5%
- Percentage of females in legal occupations:
Here: 5.7% city: 1.9%
- Percentage of females in education, training, and library occupations:
Here: 12.6% city: 8.8%
- Percentage of females in arts, design, entertainment, sports, and media occupations:
Here: 2.7% city: 2.9%
- Percentage of females in healthcare practitioners and technical occupations:
Here: 4.4% city: 8.8%
- Percentage of females in service occupations:
Here: 17.5% city: 15.9%
- Percentage of females in sales and office occupations:
Here: 12.7% city: 24.5%
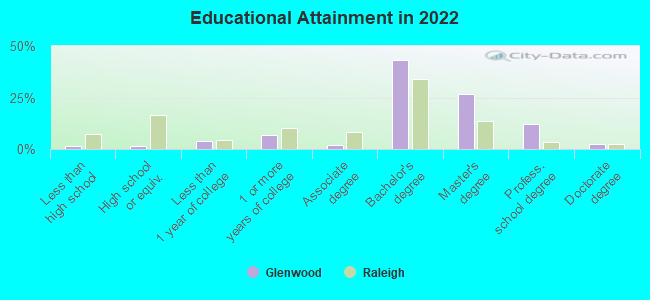
Education in this neighborhood (subdivision or community):
- Percentage of people 3 years and older in K-12 schools:
Glenwood: 9.3% Raleigh: 14.0%
- Percentage of people 3 years and older in undergraduate colleges:
Glenwood: 1.3% Raleigh: 8.1%
- Percentage of people 3 years and older in grad. or professional schools:
Glenwood: 2.0% Raleigh: 2.4%
- Percentage of students K-12 enrolled in private schools:
Glenwood: 50.9% Raleigh: 10.9%
Percentage of population below poverty level:
| Glenwood: | 10.5% |
| Raleigh: | 11.0% |
Median year owner moved in (as recorded in 2022):
Median year renter moved in (as recorded in 2022):
| Glenwood: | 2014 |
| Raleigh: | 2013 |
Median year renter moved in (as recorded in 2022):
| Glenwood: | 2018 |
| Raleigh: | 2020 |
Percentage of married-couple families with both working:
| Glenwood: | 100.0% |
| Raleigh: | 76.8% |
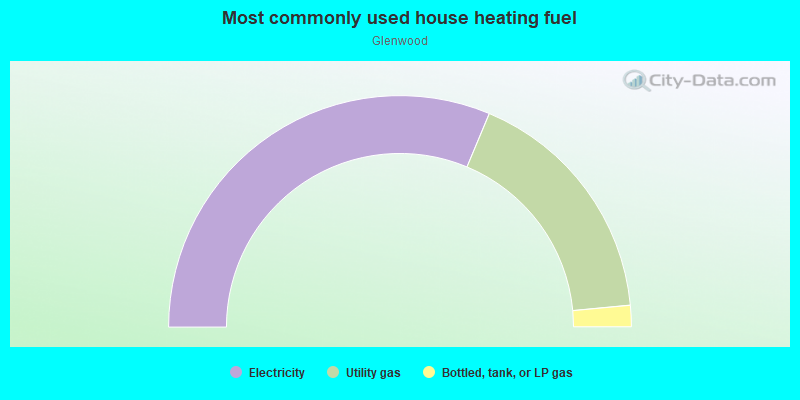
- 62.7%Electricity
- 34.4%Utility gas
- 3.0%Bottled, tank, or LP gas
Highways in this neighborhood:
US Hwy 70 (Glenwood Ave, State Hwy 50, US Hwy 401)
Length: 0.13 miles
Direction: N-S
Address range: 813 to 906
Direction: N-S
Address range: 813 to 906
Roads and streets:
Filmore St
Length: 0.16 miles
Direction: N-S
Address range: 1100 to 1299
Direction: N-S
Address range: 1100 to 1299
Cleveland St
Length: 0.14 miles
Direction: E-W
Address range: 500 to 599
Direction: E-W
Address range: 500 to 599
Tilden St
Length: 0.13 miles
Direction: E-W
Address range: 502 to 512
Direction: E-W
Address range: 502 to 512
Wills Forest St
Length: 0.11 miles
Direction: E-W
Address range: 600 to 699
Direction: E-W
Address range: 600 to 699
Gaston St
Length: 0.10 miles
Direction: N-S
Address range: 712 to 799
Direction: N-S
Address range: 712 to 799
Adams St
Length: 0.09 miles
Direction: E-W
Address range: 500 to 599
Direction: E-W
Address range: 500 to 599
N Boylan Ave
Length: 0.09 miles
Direction: N-S
Address range: 800 to 998
Direction: N-S
Address range: 800 to 998
Washington St
Length: 0.08 miles
Direction: E-W
Address range: 500 to 599
Direction: E-W
Address range: 500 to 599
Devereux St
Length: 0.08 miles
Direction: E-W
Address range: 700 to 799
Direction: E-W
Address range: 700 to 799
Jefferson St
Length: 0.06 miles
Direction: E-W
Address range: 300 to 506
Direction: E-W
Address range: 300 to 506
Spring St
Length: 0.03 miles
Direction: N-S
Direction: N-S