Glenwood (Glenwood Heights) neighborhood in Wayne, Michigan (MI), 48184 detailed profile
Settings
X


Business Search - 14 Million verified businesses
Area: 0.228 square miles
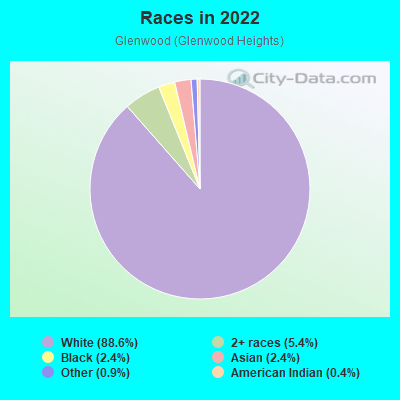
Population: 453
Population density:
| Glenwood (Glenwood Heights): | 1,983 people per square mile |
| Wayne: | 2,919 people per square mile |

- 41088.6%White
- 255.4%Two or more races
- 112.4%Black
- 112.4%Asian
- 40.9%Some other race
- 20.4%American Indian
Median household income in 2022:
| Glenwood (Glenwood Heights): | $54,935 |
| Wayne: | $52,709 |
Distribution of median household income
![Distribution of median household income]()
- 8Less than $10,000
- 12$10,000 to $19,999
- 11$20,000 to $29,999
- 36$30,000 to $39,999
- 42$40,000 to $49,999
- 26$50,000 to $59,999
- 20$60,000 to $74,999
- 22$75,000 to $99,999
- 19$100,000 to $124,999
- 18$125,000 to $149,999
- 10$150,000 to $199,999
- 9$200,000 or more

Distribution of owner-occupied house/condo value
![Distribution of owner-occupied house/condo value]()
- 14Less than $50,000
- 31$50,000 to $99,999
- 48$100,000 to $149,999
- 113$150,000 to $199,999
- 14$200,000 to $249,999
- 3$250,000 to $299,999
- 5$300,000 to $399,999
- 4$400,000 to $499,999
- 3$500,000 to $749,999
- 1$750,000 to $999,999
- 1$1,000,000 or more

Distribution of rent paid by renters
![Distribution of rent paid by renters]()
- 1$200 to $299
- 1$300 to $399
- 1$400 to $499
- 4$500 to $599
- 3$600 to $699
- 18$700 to $799
- 7$800 to $899
- 2$900 to $999
- 2$1,000 to $1,249
- 8$1,250 to $1,499
- 3$1,500 to $1,999
- 2$2,000 or more

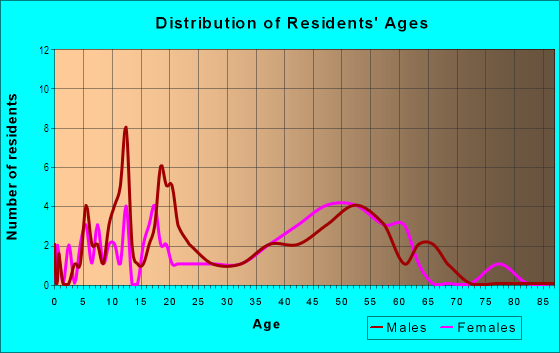
| Males: | 225 |
| Females: | 227 |
Males:
| This neighborhood: | 46.6 years |
| Whole city: | 38.8 years |
| This neighborhood: | 52.7 years |
| Whole city: | 43.0 years |
Average household size:
| Glenwood (Glenwood Heights): | 2.5 people |
| Wayne: | 2.4 people |
Percentage of family households:
| Glenwood (Glenwood Heights): | 30.0% |
| Wayne: | 43.8% |
| Here: | 48.4% |
| Wayne: | 34.2% |
Percentage of married-couple families with children (among all households):
| Glenwood (Glenwood Heights): | 26.8% |
| Wayne: | 14.7% |
Percentage of single-mother households (among all households):
| Glenwood (Glenwood Heights): | 11.4% |
| Wayne: | 22.7% |
Percentage of never married males 15 years old and over:
Percentage of never married females 15 years old and over:
| Glenwood (Glenwood Heights): | 16.0% |
| Wayne: | 19.1% |
Percentage of never married females 15 years old and over:
| Glenwood (Glenwood Heights): | 8.4% |
| city: | 19.6% |
Percentage of people that speak English not well or not at all:
| Glenwood (Glenwood Heights): | 0.0% |
| Wayne: | 1.1% |
Percentage of people born in this state:
Percentage of people born in another U.S. state:
Percentage of native residents but born outside the U.S.:
Percentage of foreign born residents:
| Here: | 80.8% |
| Wayne: | 80.5% |
Percentage of people born in another U.S. state:
| Glenwood (Glenwood Heights): | 13.6% |
| Wayne: | 13.3% |
Percentage of native residents but born outside the U.S.:
| Here: | 0.8% |
| city: | 0.5% |
Percentage of foreign born residents:
| Here: | 5.6% |
| Wayne: | 5.7% |
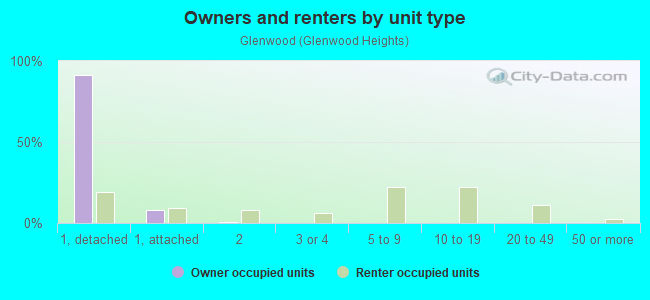
Owner-occupied
Renter-occupied

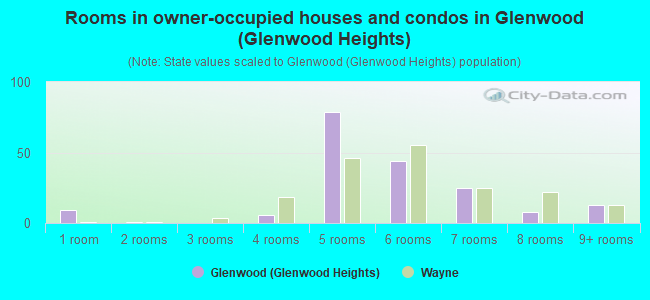
- Rooms in owner-occupied houses and condos in Glenwood <
> - 91 room
- 12 rooms
- 03 rooms
- 64 rooms
- 795 rooms
- 446 rooms
- 257 rooms
- 88 rooms
- 139+ rooms
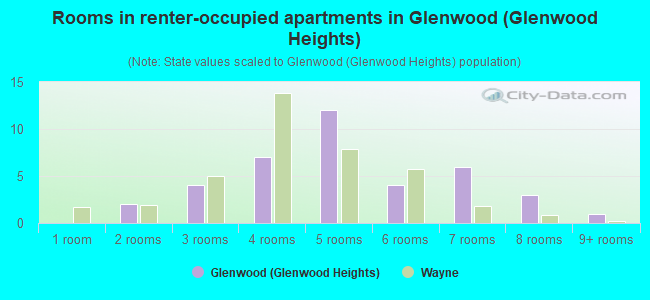
- Rooms in renter-occupied apartments in Glenwood <
> - 01 room
- 22 rooms
- 43 rooms
- 74 rooms
- 125 rooms
- 46 rooms
- 67 rooms
- 38 rooms
- 19+ rooms
Owner-occupied
Renter-occupied
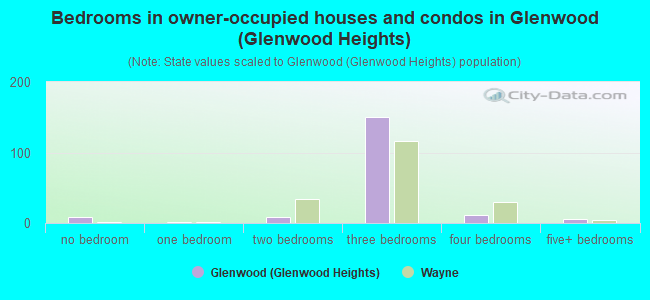
- Bedrooms in owner-occupied houses and condos in Glenwood <
> - 9no bedroom
- 21 bedroom
- 92 bedrooms
- 1503 bedrooms
- 114 bedrooms
- 65+ bedrooms
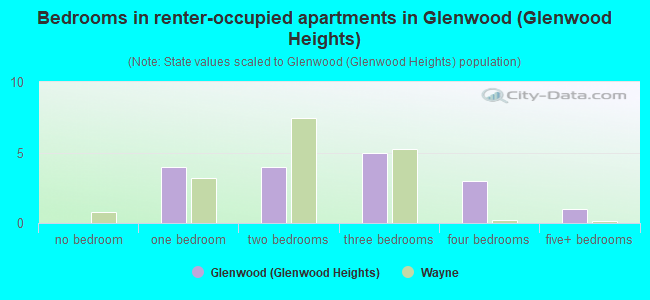
- Bedrooms in renter-occupied apartments in Glenwood <
> - 0no bedroom
- 41 bedroom
- 42 bedrooms
- 53 bedrooms
- 34 bedrooms
- 15+ bedrooms
Average number of cars or other vehicles available in houses/condos:
Average number of cars or other vehicles available in apartments:
| This neighborhood: | 1.2 |
| Wayne: | 1.9 |
Average number of cars or other vehicles available in apartments:
| Here: | 5.6 |
| city: | 1.3 |
Percentage of units with a mortgage:
| Glenwood (Glenwood Heights): | 62.1% |
| Wayne: | 63.5% |
Average estimated value of detached houses in 2022 (97.6% of all units):
| Glenwood (Glenwood Heights): | $163,832 |
| Michigan: | $280,038 |
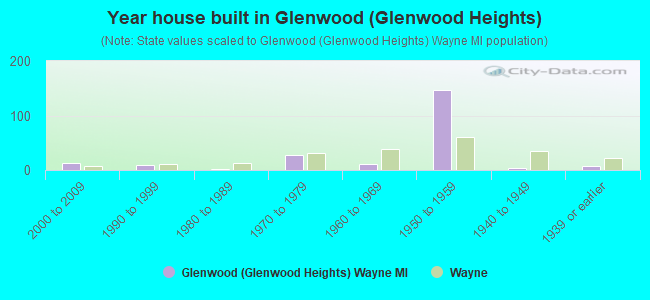
- Year house built in Glenwood <
> - 02020 or later
- 02010 to 2019
- 122000 to 2009
- 91990 to 1999
- 21980 to 1989
- 271970 to 1979
- 111960 to 1969
- 1461950 to 1959
- 41940 to 1949
- 71939 or earlier
City-data.com crime index for city in 2020 (higher means more crime):
| City: | 260.4 |
| U.S. average: | 219.5 |
Travel time to work (commute)
![Travel time to work (commute)]()
- 3Less than 5 minutes
- 95 to 9 minutes
- 810 to 14 minutes
- 1815 to 19 minutes
- 2320 to 24 minutes
- 1825 to 29 minutes
- 1430 to 34 minutes
- 535 to 39 minutes
- 640 to 44 minutes
- 645 to 59 minutes
- 260 to 89 minutes
- 290 or more minutes

Means of transportation to work
![Means of transportation to work]()
- 87.0%153Drove a car alone
- 12.5%22Carpooled
- 1.7%3Bus
- 2.3%4Bicycle
- 1.1%2Walked
- 3.4%6Other means
- 8.5%15Worked at home

Time leaving home to go to work
![Time leaving home to go to work]()
- 612:00 a.m. to 4:59 a.m.
- 45:00 a.m. to 5:29 a.m.
- 35:30 a.m. to 5:59 a.m.
- 196:00 a.m. to 6:29 a.m.
- 156:30 a.m. to 6:59 a.m.
- 117:00 a.m. to 7:29 a.m.
- 197:30 a.m. to 7:59 a.m.
- 108:00 a.m. to 8:29 a.m.
- 18:30 a.m. to 8:59 a.m.
- 29:00 a.m. to 9:59 a.m.
- 210:00 a.m. to 10:59 a.m.
- 311:00 a.m. to 11:59 a.m.
- 1512:00 p.m. to 3:59 p.m.
- 104:00 p.m. to 11:59 p.m.

Occupations of males:
- Percentage of males in management occupations (except farmers):
Here: 8.4% city: 6.8%
- Percentage of males in business and financial operations occupations:
Here: 31.3% city: 2.0%
- Percentage of males in computer and mathematical occupations:
Here: 69.2% city: 3.6%
- Percentage of males in architecture and engineering occupations:
Here: 2.5% city: 4.0%
- Percentage of males in legal occupations:
Here: 1.5% city: 0.1%
- Percentage of males in education, training, and library occupations:
Here: 10.7% city: 1.8%
- Percentage of males in healthcare practitioners and technical occupations:
Here: 13.8% city: 2.7%
- Percentage of males in service occupations:
Here: 6.1% city: 14.7%
- Percentage of males in sales and office occupations:
Here: 19.2% city: 14.2%
- Percentage of males in construction, extraction, and maintenance occupations:
Here: 8.8% city: 8.4%
- Percentage of males in production occupations:
Here: 6.8% city: 17.4%
- Percentage of males in transportation occupations:
Here: 2.1% city: 9.9%
- Percentage of males in material moving occupations:
Here: 4.8% city: 7.4%
Occupations of females:
- Percentage of females in management occupations (except farmers):
Here: 16.7% city: 3.8%
- Percentage of females in business and financial operations occupations:
Here: 4.8% city: 4.9%
- Percentage of females in computer and mathematical occupations:
Here: 1.3% city: 0.3%
- Percentage of females in life, physical, and social science occupations:
Here: 2.2% city: 0.1%
- Percentage of females in community and social services occupations:
Here: 2.2% city: 2.6%
- Percentage of females in legal occupations:
Here: 2.1% city: 0.4%
- Percentage of females in education, training, and library occupations:
Here: 1.3% city: 5.0%
- Percentage of females in arts, design, entertainment, sports, and media occupations:
Here: 1.3% city: 0.0%
- Percentage of females in healthcare practitioners and technical occupations:
Here: 6.9% city: 7.0%
- Percentage of females in service occupations:
Here: 20.5% city: 33.4%
- Percentage of females in sales and office occupations:
Here: 38.5% city: 25.2%
- Percentage of females in construction, extraction, and maintenance occupations:
Here: 3.0% city: 0.7%
- Percentage of females in production occupations:
Here: 1.2% city: 8.2%
- Percentage of females in transportation occupations:
Here: 20.5% city: 0.6%
- Percentage of females in material moving occupations:
Here: 48.4% city: 5.5%
Percentage of people 16-64 in Armed Forces:
| Glenwood (Glenwood Heights): | 0.0% |
| Wayne: | 0.0% |
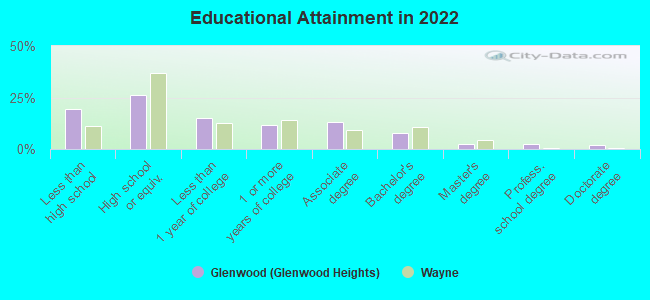
Education in this neighborhood (subdivision or community):
- Percentage of people 3 years and older in K-12 schools:
Glenwood (Glenwood Heights): 13.9% Wayne: 16.7%
- Percentage of people 3 years and older in undergraduate colleges:
Glenwood (Glenwood Heights): 6.7% Wayne: 4.1%
- Percentage of people 3 years and older in grad. or professional schools:
Glenwood (Glenwood Heights): 2.3% Wayne: 0.8%
- Percentage of students K-12 enrolled in private schools:
Glenwood (Glenwood Heights): 43.3% Wayne: 11.7%
Percentage of population below poverty level:
| Glenwood (Glenwood Heights): | 4.7% |
| Wayne: | 17.6% |
Median year owner moved in (as recorded in 2022):
| Glenwood (Glenwood Heights): | 2001 |
| Wayne: | 2005 |
Percentage of married-couple families with both working:
| Glenwood (Glenwood Heights): | 53.3% |
| Wayne: | 61.7% |
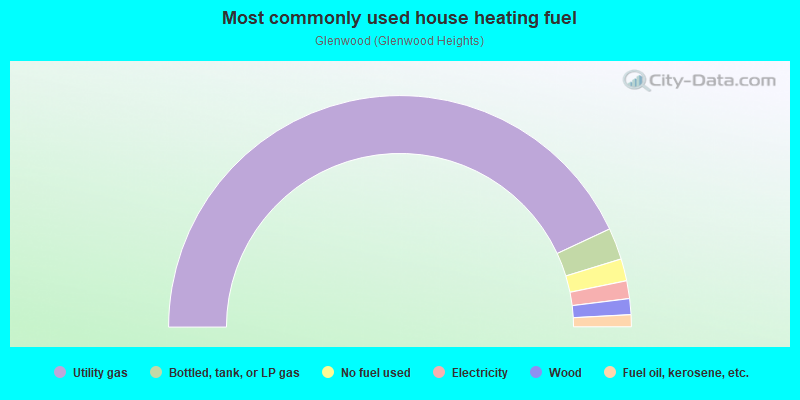
- 86.1%Utility gas
- 4.4%Bottled, tank, or LP gas
- 3.1%No fuel used
- 2.5%Electricity
- 2.2%Wood
- 1.7%Fuel oil, kerosene, etc.
Roads and streets:
S Newburgh Rd
Length: 0.58 miles
Directions: N-S, SW-NE
Address range: 2900 to 3685
Directions: N-S, SW-NE
Address range: 2900 to 3685
Glenwood Rd
Length: 0.41 miles
Direction: E-W
Address range: 37400 to 38045
Direction: E-W
Address range: 37400 to 38045
Hillcrest Dr
Length: 0.38 miles
Direction: E-W
Address range: 37500 to 37799
Direction: E-W
Address range: 37500 to 37799
Whitney Dr
Length: 0.33 miles
Directions: E-W, SE-NW
Address range: 37400 to 37699
Directions: E-W, SE-NW
Address range: 37400 to 37699
Knoll Dr
Length: 0.26 miles
Directions: E-W, N-S, SE-NW, SW-NE
Address range: 37500 to 37799
Directions: E-W, N-S, SE-NW, SW-NE
Address range: 37500 to 37799
Laurenwood St
Length: 0.24 miles
Directions: N-S, SE-NW, SW-NE
Address range: 38000 to 38299
Directions: N-S, SE-NW, SW-NE
Address range: 38000 to 38299
Briarwood Ct
Length: 0.05 miles
Direction: E-W
Address range: 38200 to 38299
Direction: E-W
Address range: 38200 to 38299
Glenmeadow Ct
Length: 0.05 miles
Direction: E-W
Address range: 38100 to 38199
Direction: E-W
Address range: 38100 to 38199
Other features:
Hunter Drn
Length: 0.32 miles
Directions: E-W, SE-NW
Directions: E-W, SE-NW