Grant neighborhood in Boulder, Colorado (CO), 80302 detailed profile
Settings
X


Business Search - 14 Million verified businesses
Area: 0.188 square miles
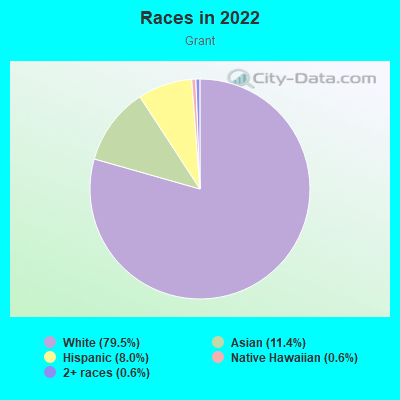
Population: 179
Population density:
| Grant: | 952 people per square mile |
| Boulder: | 4,328 people per square mile |

- 14079.5%White
- 2011.4%Asian
- 148.0%Hispanic or Latino
- 10.6%Native Hawaiian and Other
Pacific Islander - 10.6%Two or more races
Median household income in 2022:
| Grant: | $197,955 |
| Boulder: | $81,608 |
Distribution of median household income
![Distribution of median household income]()
- 1Less than $10,000
- 2$10,000 to $19,999
- 13$20,000 to $29,999
- 2$30,000 to $39,999
- 2$40,000 to $49,999
- 10$50,000 to $59,999
- 1$60,000 to $74,999
- 6$75,000 to $99,999
- 7$100,000 to $124,999
- 3$125,000 to $149,999
- 11$150,000 to $199,999
- 32$200,000 or more

Distribution of owner-occupied house/condo value
![Distribution of owner-occupied house/condo value]()
- 7$150,000 to $199,999
- 2$400,000 to $499,999
- 1$500,000 to $749,999
- 9$750,000 to $999,999
- 36$1,000,000 or more

Distribution of rent paid by renters
![Distribution of rent paid by renters]()
- 3$100 to $199
- 1$400 to $499
- 10$800 to $899
- 1$900 to $999
- 59$1,000 to $1,249
- 68$1,250 to $1,499
- 5$1,500 to $1,999
- 14$2,000 or more

Median rent in 2022:
| Grant: | $2,407 |
| Boulder: | $1,700 |
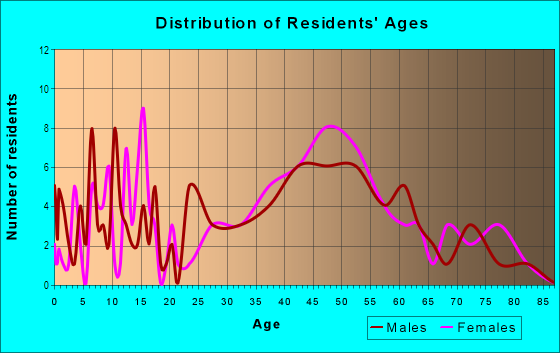
| Males: | 87 |
| Females: | 91 |
Males:
| This neighborhood: | 45.0 years |
| Whole city: | 28.3 years |
| This neighborhood: | 41.0 years |
| Whole city: | 29.2 years |
Average household size:
| Grant: | 2.8 people |
| Boulder: | 2.1 people |
Percentage of family households:
| Grant: | 48.9% |
| Boulder: | 26.9% |
| Here: | 69.4% |
| Boulder: | 30.4% |
Percentage of married-couple families with children (among all households):
| Grant: | 34.1% |
| Boulder: | 32.8% |
Percentage of single-mother households (among all households):
| Grant: | 1.8% |
| Boulder: | 6.3% |
Percentage of never married males 15 years old and over:
Percentage of never married females 15 years old and over:
| Grant: | 16.2% |
| Boulder: | 32.7% |
Percentage of never married females 15 years old and over:
| Grant: | 19.5% |
| city: | 28.3% |
Percentage of people that speak English not well or not at all:
| Grant: | 200.0% |
| Boulder: | 1.0% |
Percentage of people born in this state:
Percentage of people born in another U.S. state:
Percentage of native residents but born outside the U.S.:
Percentage of foreign born residents:
| Here: | 29.5% |
| Boulder: | 28.3% |
Percentage of people born in another U.S. state:
| Grant: | 61.1% |
| Boulder: | 60.5% |
Percentage of native residents but born outside the U.S.:
| Here: | 0.7% |
| city: | 2.1% |
Percentage of foreign born residents:
| Here: | 8.7% |
| Boulder: | 9.1% |
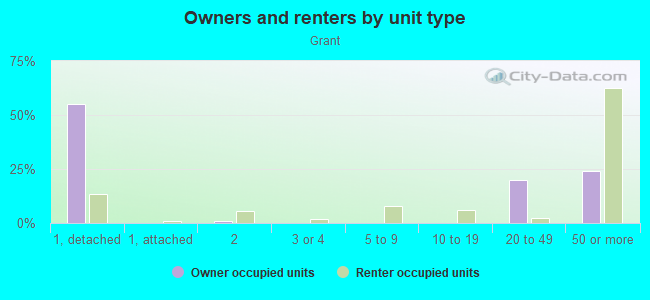
Owner-occupied
Renter-occupied

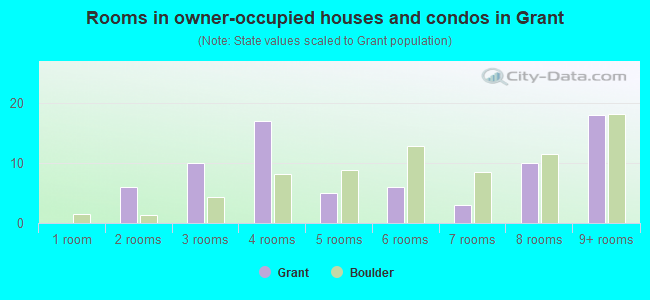
- Rooms in owner-occupied houses and condos in Grant
- 01 room
- 62 rooms
- 103 rooms
- 174 rooms
- 55 rooms
- 66 rooms
- 37 rooms
- 108 rooms
- 189+ rooms
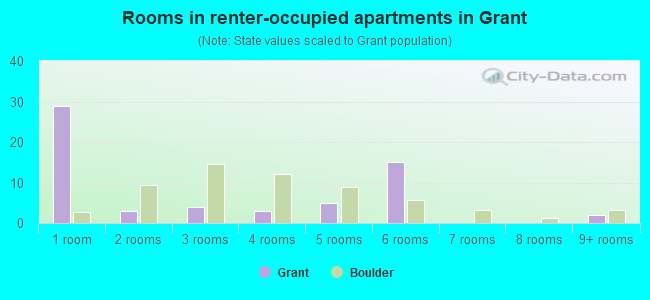
- Rooms in renter-occupied apartments in Grant
- 291 room
- 32 rooms
- 43 rooms
- 34 rooms
- 55 rooms
- 156 rooms
- 07 rooms
- 08 rooms
- 29+ rooms
Owner-occupied
Renter-occupied
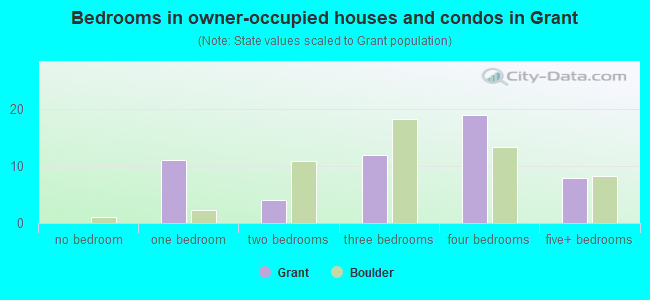
- Bedrooms in owner-occupied houses and condos in Grant
- 0no bedroom
- 111 bedroom
- 42 bedrooms
- 123 bedrooms
- 194 bedrooms
- 85+ bedrooms
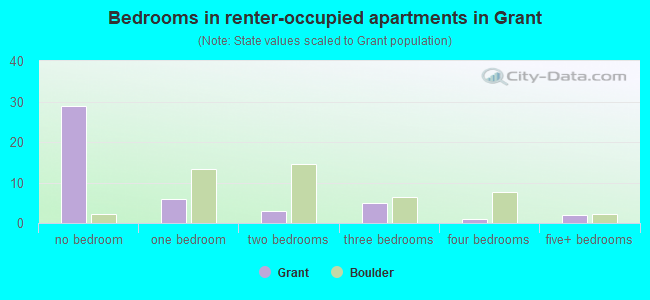
- Bedrooms in renter-occupied apartments in Grant
- 29no bedroom
- 61 bedroom
- 32 bedrooms
- 53 bedrooms
- 14 bedrooms
- 25+ bedrooms
Average number of cars or other vehicles available in houses/condos:
Average number of cars or other vehicles available in apartments:
| This neighborhood: | 2.2 |
| Boulder: | 1.8 |
Average number of cars or other vehicles available in apartments:
| Here: | 1.7 |
| city: | 1.6 |
Percentage of units with a mortgage:
| Grant: | 62.5% |
| Boulder: | 60.5% |
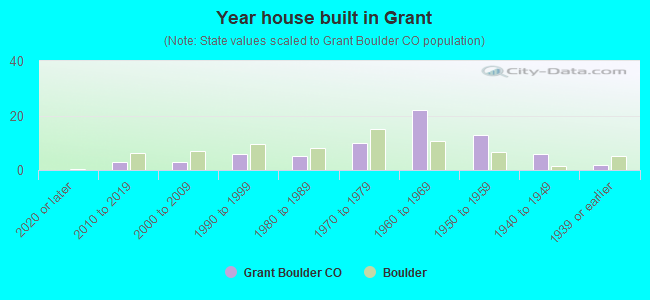
- Year house built in Grant
- 02020 or later
- 32010 to 2019
- 32000 to 2009
- 61990 to 1999
- 51980 to 1989
- 101970 to 1979
- 221960 to 1969
- 131950 to 1959
- 61940 to 1949
- 21939 or earlier
City-data.com crime index for city in 2020 (higher means more crime):
| City: | 275.1 |
| U.S. average: | 219.5 |
Travel time to work (commute)
![Travel time to work (commute)]()
- 8Less than 5 minutes
- 495 to 9 minutes
- 9010 to 14 minutes
- 6615 to 19 minutes
- 5520 to 24 minutes
- 1125 to 29 minutes
- 530 to 34 minutes
- 335 to 39 minutes
- 240 to 44 minutes
- 245 to 59 minutes
- 1060 to 89 minutes

Means of transportation to work
![Means of transportation to work]()
- 39.9%41Drove a car alone
- 7.8%8Carpooled
- 5.8%6Bus
- 3.9%4Bicycle
- 1.9%2Walked
- 1.0%1Other means
- 38.9%40Worked at home

Time leaving home to go to work
![Time leaving home to go to work]()
- 512:00 a.m. to 4:59 a.m.
- 45:00 a.m. to 5:29 a.m.
- 35:30 a.m. to 5:59 a.m.
- 116:30 a.m. to 6:59 a.m.
- 267:00 a.m. to 7:29 a.m.
- 207:30 a.m. to 7:59 a.m.
- 248:00 a.m. to 8:29 a.m.
- 288:30 a.m. to 8:59 a.m.
- 589:00 a.m. to 9:59 a.m.
- 1510:00 a.m. to 10:59 a.m.
- 1711:00 a.m. to 11:59 a.m.
- 6812:00 p.m. to 3:59 p.m.
- 404:00 p.m. to 11:59 p.m.

Occupations of males:
- Percentage of males in management occupations (except farmers):
Here: 13.6% city: 12.9%
- Percentage of males in business and financial operations occupations:
Here: 13.8% city: 7.6%
- Percentage of males in computer and mathematical occupations:
Here: 16.6% city: 10.0%
- Percentage of males in architecture and engineering occupations:
Here: 12.1% city: 6.1%
- Percentage of males in life, physical, and social science occupations:
Here: 6.3% city: 6.1%
- Percentage of males in legal occupations:
Here: 1.0% city: 2.1%
- Percentage of males in education, training, and library occupations:
Here: 8.2% city: 8.1%
- Percentage of males in arts, design, entertainment, sports, and media occupations:
Here: 1699.2% city: 3.3%
- Percentage of males in healthcare practitioners and technical occupations:
Here: 1.5% city: 1.9%
- Percentage of males in service occupations:
Here: 2.6% city: 14.4%
- Percentage of males in sales and office occupations:
Here: 10.6% city: 14.5%
- Percentage of males in construction, extraction, and maintenance occupations:
Here: 1.5% city: 2.8%
- Percentage of males in transportation occupations:
Here: 4.3% city: 2.5%
- Percentage of males in material moving occupations:
Here: 6.7% city: 2.4%
Occupations of females:
- Percentage of females in management occupations (except farmers):
Here: 10.7% city: 8.8%
- Percentage of females in business and financial operations occupations:
Here: 8.2% city: 6.4%
- Percentage of females in computer and mathematical occupations:
Here: 11.3% city: 4.6%
- Percentage of females in architecture and engineering occupations:
Here: 1.1% city: 1.9%
- Percentage of females in life, physical, and social science occupations:
Here: 4.4% city: 4.7%
- Percentage of females in community and social services occupations:
Here: 3.1% city: 2.1%
- Percentage of females in legal occupations:
Here: 516.9% city: 1.4%
- Percentage of females in education, training, and library occupations:
Here: 14.2% city: 13.1%
- Percentage of females in arts, design, entertainment, sports, and media occupations:
Here: 2.9% city: 5.5%
- Percentage of females in healthcare practitioners and technical occupations:
Here: 6.0% city: 7.2%
- Percentage of females in service occupations:
Here: 30.9% city: 20.9%
- Percentage of females in sales and office occupations:
Here: 7.3% city: 19.4%
- Percentage of females in material moving occupations:
Here: 281.9% city: 1.9%
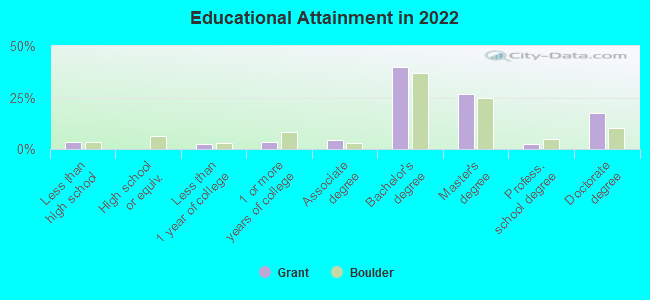
Education in this neighborhood (subdivision or community):
- Percentage of people 3 years and older in K-12 schools:
Grant: 19.7% Boulder: 8.8%
- Percentage of people 3 years and older in undergraduate colleges:
Grant: 7.9% Boulder: 28.2%
- Percentage of people 3 years and older in grad. or professional schools:
Grant: 1.7% Boulder: 6.1%
- Percentage of students K-12 enrolled in private schools:
Grant: 2.9% Boulder: 8.5%
Percentage of population below poverty level:
| Grant: | 47.4% |
| Boulder: | 24.1% |
Median year owner moved in (as recorded in 2022):
| Grant: | 2009 |
| Boulder: | 2012 |
Percentage of married-couple families with both working:
| Grant: | 87.5% |
| Boulder: | 76.2% |
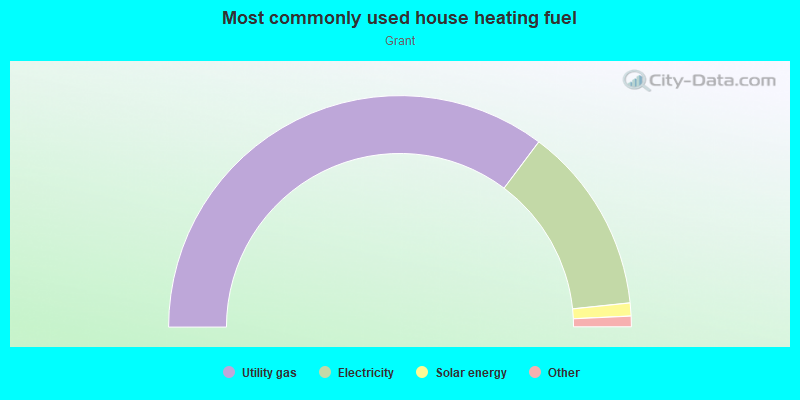
- 70.5%Utility gas
- 26.2%Electricity
- 1.8%Solar energy
- 0.8%Bottled, tank, or LP gas
- 0.8%Wood
Roads and streets:
6th St
Length: 0.43 miles
Direction: N-S
Address range: 708 to 1020
Direction: N-S
Address range: 708 to 1020
Co Hwy 56 (Baseline Rd)
Length: 0.37 miles
Direction: E-W
Address range: 651 to 799
Direction: E-W
Address range: 651 to 799
8th St
Length: 0.37 miles
Direction: N-S
Address range: 700 to 999
Direction: N-S
Address range: 700 to 999
Aurora Ave
Length: 0.37 miles
Direction: E-W
Address range: 500 to 799
Direction: E-W
Address range: 500 to 799
7th St
Length: 0.35 miles
Direction: N-S
Address range: 700 to 999
Direction: N-S
Address range: 700 to 999
Cascade Ave
Length: 0.25 miles
Directions: E-W, SW-NE
Address range: 500 to 799
Directions: E-W, SW-NE
Address range: 500 to 799
Circle Dr
Length: 0.24 miles
Directions: E-W, N-S, SE-NW, SW-NE
Address range: 768 to 899
Directions: E-W, N-S, SE-NW, SW-NE
Address range: 768 to 899
Willowbrook Rd
Length: 0.23 miles
Directions: E-W, N-S, SE-NW, SW-NE
Address range: 700 to 899
Directions: E-W, N-S, SE-NW, SW-NE
Address range: 700 to 899
Gilbert St
Length: 0.22 miles
Direction: N-S
Address range: 900 to 1099
Direction: N-S
Address range: 900 to 1099
5th St
Length: 0.19 miles
Directions: N-S, SE-NW, SW-NE
Address range: 841 to 1098
Directions: N-S, SE-NW, SW-NE
Address range: 841 to 1098
Euclid Ave
Length: 0.15 miles
Direction: E-W
Address range: 500 to 640
Direction: E-W
Address range: 500 to 640
Christmas Tree Dr
Length: 0.14 miles
Directions: E-W, SE-NW
Address range: 400 to 499
Directions: E-W, SE-NW
Address range: 400 to 499
Park Ln
Length: 0.11 miles
Direction: N-S
Address range: 801 to 899
Direction: N-S
Address range: 801 to 899
Gregory Ln
Length: 0.10 miles
Directions: SE-NW, SW-NE
Address range: 244 to 599
Directions: SE-NW, SW-NE
Address range: 244 to 599
Geneva Ave
Length: 0.09 miles
Direction: E-W
Address range: 500 to 599
Direction: E-W
Address range: 500 to 599
5th Ave (5th St W)
Length: 0.08 miles
Directions: E-W, SE-NW
Address range: 1000 to 1099
Directions: E-W, SE-NW
Address range: 1000 to 1099
Cleveland Ave (Cleveland Pl)
Length: 0.08 miles
Direction: E-W
Address range: 400 to 599
Direction: E-W
Address range: 400 to 599
Other features:
Gregory Crk
Length: 0.45 miles
Directions: N-S, SW-NE
Directions: N-S, SW-NE