Grennada neighborhood in Livonia, Michigan (MI), 48154 detailed profile
Settings
X


Business Search - 14 Million verified businesses
Area: 0.078 square miles
Population: 665
Population density:
| Grennada: | 8,580 people per square mile |
| Livonia: | 2,626 people per square mile |

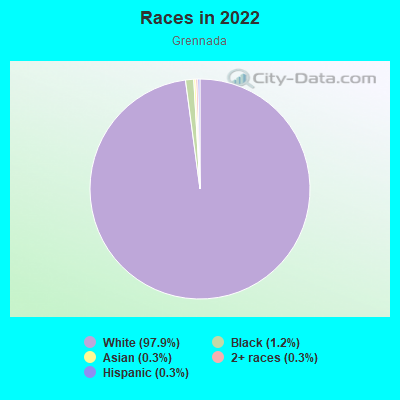
- 65297.9%White
- 81.2%Black
- 20.3%Asian
- 20.3%Two or more races
- 20.3%Hispanic or Latino

Median household income in 2022:
| Grennada: | $128,671 |
| Livonia: | $92,125 |
Distribution of median household income
![Distribution of median household income]()
- 3Less than $10,000
- 9$10,000 to $19,999
- 8$20,000 to $29,999
- 7$30,000 to $39,999
- 7$40,000 to $49,999
- 17$50,000 to $59,999
- 23$60,000 to $74,999
- 43$75,000 to $99,999
- 34$100,000 to $124,999
- 54$125,000 to $149,999
- 84$150,000 to $199,999
- 21$200,000 or more

Distribution of owner-occupied house/condo value
![Distribution of owner-occupied house/condo value]()
- 1Less than $50,000
- 2$50,000 to $99,999
- 4$100,000 to $149,999
- 9$150,000 to $199,999
- 45$200,000 to $249,999
- 197$250,000 to $299,999
- 34$300,000 to $399,999
- 6$400,000 to $499,999
- 1$500,000 to $749,999
- 3$1,000,000 or more

Distribution of rent paid by renters
![Distribution of rent paid by renters]()
- 1$100 to $199
- 9$700 to $799
- 6$800 to $899
- 8$900 to $999
- 1$1,000 to $1,249
- 1$1,250 to $1,499
- 1$1,500 to $1,999
- 4$2,000 or more

| Males: | 361 |
| Females: | 304 |
Males:
| This neighborhood: | 45.6 years |
| Whole city: | 42.2 years |
| This neighborhood: | 40.3 years |
| Whole city: | 46.5 years |
Average household size:
| Grennada: | 2.2 people |
| Livonia: | 2.4 people |
Percentage of family households:
| Grennada: | 48.5% |
| Livonia: | 44.1% |
| Here: | 57.3% |
| Livonia: | 50.1% |
Percentage of married-couple families with children (among all households):
| Grennada: | 35.1% |
| Livonia: | 33.5% |
Percentage of single-mother households (among all households):
| Grennada: | 3.4% |
| Livonia: | 6.6% |
Percentage of never married males 15 years old and over:
Percentage of never married females 15 years old and over:
| Grennada: | 14.9% |
| Livonia: | 16.7% |
Percentage of never married females 15 years old and over:
| Grennada: | 11.7% |
| city: | 12.0% |
Percentage of people that speak English not well or not at all:
| Grennada: | 0.0% |
| Livonia: | 1.4% |
Percentage of people born in this state:
Percentage of people born in another U.S. state:
Percentage of native residents but born outside the U.S.:
Percentage of foreign born residents:
| Here: | 88.2% |
| Livonia: | 78.1% |
Percentage of people born in another U.S. state:
| Grennada: | 10.4% |
| Livonia: | 13.0% |
Percentage of native residents but born outside the U.S.:
| Here: | 0.2% |
| city: | 0.4% |
Percentage of foreign born residents:
| Here: | 1.3% |
| Livonia: | 8.4% |

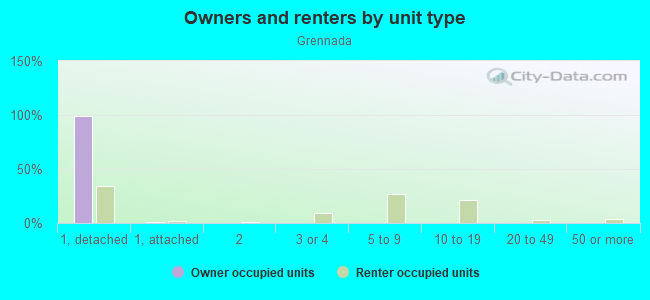
Owner-occupied
Renter-occupied

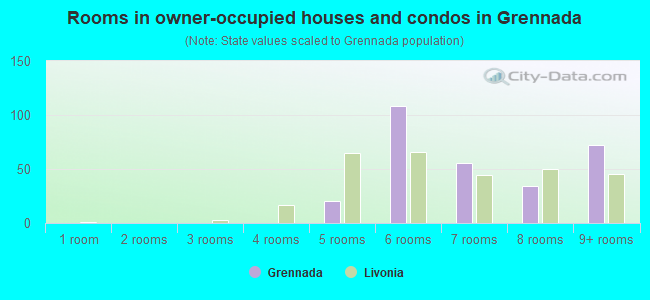
- Rooms in owner-occupied houses and condos in Grennada
- 01 room
- 02 rooms
- 03 rooms
- 04 rooms
- 205 rooms
- 1086 rooms
- 567 rooms
- 348 rooms
- 729+ rooms
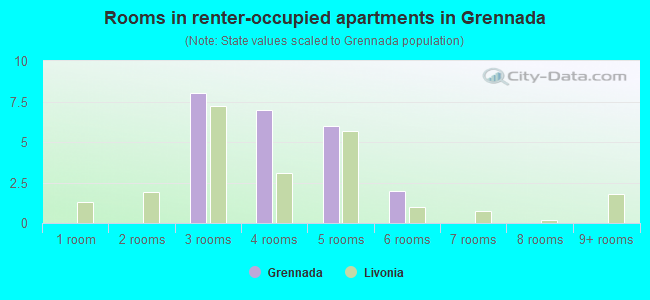
- Rooms in renter-occupied apartments in Grennada
- 01 room
- 02 rooms
- 83 rooms
- 74 rooms
- 65 rooms
- 26 rooms
- 07 rooms
- 08 rooms
- 09+ rooms
Owner-occupied
Renter-occupied
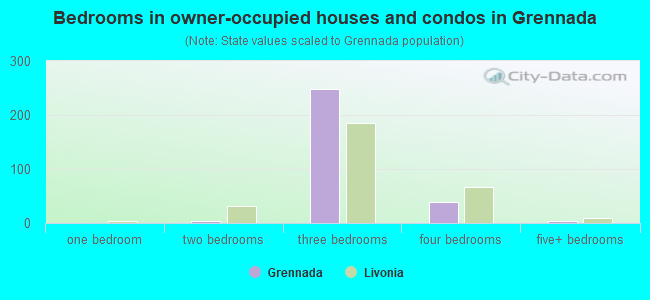
- Bedrooms in owner-occupied houses and condos in Grennada
- 0no bedroom
- 01 bedroom
- 42 bedrooms
- 2493 bedrooms
- 384 bedrooms
- 45+ bedrooms
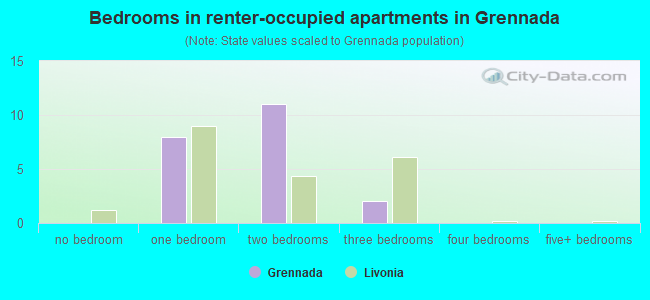
- Bedrooms in renter-occupied apartments in Grennada
- 0no bedroom
- 81 bedroom
- 112 bedrooms
- 23 bedrooms
- 04 bedrooms
- 05+ bedrooms
Average number of cars or other vehicles available in houses/condos:
Average number of cars or other vehicles available in apartments:
| This neighborhood: | 0.2 |
| Livonia: | 2.0 |
Average number of cars or other vehicles available in apartments:
| Here: | 2.1 |
| city: | 1.3 |
Percentage of units with a mortgage:
| Grennada: | 61.5% |
| Livonia: | 60.8% |
Average estimated value of detached houses in 2022 (100.0% of all units):
| Grennada: | $279,517 |
| Livonia: | $291,361 |
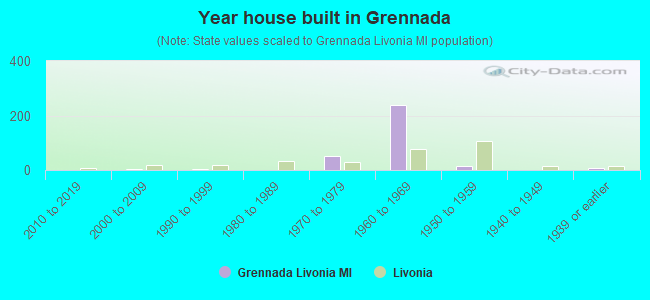
- Year house built in Grennada
- 02020 or later
- 12010 to 2019
- 22000 to 2009
- 21990 to 1999
- 01980 to 1989
- 521970 to 1979
- 2391960 to 1969
- 151950 to 1959
- 11940 to 1949
- 91939 or earlier
City-data.com crime index for city in 2020 (higher means more crime):
| City: | 122.1 |
| U.S. average: | 219.5 |
Travel time to work (commute)
![Travel time to work (commute)]()
- 1Less than 5 minutes
- 135 to 9 minutes
- 3310 to 14 minutes
- 1615 to 19 minutes
- 1920 to 24 minutes
- 1525 to 29 minutes
- 2130 to 34 minutes
- 135 to 39 minutes
- 1140 to 44 minutes
- 1745 to 59 minutes
- 460 to 89 minutes
- 190 or more minutes

Means of transportation to work
![Means of transportation to work]()
- 85.3%323Drove a car alone
- 8.5%32Carpooled
- 0.3%1Motorcycle
- 0.8%3Walked
- 1.6%6Other means
- 4.2%16Worked at home

Time leaving home to go to work
![Time leaving home to go to work]()
- 312:00 a.m. to 4:59 a.m.
- 15:00 a.m. to 5:29 a.m.
- 165:30 a.m. to 5:59 a.m.
- 226:00 a.m. to 6:29 a.m.
- 156:30 a.m. to 6:59 a.m.
- 127:00 a.m. to 7:29 a.m.
- 207:30 a.m. to 7:59 a.m.
- 268:00 a.m. to 8:29 a.m.
- 118:30 a.m. to 8:59 a.m.
- 29:00 a.m. to 9:59 a.m.
- 111:00 a.m. to 11:59 a.m.
- 512:00 p.m. to 3:59 p.m.
- 104:00 p.m. to 11:59 p.m.

Occupations of males:
- Percentage of males in management occupations (except farmers):
Here: 5.6% city: 12.8%
- Percentage of males in business and financial operations occupations:
Here: 21.1% city: 6.2%
- Percentage of males in architecture and engineering occupations:
Here: 6.3% city: 8.4%
- Percentage of males in life, physical, and social science occupations:
Here: 1.6% city: 0.4%
- Percentage of males in education, training, and library occupations:
Here: 1.1% city: 3.2%
- Percentage of males in healthcare practitioners and technical occupations:
Here: 2.2% city: 2.3%
- Percentage of males in service occupations:
Here: 11.6% city: 11.5%
- Percentage of males in sales and office occupations:
Here: 26.9% city: 15.7%
- Percentage of males in farming, fishing, and forestry occupations:
Here: 1.4% city: 0.1%
- Percentage of males in construction, extraction, and maintenance occupations:
Here: 3.8% city: 7.2%
- Percentage of males in production occupations:
Here: 8.9% city: 8.0%
- Percentage of males in transportation occupations:
Here: 4.4% city: 4.8%
- Percentage of males in material moving occupations:
Here: 2.6% city: 3.4%
Occupations of females:
- Percentage of females in management occupations (except farmers):
Here: 6.0% city: 11.2%
- Percentage of females in business and financial operations occupations:
Here: 2.6% city: 7.4%
- Percentage of females in architecture and engineering occupations:
Here: 2.1% city: 2.2%
- Percentage of females in life, physical, and social science occupations:
Here: 2.0% city: 0.9%
- Percentage of females in community and social services occupations:
Here: 7.2% city: 2.5%
- Percentage of females in legal occupations:
Here: 1.5% city: 1.6%
- Percentage of females in education, training, and library occupations:
Here: 6.0% city: 9.0%
- Percentage of females in healthcare practitioners and technical occupations:
Here: 25.5% city: 12.3%
- Percentage of females in service occupations:
Here: 9.7% city: 14.3%
- Percentage of females in sales and office occupations:
Here: 37.5% city: 29.2%
Education in this neighborhood (subdivision or community):
- Percentage of people 3 years and older in K-12 schools:
Grennada: 5.9% Livonia: 13.6%
- Percentage of people 3 years and older in undergraduate colleges:
Grennada: 3.5% Livonia: 4.0%
- Percentage of people 3 years and older in grad. or professional schools:
Grennada: 2.0% Livonia: 1.7%
- Percentage of students K-12 enrolled in private schools:
Grennada: 7.7% Livonia: 13.5%
Percentage of population below poverty level:
| Grennada: | 2.0% |
| Livonia: | 4.6% |
Median year owner moved in (as recorded in 2022):
| Grennada: | 2006 |
| Livonia: | 2008 |
Percentage of married-couple families with both working:
| Grennada: | 147.3% |
| Livonia: | 74.3% |
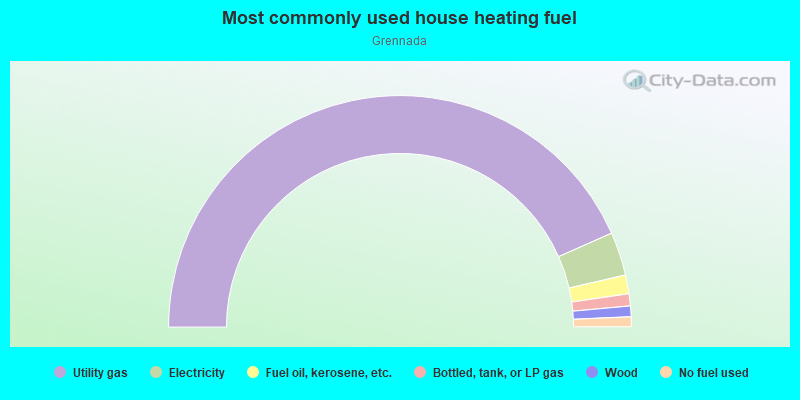
- 86.8%Utility gas
- 6.1%Electricity
- 2.6%Fuel oil, kerosene, etc.
- 1.7%Bottled, tank, or LP gas
- 1.5%Wood
- 1.4%No fuel used
Roads and streets:
Grennada St
Length: 0.50 miles
Directions: E-W, SW-NE
Address range: 38400 to 39299
Directions: E-W, SW-NE
Address range: 38400 to 39299
Mason (Mason St)
Length: 0.32 miles
Directions: E-W, SW-NE
Address range: 38400 to 38899
Directions: E-W, SW-NE
Address range: 38400 to 38899
Grennada Ct
Length: 0.12 miles
Directions: E-W, N-S, SE-NW
Address range: 39124 to 39299
Directions: E-W, N-S, SE-NW
Address range: 39124 to 39299
Knolson St
Length: 0.12 miles
Directions: N-S, SE-NW
Address range: 14120 to 14260
Directions: N-S, SE-NW
Address range: 14120 to 14260
Hix Rd (Hix St)
Length: 0.05 miles
Directions: N-S, SE-NW
Address range: 14234 to 14299
Directions: N-S, SE-NW
Address range: 14234 to 14299
Mason Ct
Length: 0.05 miles
Directions: E-W, N-S, SE-NW, SW-NE
Address range: 38600 to 38673
Directions: E-W, N-S, SE-NW, SW-NE
Address range: 38600 to 38673
Marie St
Length: 0.03 miles
Directions: N-S, SE-NW
Address range: 14160 to 14199
Directions: N-S, SE-NW
Address range: 14160 to 14199