Haight-Ashbury neighborhood in San Francisco, California (CA), 94117 detailed profile
Settings
X

Business Search - 14 Million verified businesses
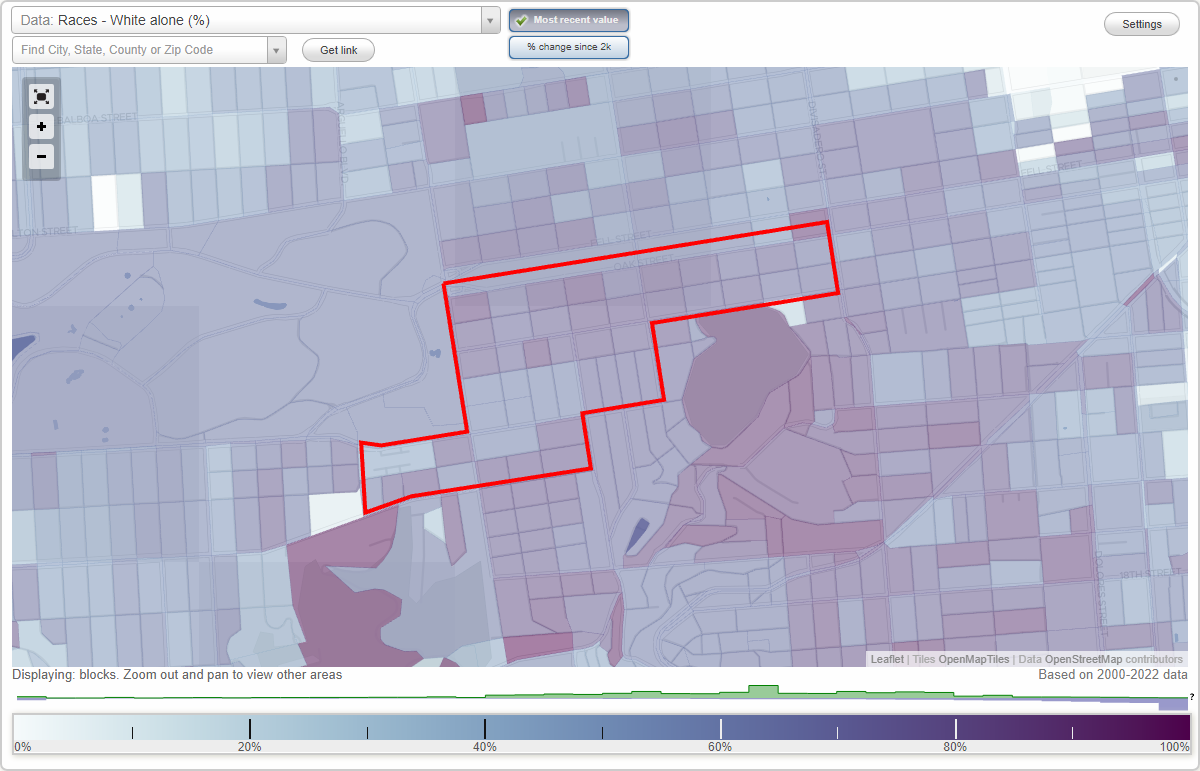
Area: 0.309 square miles
Population: 11,651
Population density:
| Haight-Ashbury: | 37,646 people per square mile |
| San Francisco: | 17,313 people per square mile |

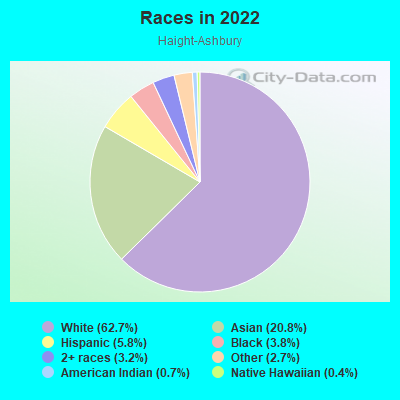
- 7,63462.7%White
- 2,53020.8%Asian
- 7065.8%Hispanic or Latino
- 4593.8%Black
- 3873.2%Two or more races
- 3272.7%Some other race
- 820.7%American Indian
- 450.4%Native Hawaiian and Other
Pacific Islander
Median household income in 2022:
| Haight-Ashbury: | $191,789 |
| San Francisco: | $136,692 |
Distribution of median household income
![Distribution of median household income]()
- 110Less than $10,000
- 73$10,000 to $19,999
- 191$20,000 to $29,999
- 285$30,000 to $39,999
- 362$40,000 to $49,999
- 279$50,000 to $59,999
- 427$60,000 to $74,999
- 436$75,000 to $99,999
- 403$100,000 to $124,999
- 565$125,000 to $149,999
- 1,334$150,000 to $199,999
- 1,879$200,000 or more

Distribution of owner-occupied house/condo value
![Distribution of owner-occupied house/condo value]()
- 22$100,000 to $149,999
- 230$200,000 to $249,999
- 55$400,000 to $499,999
- 125$500,000 to $749,999
- 520$750,000 to $999,999
- 658$1,000,000 or more

Distribution of rent paid by renters
![Distribution of rent paid by renters]()
- 31$500 to $599
- 312$600 to $699
- 55$700 to $799
- 178$800 to $899
- 92$900 to $999
- 131$1,000 to $1,249
- 249$1,250 to $1,499
- 718$1,500 to $1,999
- 3,427$2,000 or more

Median rent in 2022:
| Haight-Ashbury: | $2,508 |
| San Francisco: | $2,001 |
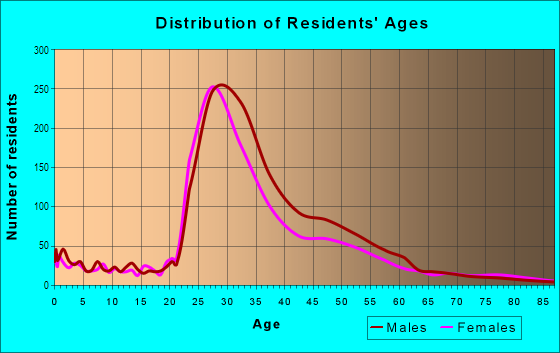
| Males: | 5,658 |
| Females: | 5,993 |
Males:
| This neighborhood: | 40.0 years |
| Whole city: | 40.3 years |
| This neighborhood: | 33.2 years |
| Whole city: | 40.5 years |
Average household size:
| Haight-Ashbury: | 9.9 people |
| San Francisco: | 2.2 people |
Percentage of family households:
| Haight-Ashbury: | 19.3% |
| San Francisco: | 30.3% |
| Here: | 25.1% |
| San Francisco: | 35.3% |
Percentage of married-couple families with children (among all households):
| Haight-Ashbury: | 35.7% |
| San Francisco: | 35.9% |
Percentage of single-mother households (among all households):
| Haight-Ashbury: | 31.1% |
| San Francisco: | 6.0% |
Percentage of never married males 15 years old and over:
Percentage of never married females 15 years old and over:
| Haight-Ashbury: | 29.5% |
| San Francisco: | 24.6% |
Percentage of never married females 15 years old and over:
| Haight-Ashbury: | 35.7% |
| city: | 19.9% |
Percentage of people that speak English not well or not at all:
| Haight-Ashbury: | 1.9% |
| San Francisco: | 10.9% |
Percentage of people born in this state:
Percentage of people born in another U.S. state:
Percentage of native residents but born outside the U.S.:
Percentage of foreign born residents:
| Here: | 41.4% |
| San Francisco: | 40.8% |
Percentage of people born in another U.S. state:
| Haight-Ashbury: | 40.2% |
| San Francisco: | 23.4% |
Percentage of native residents but born outside the U.S.:
| Here: | 2.7% |
| city: | 2.6% |
Percentage of foreign born residents:
| Here: | 15.8% |
| San Francisco: | 33.2% |
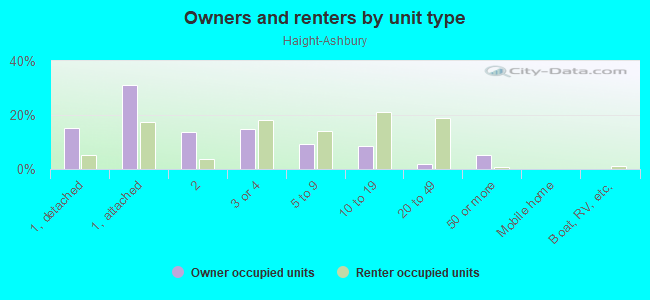
Owner-occupied
Renter-occupied

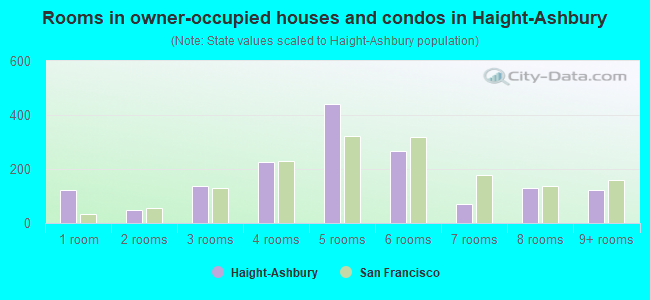
- Rooms in owner-occupied houses and condos in Haight-Ashbury
- 1221 room
- 492 rooms
- 1373 rooms
- 2264 rooms
- 4425 rooms
- 2656 rooms
- 717 rooms
- 1298 rooms
- 1239+ rooms
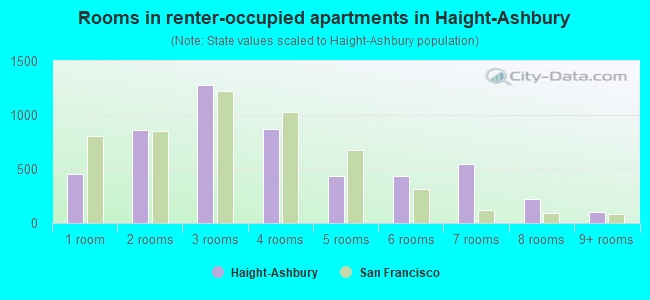
- Rooms in renter-occupied apartments in Haight-Ashbury
- 4561 room
- 8572 rooms
- 1,2773 rooms
- 8674 rooms
- 4385 rooms
- 4346 rooms
- 5497 rooms
- 2198 rooms
- 989+ rooms
Owner-occupied
Renter-occupied
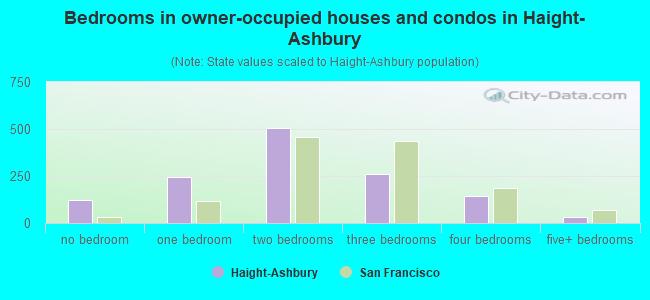
- Bedrooms in owner-occupied houses and condos in Haight-Ashbury
- 122no bedroom
- 2471 bedroom
- 5052 bedrooms
- 2593 bedrooms
- 1414 bedrooms
- 305+ bedrooms
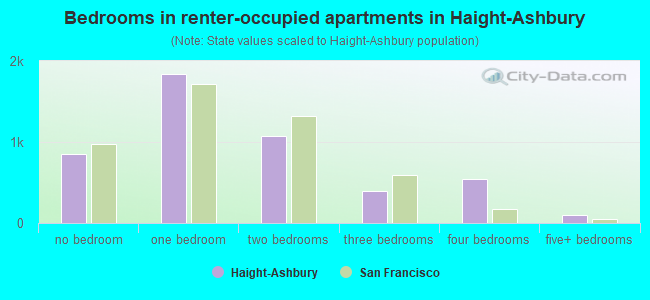
- Bedrooms in renter-occupied apartments in Haight-Ashbury
- 849no bedroom
- 1,8431 bedroom
- 1,0762 bedrooms
- 3983 bedrooms
- 5444 bedrooms
- 1015+ bedrooms
Average number of cars or other vehicles available in houses/condos:
Average number of cars or other vehicles available in apartments:
| This neighborhood: | 1.2 |
| San Francisco: | 1.5 |
Average number of cars or other vehicles available in apartments:
| Here: | 0.8 |
| city: | 0.8 |
Percentage of units with a mortgage:
| Haight-Ashbury: | 38.5% |
| San Francisco: | 62.3% |
Housing prices:
- Average estimated value of detached houses in 2022 (5.5% of all units):
Haight-Ashbury: $2,063,340 San Francisco: $1,942,973
- Average estimated value of townhouses or other attached units in 2022 (19.5% of all units):
This neighborhood: $1,414,225 city: $1,528,422
- Average estimated value of housing units in 2-unit structures in 2022 (8.5% of all units):
This neighborhood: $2,654,720 San Francisco: $1,536,932
- Average estimated '22 value of housing units in 3-to-4-unit structures (20.8% of all units):
Haight-Ashbury: $1,282,330 city: $1,622,965
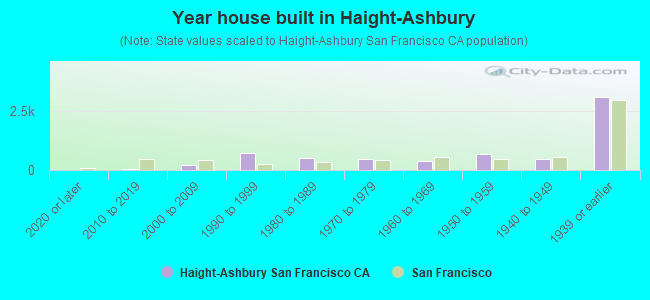
- Year house built in Haight-Ashbury
- 02020 or later
- 232010 to 2019
- 2052000 to 2009
- 7011990 to 1999
- 4971980 to 1989
- 4701970 to 1979
- 3981960 to 1969
- 6871950 to 1959
- 4561940 to 1949
- 3,0751939 or earlier
City-data.com crime index for city in 2020 (higher means more crime):
| City: | 387.4 |
| U.S. average: | 219.5 |
Travel time to work (commute)
![Travel time to work (commute)]()
- 137Less than 5 minutes
- 2435 to 9 minutes
- 49610 to 14 minutes
- 57015 to 19 minutes
- 1,48920 to 24 minutes
- 35725 to 29 minutes
- 90630 to 34 minutes
- 13735 to 39 minutes
- 30140 to 44 minutes
- 51645 to 59 minutes
- 35060 to 89 minutes
- 23490 or more minutes

Means of transportation to work
![Means of transportation to work]()
- 11.1%989Drove a car alone
- 2.3%207Carpooled
- 14.3%1,282Bus
- 9.6%859Subway or elevated rail
- 1.5%136Long-distance train or commuter rail
- 3.7%331Light rail, streetcar or trolley
- 2.6%235Taxi
- 0.2%22Motorcycle
- 11.8%1,053Bicycle
- 21.3%1,906Walked
- 4.5%401Other means
- 24.8%2,219Worked at home

Time leaving home to go to work
![Time leaving home to go to work]()
- 3612:00 a.m. to 4:59 a.m.
- 405:00 a.m. to 5:29 a.m.
- 565:30 a.m. to 5:59 a.m.
- 4526:00 a.m. to 6:29 a.m.
- 8376:30 a.m. to 6:59 a.m.
- 3437:00 a.m. to 7:29 a.m.
- 6727:30 a.m. to 7:59 a.m.
- 1,0468:00 a.m. to 8:29 a.m.
- 7558:30 a.m. to 8:59 a.m.
- 6319:00 a.m. to 9:59 a.m.
- 24110:00 a.m. to 10:59 a.m.
- 15911:00 a.m. to 11:59 a.m.
- 34412:00 p.m. to 3:59 p.m.
- 2404:00 p.m. to 11:59 p.m.

Occupations of males:
- Percentage of males in management occupations (except farmers):
Here: 14.5% city: 17.2%
- Percentage of males in business and financial operations occupations:
Here: 14.9% city: 8.9%
- Percentage of males in computer and mathematical occupations:
Here: 14.2% city: 14.6%
- Percentage of males in architecture and engineering occupations:
Here: 7.6% city: 4.0%
- Percentage of males in life, physical, and social science occupations:
Here: 6.4% city: 2.4%
- Percentage of males in legal occupations:
Here: 1.5% city: 2.5%
- Percentage of males in education, training, and library occupations:
Here: 1.6% city: 3.4%
- Percentage of males in arts, design, entertainment, sports, and media occupations:
Here: 2.7% city: 4.9%
- Percentage of males in service occupations:
Here: 9.4% city: 11.8%
- Percentage of males in sales and office occupations:
Here: 10.2% city: 13.5%
- Percentage of males in construction, extraction, and maintenance occupations:
Here: 5.7% city: 3.1%
- Percentage of males in production occupations:
Here: 3.8% city: 2.5%
- Percentage of males in transportation occupations:
Here: 3.0% city: 3.4%
- Percentage of males in material moving occupations:
Here: 3.9% city: 1.8%
Occupations of females:
- Percentage of females in management occupations (except farmers):
Here: 8.2% city: 15.8%
- Percentage of females in business and financial operations occupations:
Here: 21.8% city: 11.5%
- Percentage of females in life, physical, and social science occupations:
Here: 1.4% city: 2.9%
- Percentage of females in community and social services occupations:
Here: 1.3% city: 1.6%
- Percentage of females in legal occupations:
Here: 6.7% city: 3.0%
- Percentage of females in arts, design, entertainment, sports, and media occupations:
Here: 1.7% city: 5.1%
- Percentage of females in healthcare practitioners and technical occupations:
Here: 29.1% city: 8.4%
- Percentage of females in service occupations:
Here: 14.0% city: 15.4%
- Percentage of females in sales and office occupations:
Here: 13.9% city: 19.3%
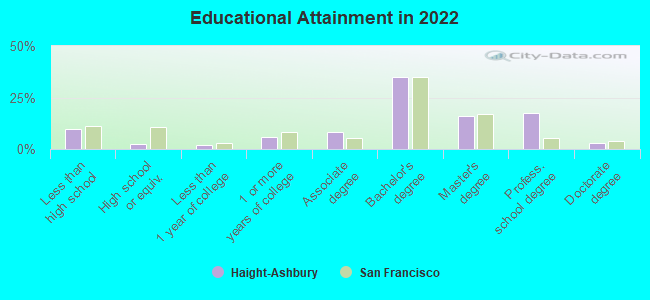
Education in this neighborhood (subdivision or community):
- Percentage of people 3 years and older in K-12 schools:
Haight-Ashbury: 5.9% San Francisco: 9.7%
- Percentage of people 3 years and older in undergraduate colleges:
Haight-Ashbury: 8.2% San Francisco: 4.8%
- Percentage of people 3 years and older in grad. or professional schools:
Haight-Ashbury: 3.0% San Francisco: 2.6%
- Percentage of students K-12 enrolled in private schools:
Haight-Ashbury: 87.8% San Francisco: 36.5%
Percentage of population below poverty level:
| Haight-Ashbury: | 6.8% |
| San Francisco: | 10.4% |
Median year owner moved in (as recorded in 2022):
Median year renter moved in (as recorded in 2022):
| Haight-Ashbury: | 2005 |
| San Francisco: | 2007 |
Median year renter moved in (as recorded in 2022):
| Haight-Ashbury: | 2017 |
| San Francisco: | 2019 |
Percentage of married-couple families with both working:
| Haight-Ashbury: | 106.3% |
| San Francisco: | 75.9% |
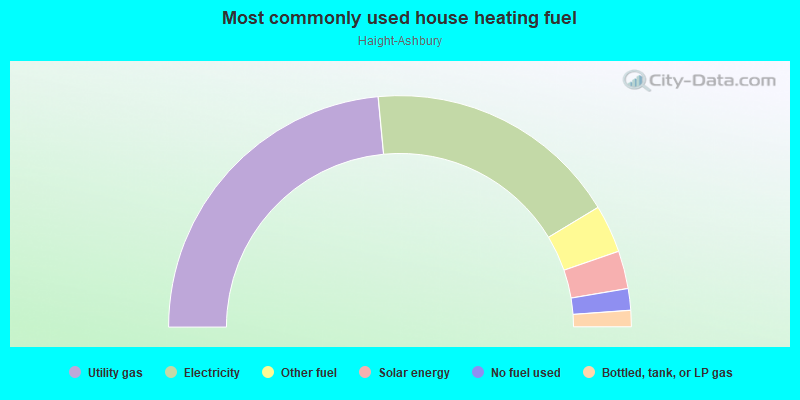
- 47.0%Utility gas
- 35.7%Electricity
- 6.7%Other fuel
- 5.3%Solar energy
- 3.0%No fuel used
- 2.3%Bottled, tank, or LP gas
Roads and streets:
Oak St
Length: 1.09 miles
Directions: E-W, N-S, SW-NE
Address range: 1200 to 2099
Directions: E-W, N-S, SW-NE
Address range: 1200 to 2099
Haight St
Length: 1.03 miles
Direction: E-W
Address range: 1000 to 1899
Direction: E-W
Address range: 1000 to 1899
Page St
Length: 1.03 miles
Direction: E-W
Address range: 1100 to 1999
Direction: E-W
Address range: 1100 to 1999
Waller St
Length: 0.57 miles
Direction: E-W
Address range: 1300 to 1799
Direction: E-W
Address range: 1300 to 1799
Carl St
Length: 0.47 miles
Direction: E-W
Address range: 100 to 453
Direction: E-W
Address range: 100 to 453
Stanyan St
Length: 0.42 miles
Directions: N-S, SE-NW
Address range: 600 to 999
Directions: N-S, SE-NW
Address range: 600 to 999
Cole St
Length: 0.39 miles
Direction: N-S
Address range: 400 to 899
Direction: N-S
Address range: 400 to 899
Frederick St
Length: 0.38 miles
Direction: E-W
Address range: 351 to 599
Direction: E-W
Address range: 351 to 599
Shrader St
Length: 0.33 miles
Direction: N-S
Address range: 400 to 899
Direction: N-S
Address range: 400 to 899
Masonic Ave
Length: 0.20 miles
Directions: N-S, SE-NW
Address range: 1000 to 1299
Directions: N-S, SE-NW
Address range: 1000 to 1299
Clayton St
Length: 0.20 miles
Direction: N-S
Address range: 400 to 699
Direction: N-S
Address range: 400 to 699
Ashbury St
Length: 0.20 miles
Direction: N-S
Address range: 400 to 699
Direction: N-S
Address range: 400 to 699
Beulah St
Length: 0.20 miles
Direction: E-W
Address range: 1 to 199
Direction: E-W
Address range: 1 to 199
Belvedere St
Length: 0.20 miles
Direction: N-S
Address range: 1 to 199
Direction: N-S
Address range: 1 to 199
Central Ave
Length: 0.13 miles
Direction: N-S
Address range: 100 to 299
Direction: N-S
Address range: 100 to 299
Broderick St
Length: 0.13 miles
Direction: N-S
Address range: 100 to 299
Direction: N-S
Address range: 100 to 299
Lyon St
Length: 0.13 miles
Direction: N-S
Address range: 1 to 199
Direction: N-S
Address range: 1 to 199
Baker St
Length: 0.13 miles
Direction: N-S
Address range: 1 to 199
Direction: N-S
Address range: 1 to 199
Kezar Dr
Length: 0.12 miles
Direction: E-W
Address range: 100 to 199
Direction: E-W
Address range: 100 to 199
Willard St
Length: 0.07 miles
Direction: N-S
Address range: 1200 to 1299
Direction: N-S
Address range: 1200 to 1299