Hidden Homestead neighborhood in Vancouver, Washington (WA), 98661 detailed profile
Settings
X

Business Search - 14 Million verified businesses
Area: 0.127 square miles
Population: 902
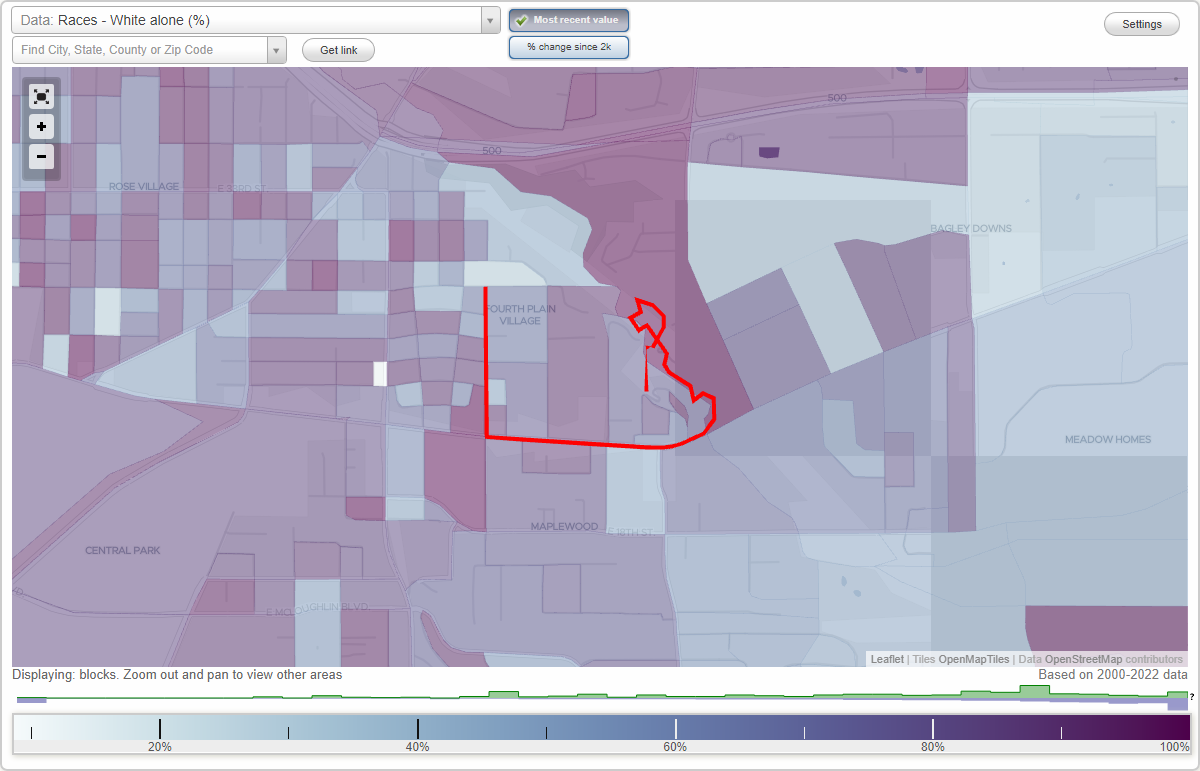
Population density:
| Hidden Homestead: | 7,101 people per square mile |
| Vancouver: | 4,545 people per square mile |

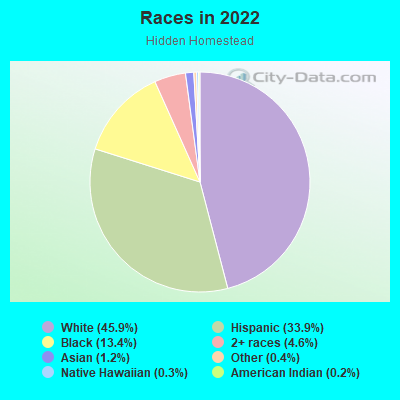
- 41645.9%White
- 30733.9%Hispanic or Latino
- 12113.4%Black
- 424.6%Two or more races
- 111.2%Asian
- 40.4%Some other race
- 30.3%Native Hawaiian and Other
Pacific Islander - 20.2%American Indian
Median household income in 2022:
| Hidden Homestead: | $66,355 |
| Vancouver: | $76,799 |
Distribution of median household income
![Distribution of median household income]()
- 69Less than $10,000
- 10$10,000 to $19,999
- 8$20,000 to $29,999
- 19$30,000 to $39,999
- 29$40,000 to $49,999
- 42$50,000 to $59,999
- 16$60,000 to $74,999
- 81$75,000 to $99,999
- 27$100,000 to $124,999
- 73$125,000 to $149,999
- 19$150,000 to $199,999
- 14$200,000 or more

Distribution of owner-occupied house/condo value
![Distribution of owner-occupied house/condo value]()
- 11Less than $50,000
- 8$50,000 to $99,999
- 5$100,000 to $149,999
- 10$150,000 to $199,999
- 5$200,000 to $249,999
- 37$250,000 to $299,999
- 57$300,000 to $399,999
- 33$400,000 to $499,999
- 8$500,000 to $749,999
- 8$750,000 to $999,999
- 3$1,000,000 or more

Distribution of rent paid by renters
![Distribution of rent paid by renters]()
- 4Less than $100
- 79$100 to $199
- 14$200 to $299
- 34$300 to $399
- 7$400 to $499
- 4$500 to $599
- 32$600 to $699
- 40$700 to $799
- 20$800 to $899
- 60$900 to $999
- 168$1,000 to $1,249
- 20$1,250 to $1,499
- 38$1,500 to $1,999
- 7$2,000 or more

Median rent in 2022:
| Hidden Homestead: | $1,150 |
| Vancouver: | $1,452 |
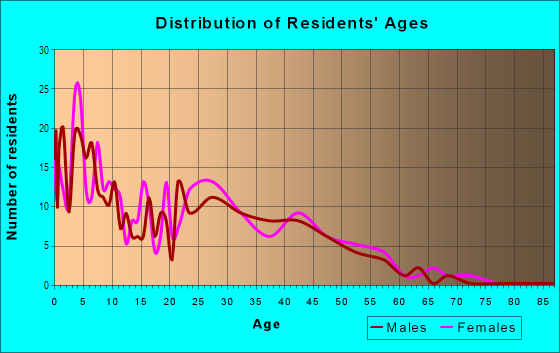
| Males: | 425 |
| Females: | 477 |
Males:
| This neighborhood: | 35.8 years |
| Whole city: | 34.7 years |
| This neighborhood: | 34.8 years |
| Whole city: | 39.9 years |
Average household size:
| Hidden Homestead: | 2.1 people |
| Vancouver: | 2.4 people |
Percentage of family households:
| Hidden Homestead: | 54.7% |
| Vancouver: | 40.5% |
| Here: | 34.3% |
| Vancouver: | 40.2% |
Percentage of married-couple families with children (among all households):
| Hidden Homestead: | 16.4% |
| Vancouver: | 27.2% |
Percentage of single-mother households (among all households):
| Hidden Homestead: | 27.2% |
| Vancouver: | 9.7% |
Percentage of never married males 15 years old and over:
Percentage of never married females 15 years old and over:
| Hidden Homestead: | 29.2% |
| Vancouver: | 18.8% |
Percentage of never married females 15 years old and over:
| Hidden Homestead: | 22.0% |
| city: | 17.6% |
Percentage of people that speak English not well or not at all:
| Hidden Homestead: | 6.5% |
| Vancouver: | 4.9% |
Percentage of people born in this state:
Percentage of people born in another U.S. state:
Percentage of native residents but born outside the U.S.:
Percentage of foreign born residents:
| Here: | 33.2% |
| Vancouver: | 30.3% |
Percentage of people born in another U.S. state:
| Hidden Homestead: | 47.4% |
| Vancouver: | 54.5% |
Percentage of native residents but born outside the U.S.:
| Here: | 1.7% |
| city: | 1.4% |
Percentage of foreign born residents:
| Here: | 17.7% |
| Vancouver: | 13.8% |
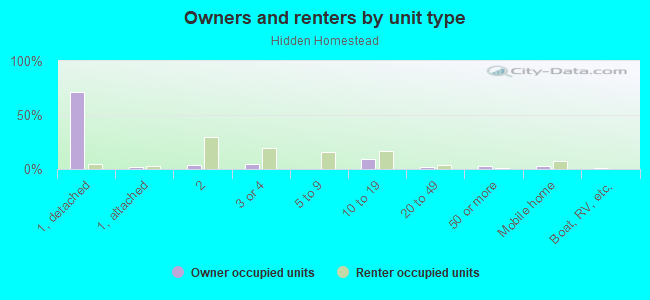
Owner-occupied
Renter-occupied

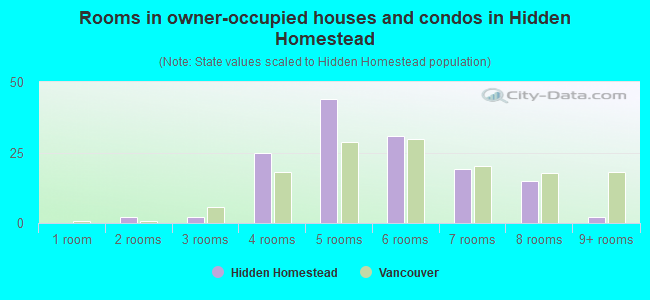
- Rooms in owner-occupied houses and condos in Hidden Homestead
- 01 room
- 22 rooms
- 23 rooms
- 254 rooms
- 445 rooms
- 316 rooms
- 197 rooms
- 158 rooms
- 29+ rooms
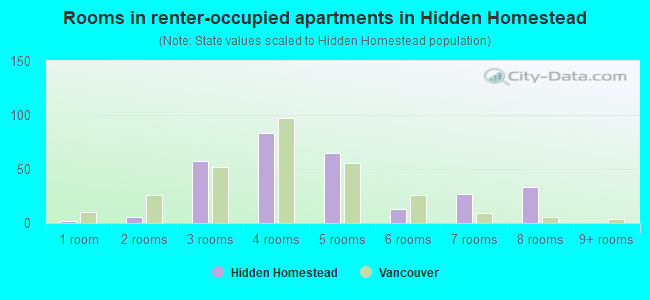
- Rooms in renter-occupied apartments in Hidden Homestead
- 21 room
- 62 rooms
- 573 rooms
- 834 rooms
- 655 rooms
- 136 rooms
- 277 rooms
- 338 rooms
- 09+ rooms
Owner-occupied
Renter-occupied
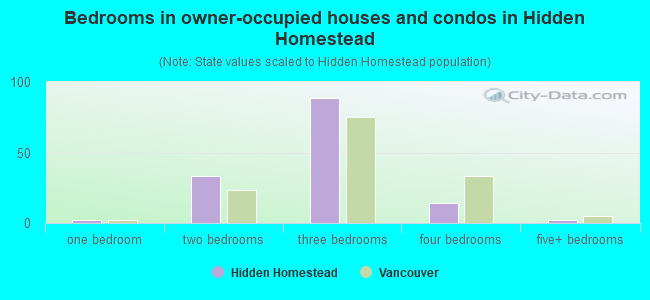
- Bedrooms in owner-occupied houses and condos in Hidden Homestead
- 0no bedroom
- 21 bedroom
- 332 bedrooms
- 893 bedrooms
- 144 bedrooms
- 25+ bedrooms
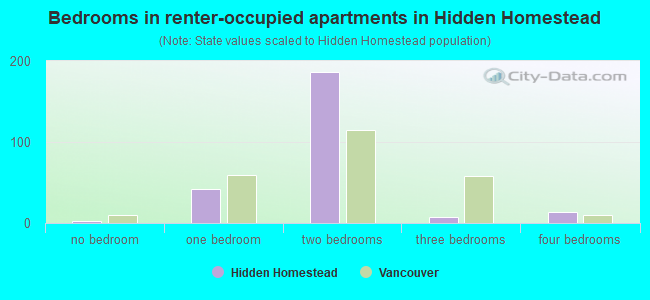
- Bedrooms in renter-occupied apartments in Hidden Homestead
- 2no bedroom
- 421 bedroom
- 1872 bedrooms
- 83 bedrooms
- 144 bedrooms
- 05+ bedrooms
Average number of cars or other vehicles available in houses/condos:
Average number of cars or other vehicles available in apartments:
| This neighborhood: | 1.8 |
| Vancouver: | 2.2 |
Average number of cars or other vehicles available in apartments:
| Here: | 1.7 |
| city: | 1.4 |
Percentage of units with a mortgage:
| Hidden Homestead: | 81.6% |
| Vancouver: | 64.8% |
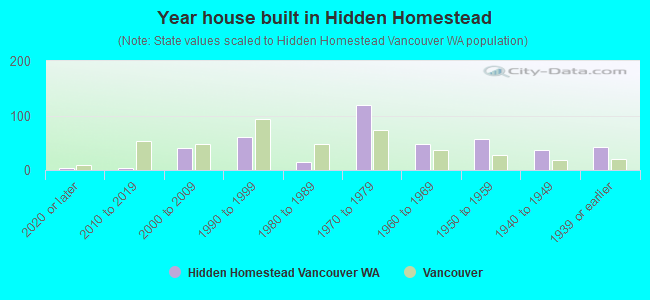
- Year house built in Hidden Homestead
- 32020 or later
- 32010 to 2019
- 402000 to 2009
- 611990 to 1999
- 151980 to 1989
- 1191970 to 1979
- 481960 to 1969
- 561950 to 1959
- 371940 to 1949
- 431939 or earlier
City-data.com crime index for city in 2020 (higher means more crime):
| City: | 339.4 |
| U.S. average: | 219.5 |
Travel time to work (commute)
![Travel time to work (commute)]()
- 495 to 9 minutes
- 6310 to 14 minutes
- 5115 to 19 minutes
- 8020 to 24 minutes
- 5825 to 29 minutes
- 8430 to 34 minutes
- 1435 to 39 minutes
- 1640 to 44 minutes
- 345 to 59 minutes
- 5760 to 89 minutes
- 690 or more minutes

Means of transportation to work
![Means of transportation to work]()
- 86.5%516Drove a car alone
- 8.4%50Carpooled
- 0.8%5Bus
- 0.2%1Walked
- 0.5%3Other means
- 4.2%25Worked at home

Time leaving home to go to work
![Time leaving home to go to work]()
- 8912:00 a.m. to 4:59 a.m.
- 255:00 a.m. to 5:29 a.m.
- 155:30 a.m. to 5:59 a.m.
- 796:00 a.m. to 6:29 a.m.
- 406:30 a.m. to 6:59 a.m.
- 337:00 a.m. to 7:29 a.m.
- 317:30 a.m. to 7:59 a.m.
- 568:00 a.m. to 8:29 a.m.
- 228:30 a.m. to 8:59 a.m.
- 139:00 a.m. to 9:59 a.m.
- 1510:00 a.m. to 10:59 a.m.
- 911:00 a.m. to 11:59 a.m.
- 4512:00 p.m. to 3:59 p.m.
- 184:00 p.m. to 11:59 p.m.

Occupations of males:
- Percentage of males in business and financial operations occupations:
Here: 17.5% city: 5.2%
- Percentage of males in computer and mathematical occupations:
Here: 6.9% city: 4.9%
- Percentage of males in architecture and engineering occupations:
Here: 3.3% city: 3.6%
- Percentage of males in life, physical, and social science occupations:
Here: 3.3% city: 0.9%
- Percentage of males in education, training, and library occupations:
Here: 2.0% city: 2.4%
- Percentage of males in healthcare practitioners and technical occupations:
Here: 2.3% city: 2.3%
- Percentage of males in service occupations:
Here: 31.2% city: 12.4%
- Percentage of males in sales and office occupations:
Here: 23.7% city: 15.7%
- Percentage of males in farming, fishing, and forestry occupations:
Here: 4.6% city: 0.5%
- Percentage of males in construction, extraction, and maintenance occupations:
Here: 5.9% city: 11.5%
- Percentage of males in production occupations:
Here: 1.1% city: 8.2%
- Percentage of males in material moving occupations:
Here: 2.1% city: 5.8%
Occupations of females:
- Percentage of females in business and financial operations occupations:
Here: 22.6% city: 7.3%
- Percentage of females in computer and mathematical occupations:
Here: 4.4% city: 2.7%
- Percentage of females in architecture and engineering occupations:
Here: 2.7% city: 0.7%
- Percentage of females in life, physical, and social science occupations:
Here: 2.9% city: 1.0%
- Percentage of females in community and social services occupations:
Here: 1.4% city: 1.9%
- Percentage of females in legal occupations:
Here: 2.3% city: 1.0%
- Percentage of females in education, training, and library occupations:
Here: 6.0% city: 6.5%
- Percentage of females in arts, design, entertainment, sports, and media occupations:
Here: 2.4% city: 2.2%
- Percentage of females in service occupations:
Here: 19.6% city: 24.5%
- Percentage of females in sales and office occupations:
Here: 37.8% city: 26.7%
- Percentage of females in production occupations:
Here: 2.7% city: 3.4%
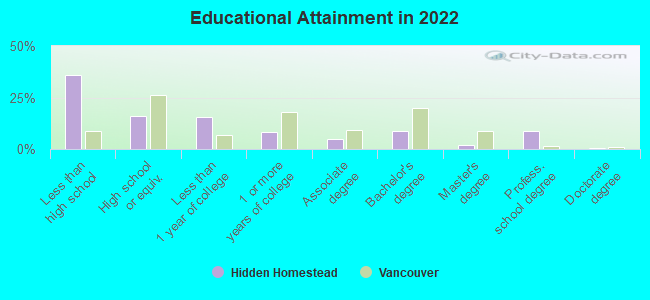
Education in this neighborhood (subdivision or community):
- Percentage of people 3 years and older in K-12 schools:
Hidden Homestead: 19.9% Vancouver: 16.4%
- Percentage of people 3 years and older in undergraduate colleges:
Hidden Homestead: 6.0% Vancouver: 4.1%
- Percentage of people 3 years and older in grad. or professional schools:
Hidden Homestead: 3.2% Vancouver: 1.0%
- Percentage of students K-12 enrolled in private schools:
Hidden Homestead: 10.2% Vancouver: 6.8%
Percentage of population below poverty level:
| Hidden Homestead: | 17.0% |
| Vancouver: | 10.0% |
Median year owner moved in (as recorded in 2022):
Median year renter moved in (as recorded in 2022):
| Hidden Homestead: | 2011 |
| Vancouver: | 2012 |
Median year renter moved in (as recorded in 2022):
| Hidden Homestead: | 2016 |
| Vancouver: | 2020 |
Percentage of married-couple families with both working:
| Hidden Homestead: | 106.9% |
| Vancouver: | 55.7% |
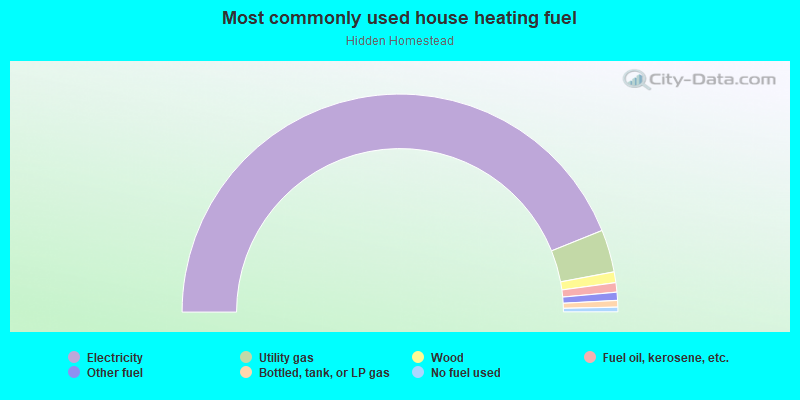
- 87.8%Electricity
- 6.3%Utility gas
- 1.6%Wood
- 1.4%Fuel oil, kerosene, etc.
- 1.2%Other fuel
- 1.0%Bottled, tank, or LP gas
- 0.7%No fuel used
Roads and streets:
E Fourth Plain Blvd
Length: 0.45 miles
Direction: E-W
Address range: 3256 to 3799
Direction: E-W
Address range: 3256 to 3799
Algona Dr
Length: 0.31 miles
Directions: E-W, N-S, SE-NW, SW-NE
Address range: 62 to 2499
Directions: E-W, N-S, SE-NW, SW-NE
Address range: 62 to 2499
Rossiter Ln
Length: 0.22 miles
Direction: N-S
Address range: 2200 to 2799
Direction: N-S
Address range: 2200 to 2799
Neals Ln
Length: 0.21 miles
Direction: N-S
Address range: 2200 to 2798
Direction: N-S
Address range: 2200 to 2798
Terrace Dr
Length: 0.16 miles
Directions: E-W, N-S, SE-NW, SW-NE
Address range: 1 to 35
Directions: E-W, N-S, SE-NW, SW-NE
Address range: 1 to 35
Hazelwood Dr
Length: 0.13 miles
Directions: E-W, N-S, SW-NE
Address range: 21 to 3825
Directions: E-W, N-S, SW-NE
Address range: 21 to 3825
Overlook Dr
Length: 0.12 miles
Directions: E-W, N-S, SE-NW, SW-NE
Directions: E-W, N-S, SE-NW, SW-NE
Howard St
Length: 0.12 miles
Directions: N-S, SE-NW
Address range: 2300 to 2499
Directions: N-S, SE-NW
Address range: 2300 to 2499
E 27th St
Length: 0.10 miles
Direction: E-W
Direction: E-W
Rossiter Pl
Length: 0.06 miles
Direction: E-W
Address range: 3700 to 3799
Direction: E-W
Address range: 3700 to 3799
Cedar Dr
Length: 0.04 miles
Directions: N-S, SE-NW
Directions: N-S, SE-NW
Other features:
Burnt Bridge Crk
Length: 0.08 miles
Directions: N-S, SE-NW, SW-NE
Directions: N-S, SE-NW, SW-NE