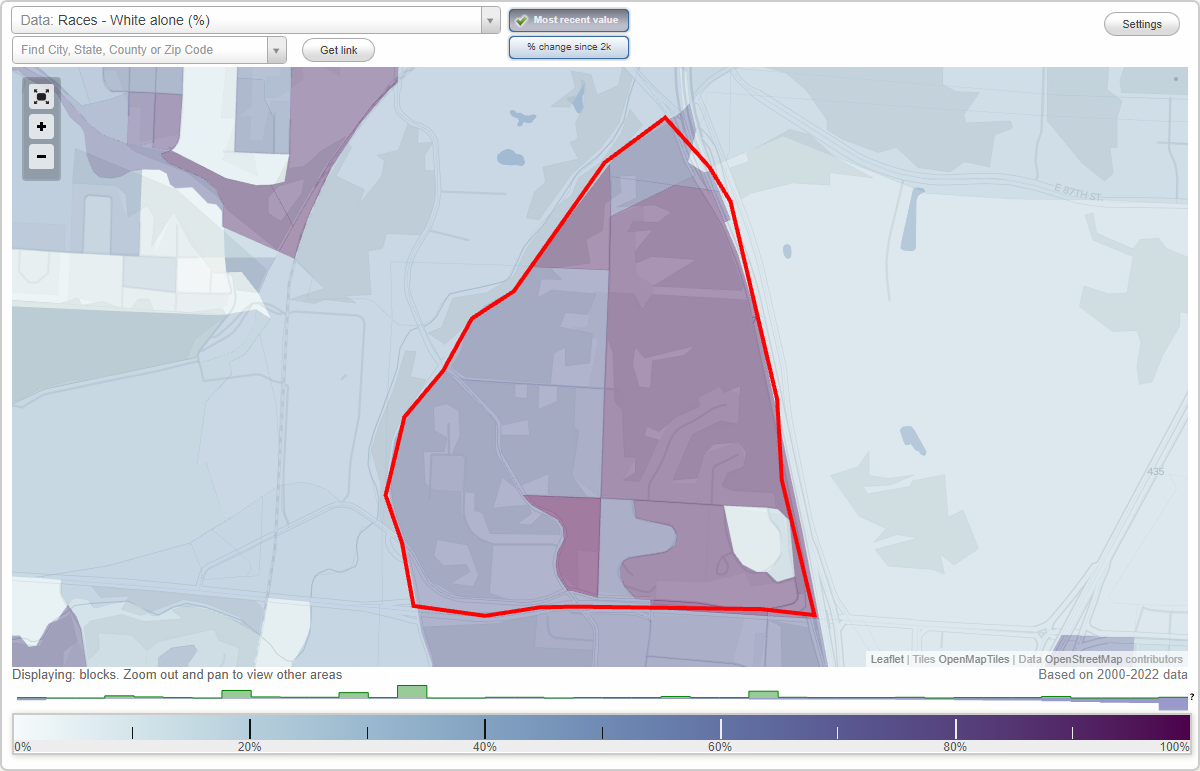
Hidden Valley neighborhood in Kansas City, Missouri (MO), 64132 detailed profile
Settings
X

Business Search - 14 Million verified businesses
Area: 0.743 square miles
Population: 947
Population density:
| Hidden Valley: | 1,275 people per square mile |
| Kansas City: | 1,624 people per square mile |

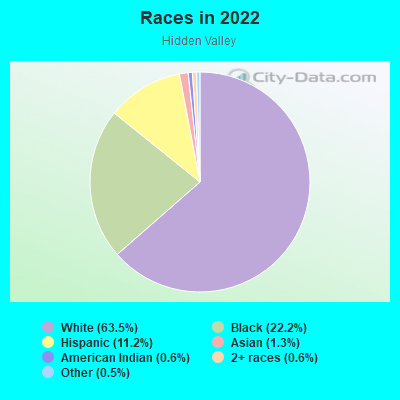
- 60363.5%White
- 21122.2%Black
- 10611.2%Hispanic or Latino
- 121.3%Asian
- 60.6%American Indian
- 60.6%Two or more races
- 50.5%Some other race
Median household income in 2022:
| Hidden Valley: | $52,718 |
| Kansas City: | $62,175 |
Distribution of median household income
![Distribution of median household income]()
- 17Less than $10,000
- 26$10,000 to $19,999
- 23$20,000 to $29,999
- 40$30,000 to $39,999
- 39$40,000 to $49,999
- 18$50,000 to $59,999
- 41$60,000 to $74,999
- 41$75,000 to $99,999
- 37$100,000 to $124,999
- 10$125,000 to $149,999
- 36$150,000 to $199,999
- 15$200,000 or more

Distribution of owner-occupied house/condo value
![Distribution of owner-occupied house/condo value]()
- 34Less than $50,000
- 66$50,000 to $99,999
- 70$100,000 to $149,999
- 25$150,000 to $199,999
- 6$200,000 to $249,999
- 11$250,000 to $299,999
- 15$300,000 to $399,999
- 7$750,000 to $999,999

Distribution of rent paid by renters
![Distribution of rent paid by renters]()
- 9Less than $100
- 30$100 to $199
- 28$200 to $299
- 38$300 to $399
- 19$400 to $499
- 51$500 to $599
- 25$600 to $699
- 40$700 to $799
- 9$800 to $899
- 38$900 to $999
- 54$1,000 to $1,249
- 22$1,250 to $1,499

Median rent in 2022:
| Hidden Valley: | $1,059 |
| Kansas City: | $959 |
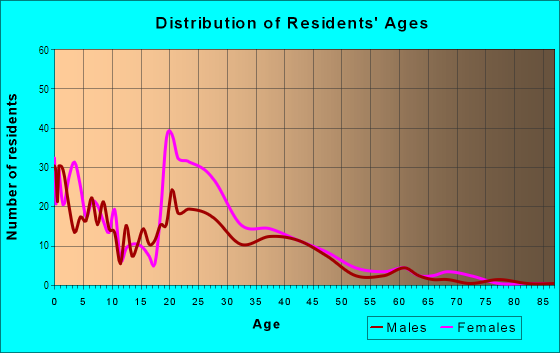
| Males: | 542 |
| Females: | 404 |
Males:
| This neighborhood: | 30.7 years |
| Whole city: | 35.3 years |
| This neighborhood: | 31.7 years |
| Whole city: | 36.6 years |
Average household size:
| Hidden Valley: | 2.5 people |
| Kansas City: | 2.2 people |
Percentage of family households:
| Hidden Valley: | 34.9% |
| Kansas City: | 37.9% |
| Here: | 35.1% |
| Kansas City: | 35.0% |
Percentage of married-couple families with children (among all households):
| Hidden Valley: | 17.1% |
| Kansas City: | 26.7% |
Percentage of single-mother households (among all households):
| Hidden Valley: | 14.1% |
| Kansas City: | 14.3% |
Percentage of never married males 15 years old and over:
Percentage of never married females 15 years old and over:
| Hidden Valley: | 34.9% |
| Kansas City: | 20.0% |
Percentage of never married females 15 years old and over:
| Hidden Valley: | 23.2% |
| city: | 20.0% |
Percentage of people that speak English not well or not at all:
| Hidden Valley: | 5.3% |
| Kansas City: | 2.5% |
Percentage of people born in this state:
Percentage of people born in another U.S. state:
Percentage of native residents but born outside the U.S.:
Percentage of foreign born residents:
| Here: | 62.7% |
| Kansas City: | 53.2% |
Percentage of people born in another U.S. state:
| Hidden Valley: | 29.5% |
| Kansas City: | 38.2% |
Percentage of native residents but born outside the U.S.:
| Here: | 0.2% |
| city: | 1.0% |
Percentage of foreign born residents:
| Here: | 7.8% |
| Kansas City: | 7.6% |
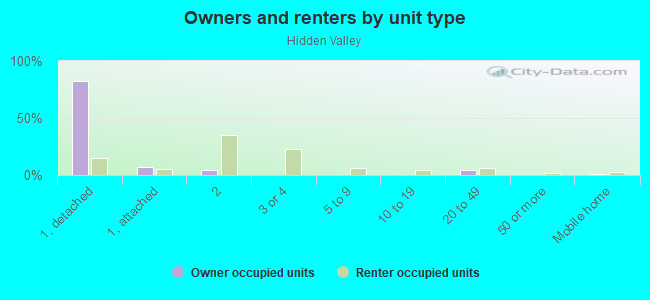
Owner-occupied
Renter-occupied

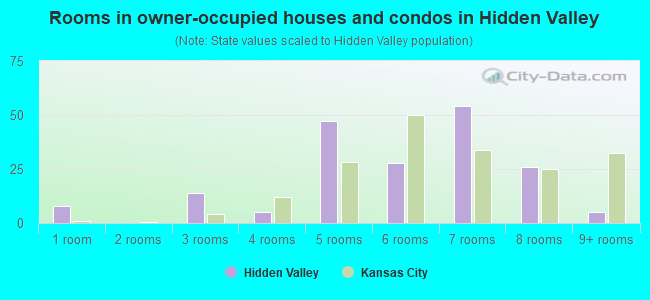
- Rooms in owner-occupied houses and condos in Hidden Valley
- 81 room
- 02 rooms
- 143 rooms
- 54 rooms
- 475 rooms
- 286 rooms
- 547 rooms
- 268 rooms
- 59+ rooms
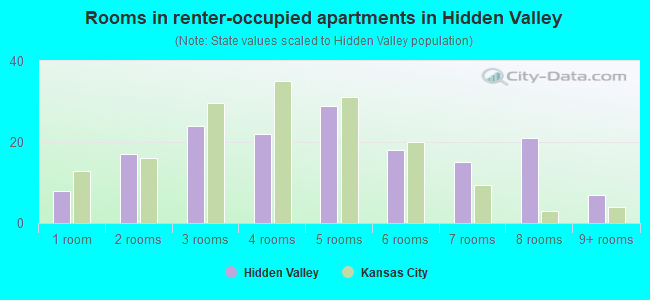
- Rooms in renter-occupied apartments in Hidden Valley
- 81 room
- 172 rooms
- 243 rooms
- 224 rooms
- 295 rooms
- 186 rooms
- 157 rooms
- 218 rooms
- 79+ rooms
Owner-occupied
Renter-occupied
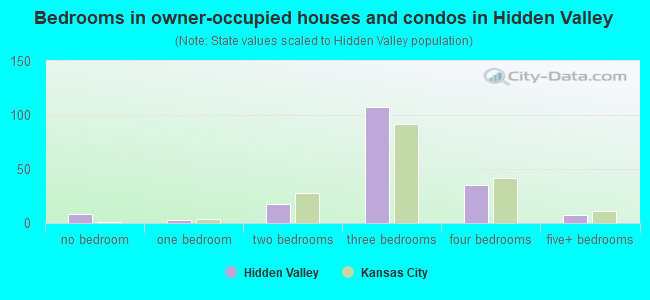
- Bedrooms in owner-occupied houses and condos in Hidden Valley
- 8no bedroom
- 31 bedroom
- 182 bedrooms
- 1073 bedrooms
- 354 bedrooms
- 75+ bedrooms
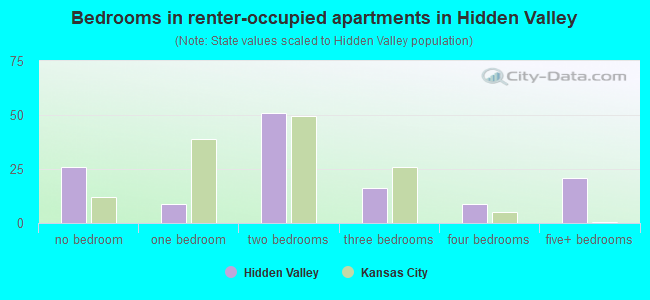
- Bedrooms in renter-occupied apartments in Hidden Valley
- 26no bedroom
- 91 bedroom
- 512 bedrooms
- 163 bedrooms
- 94 bedrooms
- 215+ bedrooms
Average number of cars or other vehicles available in houses/condos:
Average number of cars or other vehicles available in apartments:
| This neighborhood: | 1.8 |
| Kansas City: | 1.9 |
Average number of cars or other vehicles available in apartments:
| Here: | 1.8 |
| city: | 1.2 |
Percentage of units with a mortgage:
| Hidden Valley: | 21.6% |
| Kansas City: | 62.2% |
Average estimated value of detached houses in 2022 (80.9% of all units):
| Hidden Valley: | $117,888 |
| Kansas City: | $271,492 |
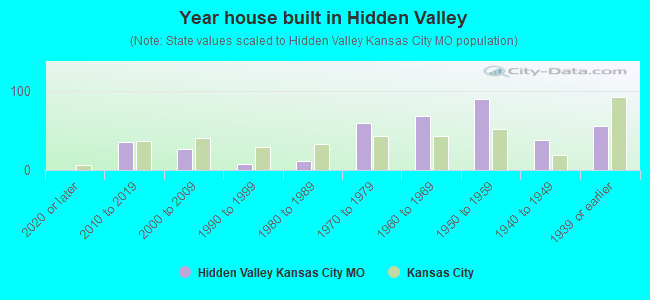
- Year house built in Hidden Valley
- 02020 or later
- 362010 to 2019
- 262000 to 2009
- 81990 to 1999
- 111980 to 1989
- 601970 to 1979
- 691960 to 1969
- 901950 to 1959
- 381940 to 1949
- 561939 or earlier
City-data.com crime index for city in 2020 (higher means more crime):
| City: | 671.9 |
| U.S. average: | 219.5 |
Travel time to work (commute)
![Travel time to work (commute)]()
- 7Less than 5 minutes
- 515 to 9 minutes
- 7810 to 14 minutes
- 15015 to 19 minutes
- 22420 to 24 minutes
- 11025 to 29 minutes
- 19530 to 34 minutes
- 2435 to 39 minutes
- 4740 to 44 minutes
- 3645 to 59 minutes
- 1360 to 89 minutes
- 1290 or more minutes

Means of transportation to work
![Means of transportation to work]()
- 80.9%429Drove a car alone
- 1.5%8Carpooled
- 1.1%6Bus
- 5.1%27Walked
- 15.3%81Other means
- 12.1%64Worked at home

Time leaving home to go to work
![Time leaving home to go to work]()
- 5712:00 a.m. to 4:59 a.m.
- 75:00 a.m. to 5:29 a.m.
- 125:30 a.m. to 5:59 a.m.
- 786:00 a.m. to 6:29 a.m.
- 266:30 a.m. to 6:59 a.m.
- 807:00 a.m. to 7:29 a.m.
- 2267:30 a.m. to 7:59 a.m.
- 928:00 a.m. to 8:29 a.m.
- 438:30 a.m. to 8:59 a.m.
- 919:00 a.m. to 9:59 a.m.
- 910:00 a.m. to 10:59 a.m.
- 1811:00 a.m. to 11:59 a.m.
- 14412:00 p.m. to 3:59 p.m.
- 724:00 p.m. to 11:59 p.m.

Occupations of males:
- Percentage of males in education, training, and library occupations:
Here: 2.5% city: 2.6%
- Percentage of males in arts, design, entertainment, sports, and media occupations:
Here: 6.7% city: 2.4%
- Percentage of males in healthcare practitioners and technical occupations:
Here: 3.1% city: 3.4%
- Percentage of males in service occupations:
Here: 22.4% city: 13.8%
- Percentage of males in sales and office occupations:
Here: 15.7% city: 16.1%
- Percentage of males in construction, extraction, and maintenance occupations:
Here: 10.1% city: 7.3%
- Percentage of males in transportation occupations:
Here: 3.6% city: 6.2%
- Percentage of males in material moving occupations:
Here: 32.4% city: 6.3%
Occupations of females:
- Percentage of females in management occupations (except farmers):
Here: 2.8% city: 9.9%
- Percentage of females in business and financial operations occupations:
Here: 23.7% city: 7.2%
- Percentage of females in architecture and engineering occupations:
Here: 5.5% city: 0.7%
- Percentage of females in legal occupations:
Here: 4.4% city: 1.6%
- Percentage of females in education, training, and library occupations:
Here: 7.7% city: 8.0%
- Percentage of females in service occupations:
Here: 20.5% city: 18.7%
- Percentage of females in sales and office occupations:
Here: 35.3% city: 26.2%
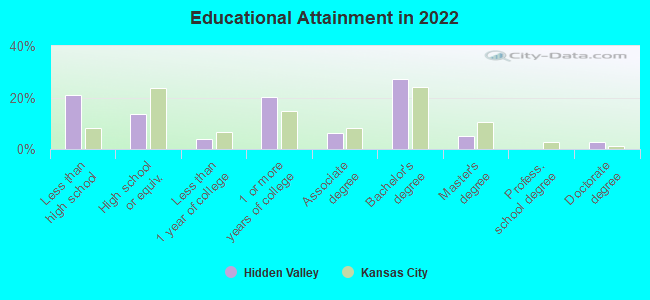
Education in this neighborhood (subdivision or community):
- Percentage of people 3 years and older in K-12 schools:
Hidden Valley: 16.0% Kansas City: 15.8%
- Percentage of people 3 years and older in undergraduate colleges:
Hidden Valley: 14.0% Kansas City: 5.0%
- Percentage of people 3 years and older in grad. or professional schools:
Hidden Valley: 2.0% Kansas City: 1.7%
- Percentage of students K-12 enrolled in private schools:
Hidden Valley: 125.3% Kansas City: 14.7%
Percentage of population below poverty level:
| Hidden Valley: | 32.6% |
| Kansas City: | 14.6% |
Median year owner moved in (as recorded in 2022):
Median year renter moved in (as recorded in 2022):
| Hidden Valley: | 2005 |
| Kansas City: | 2012 |
Median year renter moved in (as recorded in 2022):
| Hidden Valley: | 2017 |
| Kansas City: | 2020 |
Percentage of married-couple families with both working:
| Hidden Valley: | 100.5% |
| Kansas City: | 76.6% |
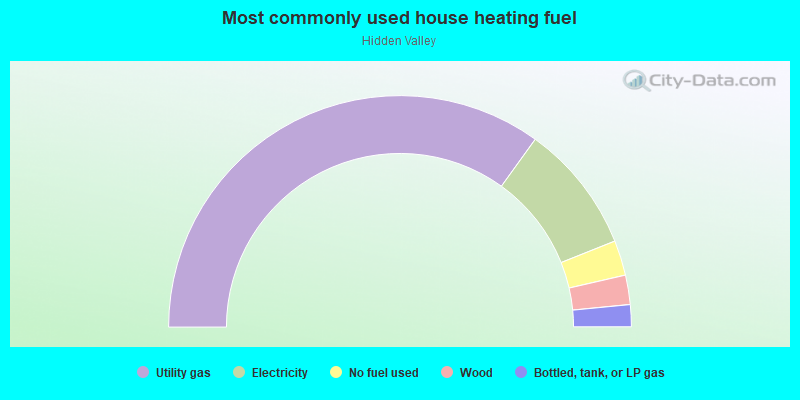
- 69.9%Utility gas
- 18.0%Electricity
- 4.9%No fuel used
- 4.1%Wood
- 3.1%Bottled, tank, or LP gas
Limited-access highways (interstate or state) in this neighborhood:
US Hwy 71
Length: 0.71 miles
Directions: N-S, SE-NW
Address range: 8627 to 8799
Directions: N-S, SE-NW
Address range: 8627 to 8799
Roads and streets:
Indiana Ave
Length: 1.00 miles
Direction: N-S
Address range: 8701 to 9499
Direction: N-S
Address range: 8701 to 9499
E 93 St (E 93rd St)
Length: 0.80 miles
Directions: E-W, N-S, SE-NW
Address range: 3000 to 3999
Directions: E-W, N-S, SE-NW
Address range: 3000 to 3999
Grandview Rd
Length: 0.70 miles
Directions: E-W, N-S, SE-NW, SW-NE
Address range: 2776 to 9498
Directions: E-W, N-S, SE-NW, SW-NE
Address range: 2776 to 9498
Bales Dr
Length: 0.57 miles
Directions: E-W, N-S, SE-NW, SW-NE
Address range: 9300 to 9499
Directions: E-W, N-S, SE-NW, SW-NE
Address range: 9300 to 9499
Cleveland Ave
Length: 0.54 miles
Directions: E-W, N-S, SE-NW, SW-NE
Address range: 9200 to 9499
Directions: E-W, N-S, SE-NW, SW-NE
Address range: 9200 to 9499
E 91 St (E 91st St)
Length: 0.51 miles
Direction: E-W
Address range: 3000 to 3499
Direction: E-W
Address range: 3000 to 3499
Gable St
Length: 0.39 miles
Direction: E-W
Direction: E-W
Gable Rd
Length: 0.38 miles
Directions: E-W, N-S, SW-NE
Address range: 3300 to 9498
Directions: E-W, N-S, SW-NE
Address range: 3300 to 9498
Askew Ave
Length: 0.36 miles
Directions: E-W, N-S, SW-NE
Address range: 9100 to 9299
Directions: E-W, N-S, SW-NE
Address range: 9100 to 9299
Chestnut Ave
Length: 0.33 miles
Directions: E-W, N-S, SE-NW
Address range: 9100 to 9399
Directions: E-W, N-S, SE-NW
Address range: 9100 to 9399
E Bannister Rd (State Hwy W, Co Hwy 8-S, E 95th St)
Length: 0.21 miles
Direction: E-W
Address range: 3300 to 3688
Direction: E-W
Address range: 3300 to 3688
E 94 St (E 94th St)
Length: 0.20 miles
Direction: E-W
Address range: 3000 to 3299
Direction: E-W
Address range: 3000 to 3299
Myrtle Ave
Length: 0.18 miles
Directions: N-S, SE-NW, SW-NE
Address range: 9300 to 9499
Directions: N-S, SE-NW, SW-NE
Address range: 9300 to 9499
Blue River Rd
Length: 0.11 miles
Direction: N-S
Direction: N-S
Montgall Ave
Length: 0.10 miles
Directions: N-S, SW-NE
Address range: 9200 to 9399
Directions: N-S, SW-NE
Address range: 9200 to 9399
E 92 St (E 92nd St)
Length: 0.10 miles
Directions: E-W, SE-NW, SW-NE
Address range: 2700 to 2899
Directions: E-W, SE-NW, SW-NE
Address range: 2700 to 2899
E 94 Ter
Length: 0.09 miles
Directions: E-W, SE-NW
Directions: E-W, SE-NW
E Bannister Rd
Length: 0.09 miles
Directions: E-W, SW-NE
Directions: E-W, SW-NE
Crestview Dr
Length: 0.02 miles
Direction: N-S
Address range: 9400 to 9449
Direction: N-S
Address range: 9400 to 9449