Hideaway Hills neighborhood in Ambler, Pennsylvania (PA), 19002 detailed profile
Settings
X

Business Search - 14 Million verified businesses
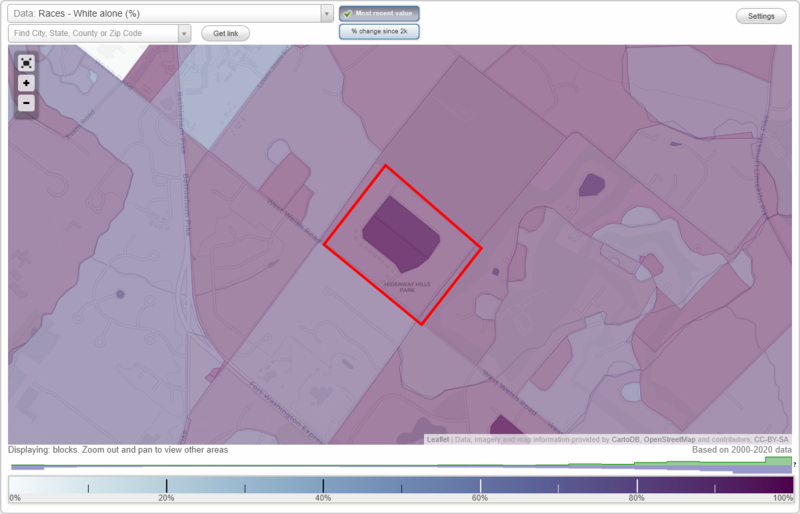
Area: 0.144 square miles
Population: 273
Population density:
| Hideaway Hills: | 1,896 people per square mile |
| Ambler: | 8,019 people per square mile |

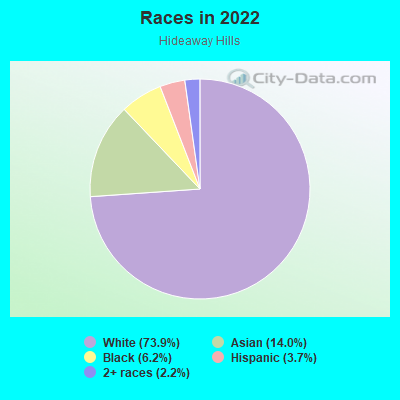
- 20173.9%White
- 3814.0%Asian
- 176.2%Black
- 103.7%Hispanic or Latino
- 62.2%Two or more races
Median household income in 2022:
| Hideaway Hills: | $89,737 |
| Ambler: | $84,303 |
Distribution of median household income
![Distribution of median household income]()
- 1Less than $10,000
- 1$10,000 to $19,999
- 7$20,000 to $29,999
- 1$30,000 to $39,999
- 3$40,000 to $49,999
- 14$50,000 to $59,999
- 11$60,000 to $74,999
- 22$75,000 to $99,999
- 9$100,000 to $124,999
- 5$125,000 to $149,999
- 7$150,000 to $199,999
- 30$200,000 or more

Distribution of owner-occupied house/condo value
![Distribution of owner-occupied house/condo value]()
- 3Less than $50,000
- 1$50,000 to $99,999
- 2$100,000 to $149,999
- 1$200,000 to $249,999
- 1$250,000 to $299,999
- 5$300,000 to $399,999
- 1$400,000 to $499,999
- 9$500,000 to $749,999
- 23$750,000 to $999,999
- 6$1,000,000 or more

Distribution of rent paid by renters
![Distribution of rent paid by renters]()
- 2$100 to $199
- 1$700 to $799
- 4$1,000 to $1,249
- 45$1,250 to $1,499
- 12$1,500 to $1,999
- 12$2,000 or more

Median rent in 2022:
| Hideaway Hills: | $1,408 |
| Ambler: | $1,161 |
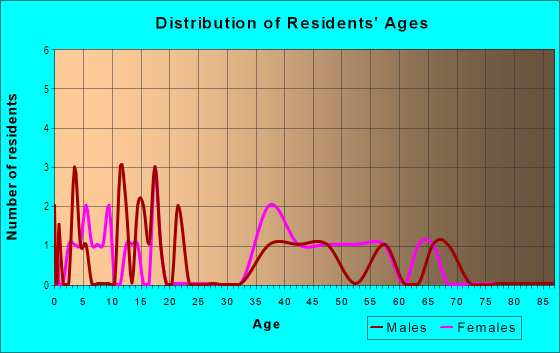
| Males: | 144 |
| Females: | 129 |
Males:
| This neighborhood: | 37.2 years |
| Whole city: | 32.5 years |
| This neighborhood: | 50.1 years |
| Whole city: | 41.6 years |
Average household size:
| Hideaway Hills: | 2.2 people |
| Ambler: | 2.5 people |
Percentage of family households:
| Hideaway Hills: | 42.8% |
| Ambler: | 51.4% |
| Here: | 44.1% |
| Ambler: | 47.0% |
Percentage of married-couple families with children (among all households):
| Hideaway Hills: | 16.8% |
| Ambler: | 28.6% |
Percentage of single-mother households (among all households):
| Hideaway Hills: | 2.3% |
| Ambler: | 7.9% |
Percentage of never married males 15 years old and over:
Percentage of never married females 15 years old and over:
| Hideaway Hills: | 22.4% |
| Ambler: | 18.3% |
Percentage of never married females 15 years old and over:
| Hideaway Hills: | 13.5% |
| borough: | 17.4% |
Percentage of people that speak English not well or not at all:
| Hideaway Hills: | 1.2% |
| Ambler: | 1.4% |
Percentage of people born in this state:
Percentage of people born in another U.S. state:
Percentage of native residents but born outside the U.S.:
Percentage of foreign born residents:
| Here: | 66.5% |
| Ambler: | 73.0% |
Percentage of people born in another U.S. state:
| Hideaway Hills: | 22.6% |
| Ambler: | 16.6% |
Percentage of native residents but born outside the U.S.:
| Here: | 0.6% |
| borough: | 0.5% |
Percentage of foreign born residents:
| Here: | 10.3% |
| Ambler: | 9.9% |
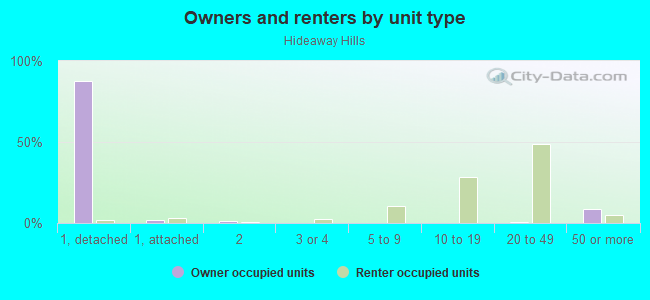
Owner-occupied
Renter-occupied

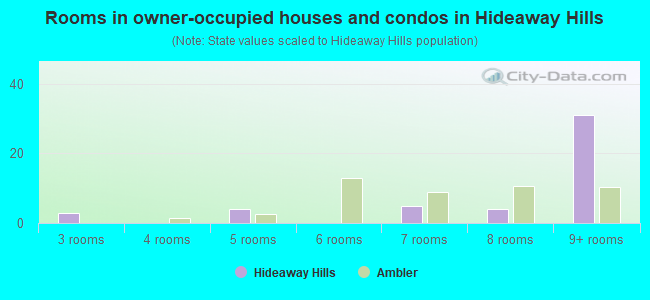
- Rooms in owner-occupied houses and condos in Hideaway Hills
- 01 room
- 02 rooms
- 33 rooms
- 04 rooms
- 45 rooms
- 06 rooms
- 57 rooms
- 48 rooms
- 319+ rooms
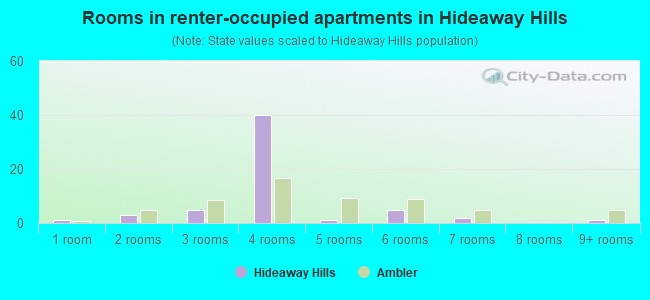
- Rooms in renter-occupied apartments in Hideaway Hills
- 11 room
- 32 rooms
- 53 rooms
- 404 rooms
- 15 rooms
- 56 rooms
- 27 rooms
- 08 rooms
- 19+ rooms
Owner-occupied
Renter-occupied
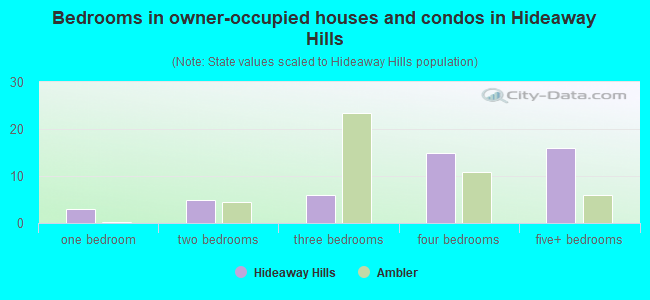
- Bedrooms in owner-occupied houses and condos in Hideaway Hills
- 0no bedroom
- 31 bedroom
- 52 bedrooms
- 63 bedrooms
- 154 bedrooms
- 165+ bedrooms
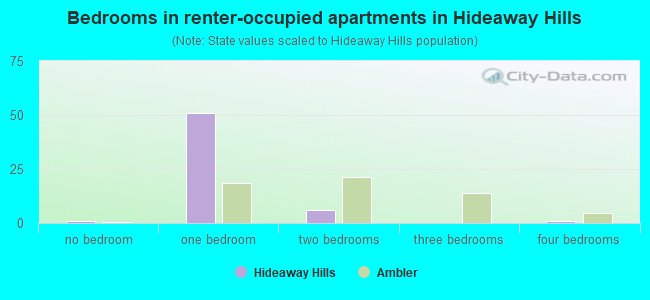
- Bedrooms in renter-occupied apartments in Hideaway Hills
- 1no bedroom
- 511 bedroom
- 62 bedrooms
- 03 bedrooms
- 14 bedrooms
- 05+ bedrooms
Average number of cars or other vehicles available in houses/condos:
Average number of cars or other vehicles available in apartments:
| This neighborhood: | 2.3 |
| Ambler: | 1.9 |
Average number of cars or other vehicles available in apartments:
| Here: | 1.5 |
| borough: | 1.4 |
Percentage of units with a mortgage:
| Hideaway Hills: | 74.5% |
| Ambler: | 72.1% |
Housing prices:
- Average estimated value of detached houses in 2022 (42.2% of all units):
Hideaway Hills: $1,094,904 Pennsylvania: $317,202
- Average estimated value of townhouses or other attached units in 2022 (2.0% of all units):
This neighborhood: $2,074,820 Pennsylvania: $254,369
- Average estimated '22 value of housing units in 5-or-more-unit structures (2.0% of all units):
Hideaway Hills: $139,800 Pennsylvania: $320,068
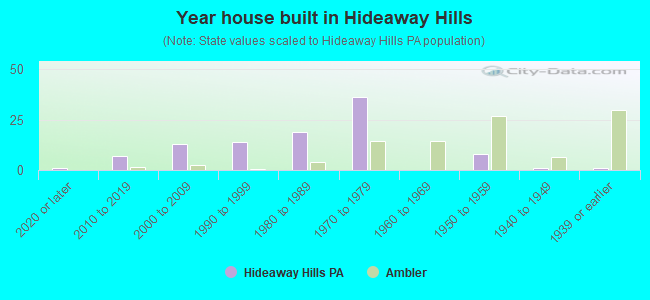
- Year house built in Hideaway Hills
- 12020 or later
- 72010 to 2019
- 132000 to 2009
- 141990 to 1999
- 191980 to 1989
- 361970 to 1979
- 01960 to 1969
- 81950 to 1959
- 11940 to 1949
- 11939 or earlier
City-data.com crime index for borough in 2020 (higher means more crime):
| City: | 16.9 |
| U.S. average: | 219.5 |
Travel time to work (commute)
![Travel time to work (commute)]()
- 1Less than 5 minutes
- 75 to 9 minutes
- 910 to 14 minutes
- 1715 to 19 minutes
- 620 to 24 minutes
- 125 to 29 minutes
- 630 to 34 minutes
- 235 to 39 minutes
- 640 to 44 minutes
- 1345 to 59 minutes
- 760 to 89 minutes
- 390 or more minutes

Means of transportation to work
![Means of transportation to work]()
- 76.6%116Drove a car alone
- 8.6%13Carpooled
- 6.6%10Walked
- 6.6%10Worked at home

Time leaving home to go to work
![Time leaving home to go to work]()
- 112:00 a.m. to 4:59 a.m.
- 45:30 a.m. to 5:59 a.m.
- 46:00 a.m. to 6:29 a.m.
- 86:30 a.m. to 6:59 a.m.
- 67:00 a.m. to 7:29 a.m.
- 177:30 a.m. to 7:59 a.m.
- 148:00 a.m. to 8:29 a.m.
- 18:30 a.m. to 8:59 a.m.
- 99:00 a.m. to 9:59 a.m.
- 410:00 a.m. to 10:59 a.m.
- 111:00 a.m. to 11:59 a.m.
- 312:00 p.m. to 3:59 p.m.
- 34:00 p.m. to 11:59 p.m.

Occupations of males:
- Percentage of males in management occupations (except farmers):
Here: 23.3% borough: 6.8%
- Percentage of males in business and financial operations occupations:
Here: 6.6% borough: 8.8%
- Percentage of males in computer and mathematical occupations:
Here: 10.9% borough: 11.0%
- Percentage of males in architecture and engineering occupations:
Here: 3.3% borough: 2.5%
- Percentage of males in life, physical, and social science occupations:
Here: 13.0% borough: 0.5%
- Percentage of males in education, training, and library occupations:
Here: 4.3% borough: 2.0%
- Percentage of males in healthcare practitioners and technical occupations:
Here: 9.6% borough: 1.5%
- Percentage of males in service occupations:
Here: 12.6% borough: 16.7%
- Percentage of males in sales and office occupations:
Here: 11.6% borough: 19.0%
- Percentage of males in production occupations:
Here: 4.8% borough: 13.8%
- Percentage of males in transportation occupations:
Here: 4.6% borough: 0.6%
- Percentage of males in material moving occupations:
Here: 2.1% borough: 2.3%
Occupations of females:
- Percentage of females in management occupations (except farmers):
Here: 12.2% borough: 14.5%
- Percentage of females in business and financial operations occupations:
Here: 17.0% borough: 8.3%
- Percentage of females in computer and mathematical occupations:
Here: 1.2% borough: 1.2%
- Percentage of females in legal occupations:
Here: 1.8% borough: 2.3%
- Percentage of females in education, training, and library occupations:
Here: 23.9% borough: 16.0%
- Percentage of females in arts, design, entertainment, sports, and media occupations:
Here: 3.8% borough: 7.1%
- Percentage of females in healthcare practitioners and technical occupations:
Here: 6.7% borough: 13.1%
- Percentage of females in service occupations:
Here: 1.5% borough: 11.1%
- Percentage of females in sales and office occupations:
Here: 34.2% borough: 18.5%
- Percentage of females in production occupations:
Here: 4.6% borough: 1.0%
- Percentage of females in transportation occupations:
Here: 1.3% borough: 0.0%
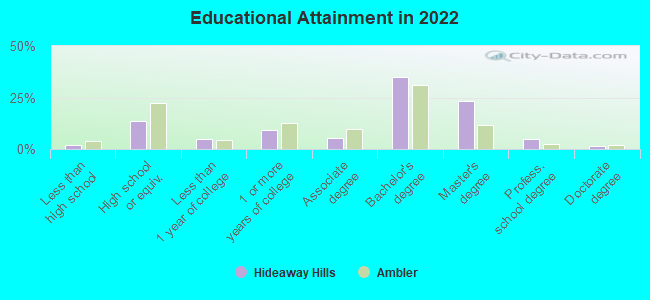
Education in this neighborhood (subdivision or community):
- Percentage of people 3 years and older in K-12 schools:
Hideaway Hills: 14.8% Ambler: 17.9%
- Percentage of people 3 years and older in undergraduate colleges:
Hideaway Hills: 5.9% Ambler: 5.7%
- Percentage of people 3 years and older in grad. or professional schools:
Hideaway Hills: 3.3% Ambler: 2.1%
- Percentage of students K-12 enrolled in private schools:
Hideaway Hills: 27.5% Ambler: 19.1%
Percentage of population below poverty level:
| Hideaway Hills: | 1.9% |
| Ambler: | 8.1% |
Median year owner moved in (as recorded in 2022):
Median year renter moved in (as recorded in 2022):
| Hideaway Hills: | 2005 |
| Ambler: | 2005 |
Median year renter moved in (as recorded in 2022):
| Hideaway Hills: | 2019 |
| Ambler: | 2016 |
Percentage of married-couple families with both working:
| Hideaway Hills: | 75.7% |
| Ambler: | 88.5% |
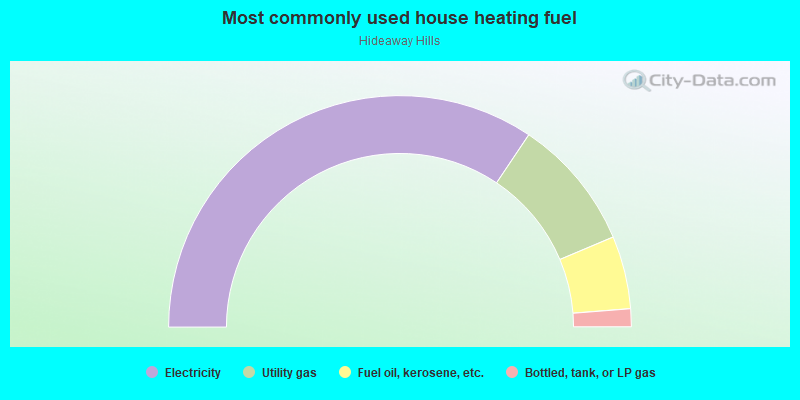
- 68.8%Electricity
- 18.5%Utility gas
- 10.2%Fuel oil, kerosene, etc.
- 2.5%Bottled, tank, or LP gas
Highways in this neighborhood:
W Welsh Rd (State Rte 63)
Length: 0.17 miles
Direction: SE-NW
Address range: 800 to 900
Direction: SE-NW
Address range: 800 to 900
Roads and streets:
Marietta Dr
Length: 0.59 miles
Directions: E-W, N-S, SE-NW, SW-NE
Address range: 700 to 1299
Directions: E-W, N-S, SE-NW, SW-NE
Address range: 700 to 1299
Lois Rd
Length: 0.36 miles
Directions: N-S, SE-NW, SW-NE
Address range: 1200 to 1299
Directions: N-S, SE-NW, SW-NE
Address range: 1200 to 1299
Joseph Rd
Length: 0.29 miles
Direction: SE-NW
Address range: 1200 to 1299
Direction: SE-NW
Address range: 1200 to 1299
McKean Rd
Length: 0.20 miles
Direction: SW-NE
Address range: 1610 to 1663
Direction: SW-NE
Address range: 1610 to 1663