Hoagland Masterson neighborhood in Fort Wayne, Indiana (IN), 46802 detailed profile
Settings
X


Business Search - 14 Million verified businesses
Area: 0.172 square miles
Population: 939
Population density:
| Hoagland Masterson: | 5,454 people per square mile |
| Fort Wayne: | 3,387 people per square mile |

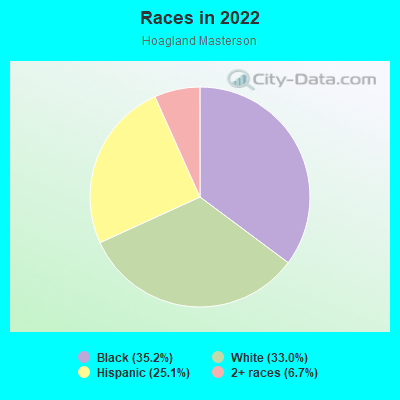
- 33035.2%Black
- 31033.0%White
- 23525.1%Hispanic or Latino
- 636.7%Two or more races
Median household income in 2022:
| Hoagland Masterson: | $38,688 |
| Fort Wayne: | $58,439 |
Distribution of median household income
![Distribution of median household income]()
- 28Less than $10,000
- 92$10,000 to $19,999
- 43$20,000 to $29,999
- 105$30,000 to $39,999
- 49$40,000 to $49,999
- 75$50,000 to $59,999
- 32$60,000 to $74,999
- 35$75,000 to $99,999
- 7$100,000 to $124,999
- 64$125,000 to $149,999
- 33$150,000 to $199,999

Distribution of owner-occupied house/condo value
![Distribution of owner-occupied house/condo value]()
- 77Less than $50,000
- 173$50,000 to $99,999
- 44$100,000 to $149,999
- 85$150,000 to $199,999
- 25$200,000 to $249,999
- 9$250,000 to $299,999

Distribution of rent paid by renters
![Distribution of rent paid by renters]()
- 5Less than $100
- 12$300 to $399
- 178$400 to $499
- 26$500 to $599
- 33$600 to $699
- 58$700 to $799
- 15$800 to $899
- 3$900 to $999

Median rent in 2022:
| Hoagland Masterson: | $510 |
| Fort Wayne: | $761 |
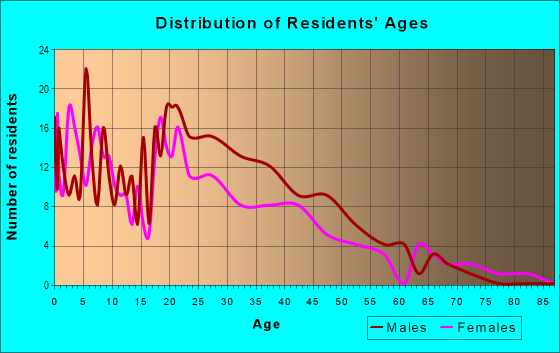
| Males: | 432 |
| Females: | 506 |
Males:
| This neighborhood: | 29.0 years |
| Whole city: | 34.6 years |
| This neighborhood: | 34.9 years |
| Whole city: | 36.5 years |
Average household size:
| Hoagland Masterson: | 2.2 people |
| Fort Wayne: | 2.4 people |
Percentage of family households:
| Hoagland Masterson: | 34.2% |
| Fort Wayne: | 43.5% |
| Here: | 24.1% |
| Fort Wayne: | 41.1% |
Percentage of married-couple families with children (among all households):
| Hoagland Masterson: | 22.1% |
| Fort Wayne: | 26.8% |
Percentage of single-mother households (among all households):
| Hoagland Masterson: | 19.5% |
| Fort Wayne: | 12.2% |
Percentage of never married males 15 years old and over:
Percentage of never married females 15 years old and over:
| Hoagland Masterson: | 24.9% |
| Fort Wayne: | 18.5% |
Percentage of never married females 15 years old and over:
| Hoagland Masterson: | 31.8% |
| city: | 18.1% |
Percentage of people that speak English not well or not at all:
| Hoagland Masterson: | 3.1% |
| Fort Wayne: | 2.8% |
Percentage of people born in this state:
Percentage of people born in another U.S. state:
Percentage of native residents but born outside the U.S.:
Percentage of foreign born residents:
| Here: | 61.0% |
| Fort Wayne: | 63.3% |
Percentage of people born in another U.S. state:
| Hoagland Masterson: | 30.7% |
| Fort Wayne: | 25.5% |
Percentage of native residents but born outside the U.S.:
| Here: | 1.1% |
| city: | 1.3% |
Percentage of foreign born residents:
| Here: | 7.2% |
| Fort Wayne: | 9.9% |
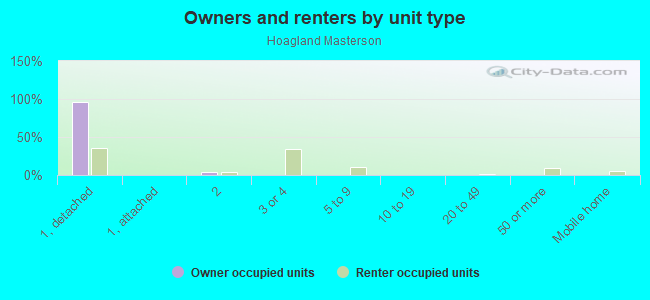
Owner-occupied
Renter-occupied

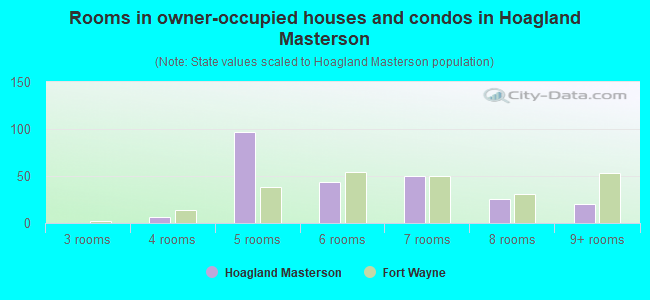
- Rooms in owner-occupied houses and condos in Hoagland Masterson
- 01 room
- 02 rooms
- 03 rooms
- 64 rooms
- 975 rooms
- 446 rooms
- 507 rooms
- 268 rooms
- 209+ rooms
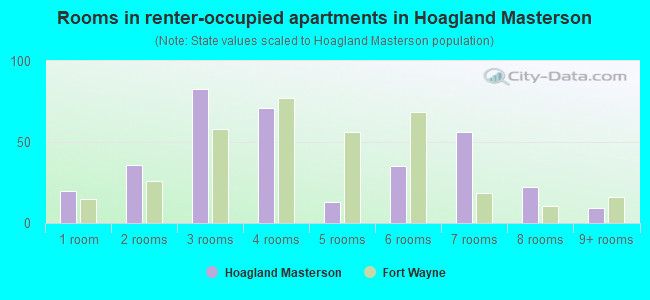
- Rooms in renter-occupied apartments in Hoagland Masterson
- 201 room
- 362 rooms
- 833 rooms
- 714 rooms
- 135 rooms
- 356 rooms
- 567 rooms
- 228 rooms
- 99+ rooms
Owner-occupied
Renter-occupied
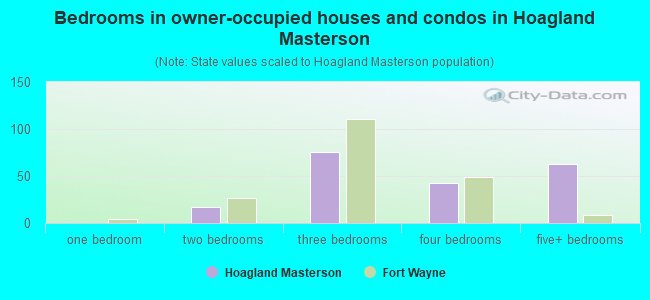
- Bedrooms in owner-occupied houses and condos in Hoagland Masterson
- 0no bedroom
- 01 bedroom
- 172 bedrooms
- 763 bedrooms
- 434 bedrooms
- 635+ bedrooms
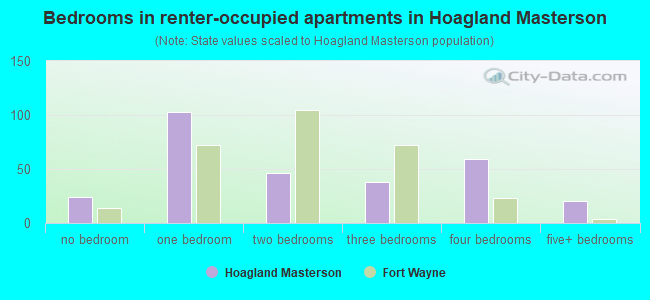
- Bedrooms in renter-occupied apartments in Hoagland Masterson
- 24no bedroom
- 1031 bedroom
- 462 bedrooms
- 383 bedrooms
- 594 bedrooms
- 205+ bedrooms
Average number of cars or other vehicles available in houses/condos:
Average number of cars or other vehicles available in apartments:
| This neighborhood: | 1.8 |
| Fort Wayne: | 2.0 |
Average number of cars or other vehicles available in apartments:
| Here: | 1.1 |
| city: | 1.3 |
Percentage of units with a mortgage:
| Hoagland Masterson: | 36.9% |
| Fort Wayne: | 62.9% |
Average estimated value of detached houses in 2022 (56.0% of all units):
| Hoagland Masterson: | $108,961 |
| Indiana: | $257,916 |
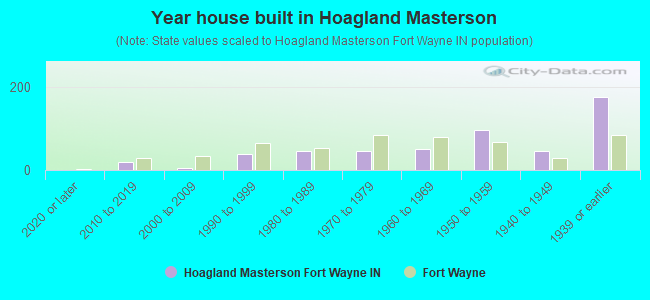
- Year house built in Hoagland Masterson
- 02020 or later
- 202010 to 2019
- 42000 to 2009
- 381990 to 1999
- 471980 to 1989
- 471970 to 1979
- 521960 to 1969
- 961950 to 1959
- 461940 to 1949
- 1761939 or earlier
City-data.com crime index for city in 2020 (higher means more crime):
| City: | 243.3 |
| U.S. average: | 219.5 |
Travel time to work (commute)
![Travel time to work (commute)]()
- 27Less than 5 minutes
- 565 to 9 minutes
- 4110 to 14 minutes
- 5915 to 19 minutes
- 4820 to 24 minutes
- 3325 to 29 minutes
- 1430 to 34 minutes
- 1235 to 39 minutes
- 1240 to 44 minutes
- 4245 to 59 minutes
- 460 to 89 minutes

Means of transportation to work
![Means of transportation to work]()
- 70.3%330Drove a car alone
- 18.5%87Carpooled
- 10.0%47Bus
- 5.5%26Bicycle
- 2.3%11Walked
- 2.8%13Worked at home

Time leaving home to go to work
![Time leaving home to go to work]()
- 3112:00 a.m. to 4:59 a.m.
- 55:00 a.m. to 5:29 a.m.
- 165:30 a.m. to 5:59 a.m.
- 126:00 a.m. to 6:29 a.m.
- 476:30 a.m. to 6:59 a.m.
- 267:00 a.m. to 7:29 a.m.
- 297:30 a.m. to 7:59 a.m.
- 28:00 a.m. to 8:29 a.m.
- 368:30 a.m. to 8:59 a.m.
- 399:00 a.m. to 9:59 a.m.
- 110:00 a.m. to 10:59 a.m.
- 1111:00 a.m. to 11:59 a.m.
- 5612:00 p.m. to 3:59 p.m.
- 124:00 p.m. to 11:59 p.m.

Occupations of males:
- Percentage of males in management occupations (except farmers):
Here: 2.5% city: 9.3%
- Percentage of males in architecture and engineering occupations:
Here: 2.7% city: 3.4%
- Percentage of males in community and social services occupations:
Here: 1.0% city: 1.8%
- Percentage of males in arts, design, entertainment, sports, and media occupations:
Here: 2.6% city: 1.6%
- Percentage of males in service occupations:
Here: 29.1% city: 12.5%
- Percentage of males in sales and office occupations:
Here: 6.3% city: 16.0%
- Percentage of males in construction, extraction, and maintenance occupations:
Here: 11.0% city: 6.6%
- Percentage of males in production occupations:
Here: 8.2% city: 15.0%
- Percentage of males in material moving occupations:
Here: 35.6% city: 8.5%
Occupations of females:
- Percentage of females in community and social services occupations:
Here: 1.9% city: 2.8%
- Percentage of females in healthcare practitioners and technical occupations:
Here: 1.9% city: 10.3%
- Percentage of females in service occupations:
Here: 47.7% city: 21.5%
- Percentage of females in sales and office occupations:
Here: 10.0% city: 26.3%
- Percentage of females in production occupations:
Here: 27.5% city: 8.4%
- Percentage of females in transportation occupations:
Here: 10.9% city: 1.2%
- Percentage of females in material moving occupations:
Here: 4.4% city: 3.5%
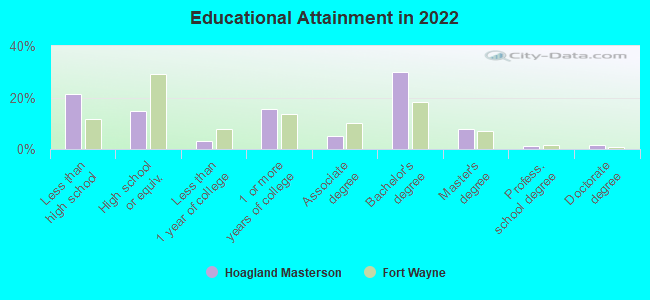
Education in this neighborhood (subdivision or community):
- Percentage of people 3 years and older in K-12 schools:
Hoagland Masterson: 19.8% Fort Wayne: 17.8%
- Percentage of people 3 years and older in undergraduate colleges:
Hoagland Masterson: 10.7% Fort Wayne: 4.6%
- Percentage of people 3 years and older in grad. or professional schools:
Hoagland Masterson: 1.1% Fort Wayne: 1.4%
- Percentage of students K-12 enrolled in private schools:
Hoagland Masterson: 5.7% Fort Wayne: 22.8%
Percentage of population below poverty level:
| Hoagland Masterson: | 28.1% |
| Fort Wayne: | 14.0% |
Median year owner moved in (as recorded in 2022):
Median year renter moved in (as recorded in 2022):
| Hoagland Masterson: | 2007 |
| Fort Wayne: | 2010 |
Median year renter moved in (as recorded in 2022):
| Hoagland Masterson: | 2017 |
| Fort Wayne: | 2020 |
Percentage of married-couple families with both working:
| Hoagland Masterson: | 184.4% |
| Fort Wayne: | 62.3% |
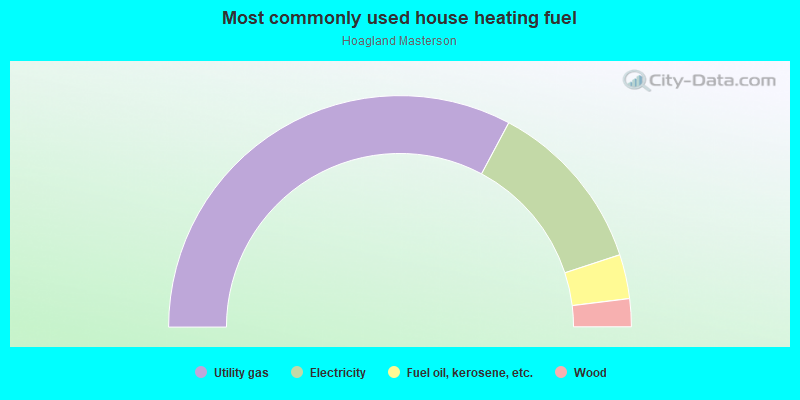
- 65.6%Utility gas
- 24.3%Electricity
- 6.2%Fuel oil, kerosene, etc.
- 3.9%Wood
Roads and streets:
S Harrison St
Length: 0.47 miles
Direction: N-S
Address range: 1600 to 2299
Direction: N-S
Address range: 1600 to 2299
Hoagland Ave
Length: 0.42 miles
Directions: N-S, SE-NW, SW-NE
Address range: 1700 to 2299
Directions: N-S, SE-NW, SW-NE
Address range: 1700 to 2299
W Williams St
Length: 0.41 miles
Direction: E-W
Address range: 100 to 425
Direction: E-W
Address range: 100 to 425
S Calhoun St
Length: 0.40 miles
Direction: N-S
Address range: 1700 to 2299
Direction: N-S
Address range: 1700 to 2299
Webster St
Length: 0.40 miles
Direction: N-S
Address range: 1700 to 2299
Direction: N-S
Address range: 1700 to 2299
W Masterson Ave
Length: 0.40 miles
Directions: E-W, N-S
Address range: 100 to 424
Directions: E-W, N-S
Address range: 100 to 424
W Creighton Ave
Length: 0.33 miles
Direction: E-W
Address range: 100 to 399
Direction: E-W
Address range: 100 to 399
W Butler St
Length: 0.33 miles
Direction: E-W
Address range: 100 to 399
Direction: E-W
Address range: 100 to 399
W Dewald St
Length: 0.31 miles
Direction: E-W
Address range: 100 to 399
Direction: E-W
Address range: 100 to 399
Melita St
Length: 0.24 miles
Direction: E-W
Address range: 200 to 399
Direction: E-W
Address range: 200 to 399
W Wallace St
Length: 0.18 miles
Direction: E-W
Address range: 100 to 299
Direction: E-W
Address range: 100 to 299
Brandriff St
Length: 0.14 miles
Direction: E-W
Address range: 300 to 399
Direction: E-W
Address range: 300 to 399
Prince St
Length: 0.14 miles
Directions: N-S, SE-NW, SW-NE
Address range: 1800 to 1999
Directions: N-S, SE-NW, SW-NE
Address range: 1800 to 1999
Bass St
Length: 0.08 miles
Direction: E-W
Address range: 400 to 424
Direction: E-W
Address range: 400 to 424
Cromwell Ct
Length: 0.04 miles
Direction: N-S
Address range: 1900 to 1999
Direction: N-S
Address range: 1900 to 1999