Huntington Commons neighborhood in Naperville, Illinois (IL), 60540 detailed profile
Settings
X


Business Search - 14 Million verified businesses
Area: 0.076 square miles
Population: 355
Population density:
| Huntington Commons: | 4,664 people per square mile |
| Naperville: | 4,198 people per square mile |

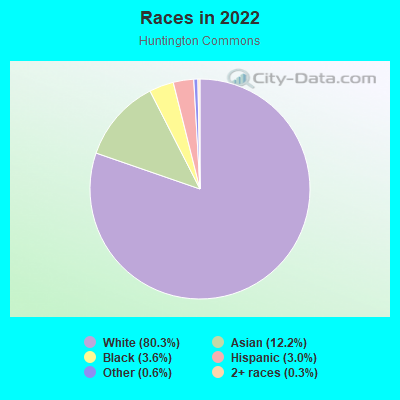
- 29080.3%White
- 4412.2%Asian
- 133.6%Black
- 113.0%Hispanic or Latino
- 20.6%Some other race
- 10.3%Two or more races

Median household income in 2022:
| Huntington Commons: | $197,481 |
| Naperville: | $140,831 |
Distribution of median household income
![Distribution of median household income]()
- 22Less than $10,000
- 10$10,000 to $19,999
- 10$30,000 to $39,999
- 3$40,000 to $49,999
- 3$50,000 to $59,999
- 4$60,000 to $74,999
- 11$75,000 to $99,999
- 16$100,000 to $124,999
- 4$125,000 to $149,999
- 29$150,000 to $199,999
- 51$200,000 or more

Distribution of owner-occupied house/condo value
![Distribution of owner-occupied house/condo value]()
- 2Less than $50,000
- 3$50,000 to $99,999
- 31$200,000 to $249,999
- 7$250,000 to $299,999
- 18$300,000 to $399,999
- 20$400,000 to $499,999
- 58$500,000 to $749,999
- 4$750,000 to $999,999
- 5$1,000,000 or more

Distribution of rent paid by renters
![Distribution of rent paid by renters]()
- 10$200 to $299
- 13$1,000 to $1,249
- 4$1,250 to $1,499
- 10$2,000 or more

| Males: | 178 |
| Females: | 176 |
Males:
| This neighborhood: | 43.9 years |
| Whole city: | 39.6 years |
| This neighborhood: | 50.4 years |
| Whole city: | 42.4 years |
Average household size:
| Huntington Commons: | 2.9 people |
| Naperville: | 2.7 people |
Percentage of family households:
| Huntington Commons: | 54.9% |
| Naperville: | 57.7% |
| Here: | 65.9% |
| Naperville: | 66.6% |
Percentage of married-couple families with children (among all households):
| Huntington Commons: | 35.3% |
| Naperville: | 31.4% |
Percentage of single-mother households (among all households):
| Huntington Commons: | 2.7% |
| Naperville: | 4.5% |
Percentage of never married males 15 years old and over:
Percentage of never married females 15 years old and over:
| Huntington Commons: | 15.1% |
| Naperville: | 14.0% |
Percentage of never married females 15 years old and over:
| Huntington Commons: | 11.4% |
| city: | 12.1% |
Percentage of people that speak English not well or not at all:
| Huntington Commons: | 0.9% |
| Naperville: | 2.5% |
Percentage of people born in this state:
Percentage of people born in another U.S. state:
Percentage of native residents but born outside the U.S.:
Percentage of foreign born residents:
| Here: | 52.4% |
| Naperville: | 53.1% |
Percentage of people born in another U.S. state:
| Huntington Commons: | 27.8% |
| Naperville: | 23.5% |
Percentage of native residents but born outside the U.S.:
| Here: | 1.3% |
| city: | 1.4% |
Percentage of foreign born residents:
| Here: | 18.5% |
| Naperville: | 22.0% |
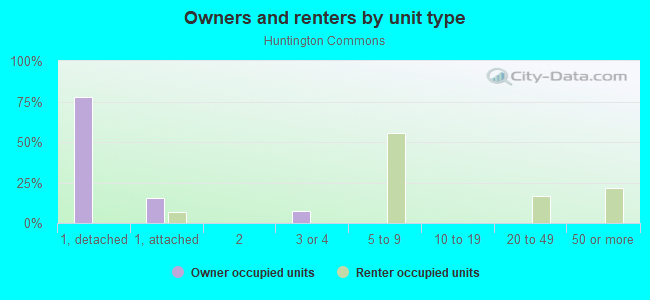
Owner-occupied
Renter-occupied

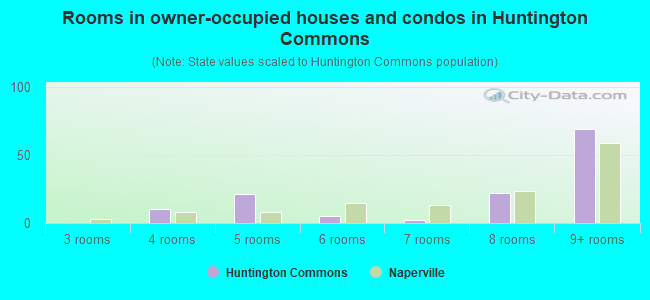
- Rooms in owner-occupied houses and condos in Huntington Commons
- 01 room
- 02 rooms
- 03 rooms
- 104 rooms
- 215 rooms
- 56 rooms
- 27 rooms
- 228 rooms
- 699+ rooms
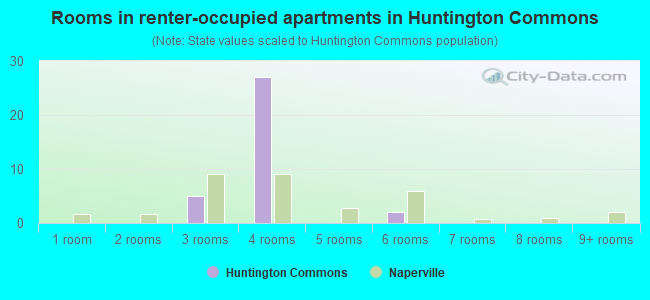
- Rooms in renter-occupied apartments in Huntington Commons
- 01 room
- 02 rooms
- 53 rooms
- 274 rooms
- 05 rooms
- 26 rooms
- 07 rooms
- 08 rooms
- 09+ rooms
Owner-occupied
Renter-occupied
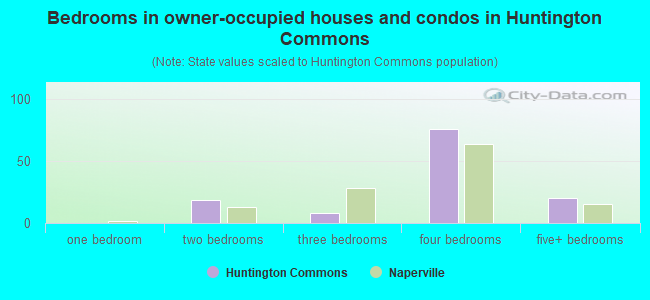
- Bedrooms in owner-occupied houses and condos in Huntington Commons
- 0no bedroom
- 01 bedroom
- 192 bedrooms
- 83 bedrooms
- 764 bedrooms
- 205+ bedrooms
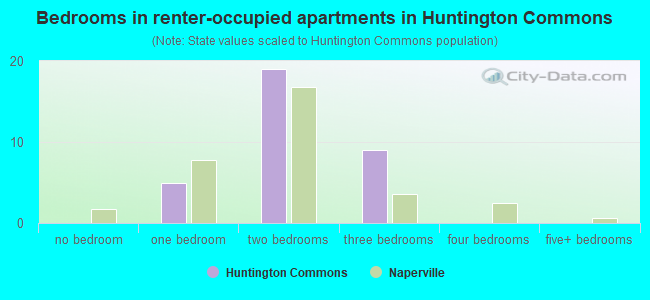
- Bedrooms in renter-occupied apartments in Huntington Commons
- 0no bedroom
- 51 bedroom
- 192 bedrooms
- 93 bedrooms
- 04 bedrooms
- 05+ bedrooms
Average number of cars or other vehicles available in houses/condos:
Average number of cars or other vehicles available in apartments:
| This neighborhood: | 2.2 |
| Naperville: | 2.1 |
Average number of cars or other vehicles available in apartments:
| Here: | |
| city: |
Percentage of units with a mortgage:
| Huntington Commons: | 59.4% |
| Naperville: | 62.5% |
Average estimated value of detached houses in 2022 (73.3% of all units):
| Huntington Commons: | $599,067 |
| Naperville: | $552,530 |
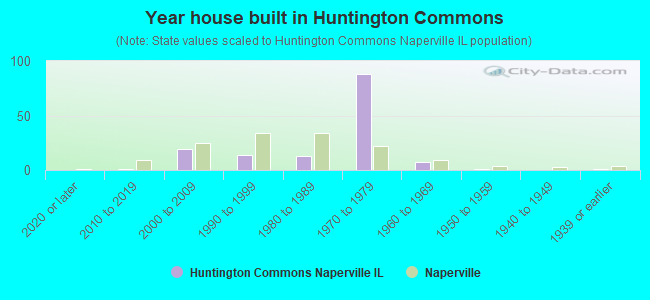
- Year house built in Huntington Commons
- 02020 or later
- 12010 to 2019
- 192000 to 2009
- 141990 to 1999
- 131980 to 1989
- 881970 to 1979
- 71960 to 1969
- 11950 to 1959
- 01940 to 1949
- 11939 or earlier
City-data.com crime index for city in 2020 (higher means more crime):
| City: | 122.2 |
| U.S. average: | 219.5 |
Travel time to work (commute)
![Travel time to work (commute)]()
- 3Less than 5 minutes
- 125 to 9 minutes
- 1110 to 14 minutes
- 1415 to 19 minutes
- 1620 to 24 minutes
- 925 to 29 minutes
- 830 to 34 minutes
- 935 to 39 minutes
- 740 to 44 minutes
- 1645 to 59 minutes
- 1760 to 89 minutes
- 390 or more minutes

Means of transportation to work
![Means of transportation to work]()
- 64.7%108Drove a car alone
- 2.4%4Carpooled
- 4.8%8Subway or elevated rail
- 9.6%16Long-distance train or commuter rail
- 0.6%1Light rail, streetcar or trolley
- 3.6%6Other means
- 20.4%34Worked at home

Time leaving home to go to work
![Time leaving home to go to work]()
- 212:00 a.m. to 4:59 a.m.
- 45:30 a.m. to 5:59 a.m.
- 276:00 a.m. to 6:29 a.m.
- 176:30 a.m. to 6:59 a.m.
- 207:00 a.m. to 7:29 a.m.
- 137:30 a.m. to 7:59 a.m.
- 168:00 a.m. to 8:29 a.m.
- 48:30 a.m. to 8:59 a.m.
- 119:00 a.m. to 9:59 a.m.
- 610:00 a.m. to 10:59 a.m.
- 612:00 p.m. to 3:59 p.m.
- 54:00 p.m. to 11:59 p.m.

Occupations of males:
- Percentage of males in management occupations (except farmers):
Here: 16.7% city: 21.9%
- Percentage of males in business and financial operations occupations:
Here: 16.5% city: 11.0%
- Percentage of males in computer and mathematical occupations:
Here: 5.1% city: 12.3%
- Percentage of males in architecture and engineering occupations:
Here: 8.9% city: 6.1%
- Percentage of males in education, training, and library occupations:
Here: 6.1% city: 3.6%
- Percentage of males in healthcare practitioners and technical occupations:
Here: 3.5% city: 3.6%
- Percentage of males in service occupations:
Here: 7.0% city: 6.2%
- Percentage of males in sales and office occupations:
Here: 28.7% city: 16.9%
- Percentage of males in construction, extraction, and maintenance occupations:
Here: 3.5% city: 2.1%
- Percentage of males in production occupations:
Here: 1.3% city: 2.5%
Occupations of females:
- Percentage of females in management occupations (except farmers):
Here: 22.3% city: 13.7%
- Percentage of females in business and financial operations occupations:
Here: 3.5% city: 10.1%
- Percentage of females in computer and mathematical occupations:
Here: 1.3% city: 4.5%
- Percentage of females in community and social services occupations:
Here: 4.9% city: 2.5%
- Percentage of females in education, training, and library occupations:
Here: 17.4% city: 11.8%
- Percentage of females in arts, design, entertainment, sports, and media occupations:
Here: 1.9% city: 2.6%
- Percentage of females in healthcare practitioners and technical occupations:
Here: 18.9% city: 11.4%
- Percentage of females in service occupations:
Here: 7.4% city: 12.4%
- Percentage of females in sales and office occupations:
Here: 20.4% city: 22.7%
- Percentage of females in transportation occupations:
Here: 4.4% city: 1.2%
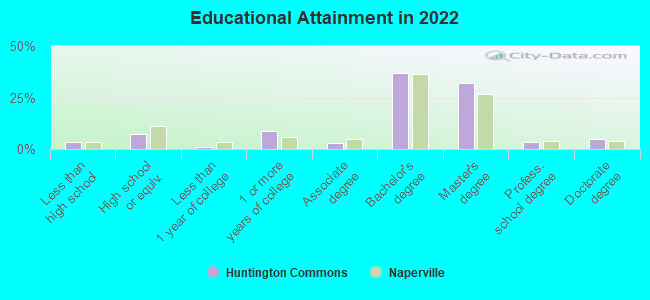
Education in this neighborhood (subdivision or community):
- Percentage of people 3 years and older in K-12 schools:
Huntington Commons: 15.7% Naperville: 19.5%
- Percentage of people 3 years and older in undergraduate colleges:
Huntington Commons: 2.6% Naperville: 3.6%
- Percentage of people 3 years and older in grad. or professional schools:
Huntington Commons: 3.7% Naperville: 1.7%
- Percentage of students K-12 enrolled in private schools:
Huntington Commons: 65.5% Naperville: 14.4%
Percentage of population below poverty level:
| Huntington Commons: | 2.5% |
| Naperville: | 4.1% |
Median year owner moved in (as recorded in 2022):
| Huntington Commons: | 2004 |
| Naperville: | 2010 |
Percentage of married-couple families with both working:
| Huntington Commons: | 93.0% |
| Naperville: | 73.0% |
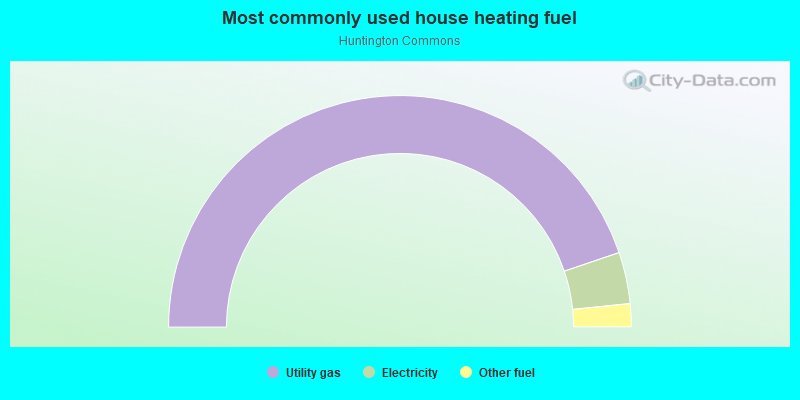
- 89.5%Utility gas
- 7.2%Electricity
- 3.2%Other fuel
Roads and streets:
Westmoreland Ln
Length: 0.24 miles
Direction: N-S
Address range: 17 to 215
Direction: N-S
Address range: 17 to 215
Devon Ln
Length: 0.18 miles
Directions: N-S, SW-NE
Address range: 1 to 299
Directions: N-S, SW-NE
Address range: 1 to 299
Sussex Rd
Length: 0.12 miles
Directions: E-W, SW-NE
Address range: 1300 to 1399
Directions: E-W, SW-NE
Address range: 1300 to 1399
Sussex Ct
Length: 0.06 miles
Direction: SE-NW
Address range: 1 to 99
Direction: SE-NW
Address range: 1 to 99
Jane Ct
Length: 0.05 miles
Direction: E-W
Address range: 1345 to 1399
Direction: E-W
Address range: 1345 to 1399
Westmoreland Ct
Length: 0.04 miles
Direction: E-W
Address range: 1300 to 1399
Direction: E-W
Address range: 1300 to 1399