Hyde Park neighborhood in San Jose, California (CA), 95112 detailed profile
Settings
X


Business Search - 14 Million verified businesses
Area: 0.154 square miles
Population: 430
Population density:
| Hyde Park: | 2,790 people per square mile |
| San Jose: | 5,554 people per square mile |

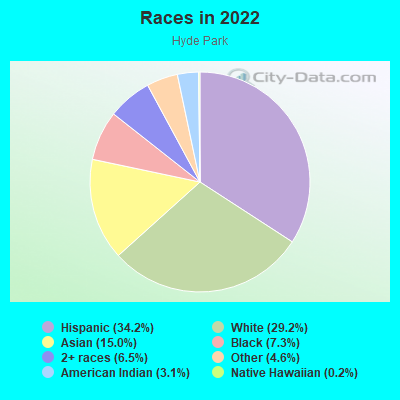
- 16434.2%Hispanic or Latino
- 14029.2%White
- 7215.0%Asian
- 357.3%Black
- 316.5%Two or more races
- 224.6%Some other race
- 153.1%American Indian
- 10.2%Native Hawaiian and Other
Pacific Islander
Distribution of median household income
![Distribution of median household income]()
- 12Less than $10,000
- 15$10,000 to $19,999
- 20$20,000 to $29,999
- 20$30,000 to $39,999
- 16$40,000 to $49,999
- 22$50,000 to $59,999
- 22$60,000 to $74,999
- 47$75,000 to $99,999
- 39$100,000 to $124,999
- 17$125,000 to $149,999
- 27$150,000 to $199,999
- 90$200,000 or more

Distribution of owner-occupied house/condo value
![Distribution of owner-occupied house/condo value]()
- 21$100,000 to $149,999
- 64$500,000 to $749,999
- 17$750,000 to $999,999
- 76$1,000,000 or more

Distribution of rent paid by renters
![Distribution of rent paid by renters]()
- 6Less than $100
- 35$300 to $399
- 3$400 to $499
- 8$500 to $599
- 21$600 to $699
- 11$800 to $899
- 27$900 to $999
- 12$1,000 to $1,249
- 10$1,250 to $1,499
- 26$1,500 to $1,999
- 156$2,000 or more

Median rent in 2022:
| Hyde Park: | $2,489 |
| San Jose: | $2,001 |
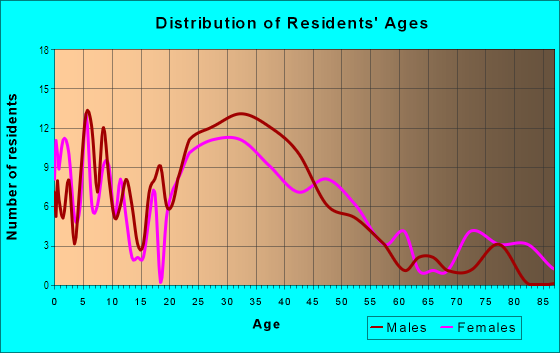
| Males: | 195 |
| Females: | 235 |
Males:
| This neighborhood: | 36.7 years |
| Whole city: | 37.6 years |
| This neighborhood: | 36.4 years |
| Whole city: | 39.1 years |
Average household size:
| Hyde Park: | 11.2 people |
| San Jose: | 2.9 people |
Percentage of family households:
| Hyde Park: | 31.9% |
| San Jose: | 49.9% |
| Here: | 24.4% |
| San Jose: | 53.0% |
Percentage of married-couple families with children (among all households):
| Hyde Park: | 46.3% |
| San Jose: | 25.8% |
Percentage of single-mother households (among all households):
| Hyde Park: | 129.2% |
| San Jose: | 5.2% |
Percentage of never married males 15 years old and over:
Percentage of never married females 15 years old and over:
| Hyde Park: | 17.3% |
| San Jose: | 20.9% |
Percentage of never married females 15 years old and over:
| Hyde Park: | 28.6% |
| city: | 16.7% |
Percentage of people that speak English not well or not at all:
| Hyde Park: | 10.5% |
| San Jose: | 11.4% |
Percentage of people born in this state:
Percentage of people born in another U.S. state:
Percentage of native residents but born outside the U.S.:
Percentage of foreign born residents:
| Here: | 48.3% |
| San Jose: | 46.1% |
Percentage of people born in another U.S. state:
| Hyde Park: | 15.1% |
| San Jose: | 10.4% |
Percentage of native residents but born outside the U.S.:
| Here: | 1.3% |
| city: | 1.7% |
Percentage of foreign born residents:
| Here: | 35.3% |
| San Jose: | 41.8% |
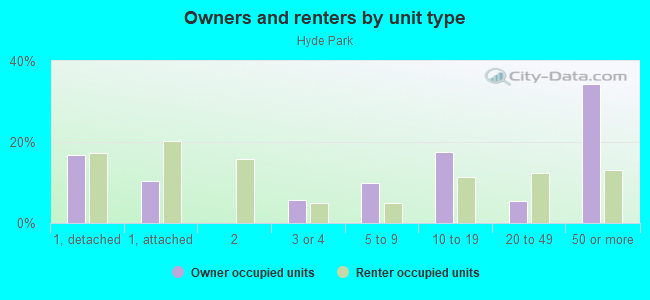
Owner-occupied
Renter-occupied


- Rooms in owner-occupied houses and condos in Hyde Park
- 01 room
- 242 rooms
- 513 rooms
- 754 rooms
- 115 rooms
- 186 rooms
- 27 rooms
- 78 rooms
- 239+ rooms
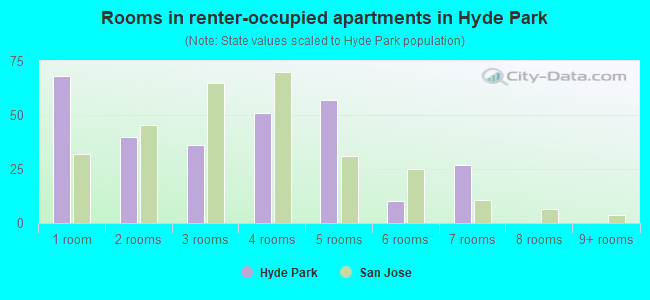
- Rooms in renter-occupied apartments in Hyde Park
- 681 room
- 402 rooms
- 363 rooms
- 514 rooms
- 575 rooms
- 106 rooms
- 277 rooms
- 08 rooms
- 09+ rooms
Owner-occupied
Renter-occupied
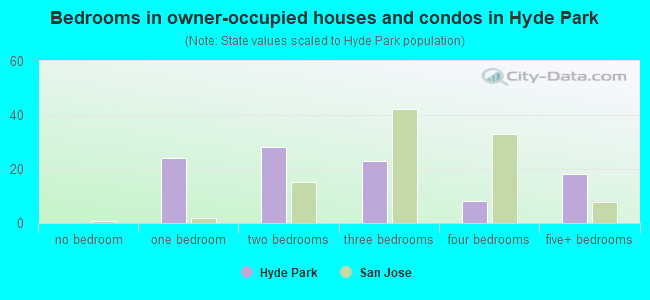
- Bedrooms in owner-occupied houses and condos in Hyde Park
- 0no bedroom
- 241 bedroom
- 282 bedrooms
- 233 bedrooms
- 84 bedrooms
- 185+ bedrooms
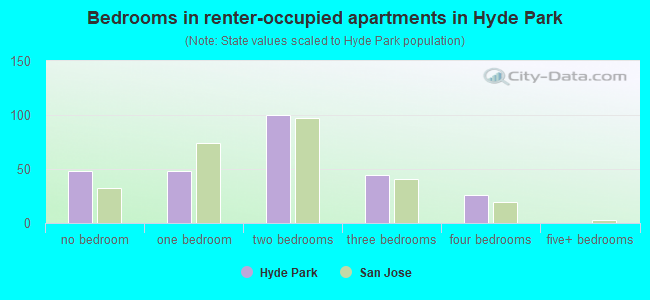
- Bedrooms in renter-occupied apartments in Hyde Park
- 48no bedroom
- 481 bedroom
- 1002 bedrooms
- 443 bedrooms
- 264 bedrooms
- 05+ bedrooms
Average number of cars or other vehicles available in houses/condos:
Average number of cars or other vehicles available in apartments:
| This neighborhood: | 2.8 |
| San Jose: | 2.3 |
Average number of cars or other vehicles available in apartments:
| Here: | 2.4 |
| city: | 1.6 |
Percentage of units with a mortgage:
| Hyde Park: | 74.9% |
| San Jose: | 66.9% |
Housing prices:
- Average estimated value of detached houses in 2022 (35.7% of all units):
Hyde Park: $1,172,502 San Jose: $1,532,815
- Average estimated value of townhouses or other attached units in 2022 (26.1% of all units):
This neighborhood: $3,469,720 city: $1,024,857
- Average estimated '22 value of housing units in 5-or-more-unit structures (14.5% of all units):
Hyde Park: $960,266 San Jose: $791,954

- Year house built in Hyde Park
- 42020 or later
- 292010 to 2019
- 252000 to 2009
- 331990 to 1999
- 791980 to 1989
- 81970 to 1979
- 341960 to 1969
- 411950 to 1959
- 671940 to 1949
- 631939 or earlier
City-data.com crime index for city in 2020 (higher means more crime):
| City: | 268.4 |
| U.S. average: | 219.5 |
Travel time to work (commute)
![Travel time to work (commute)]()
- 5Less than 5 minutes
- 225 to 9 minutes
- 4210 to 14 minutes
- 6715 to 19 minutes
- 4720 to 24 minutes
- 1625 to 29 minutes
- 5530 to 34 minutes
- 1335 to 39 minutes
- 2240 to 44 minutes
- 945 to 59 minutes
- 3660 to 89 minutes
- 590 or more minutes

Means of transportation to work
![Means of transportation to work]()
- 67.4%201Drove a car alone
- 11.7%35Carpooled
- 6.4%19Bus
- 2.7%8Long-distance train or commuter rail
- 1.0%3Light rail, streetcar or trolley
- 4.0%12Taxi
- 4.0%12Motorcycle
- 1.3%4Bicycle
- 7.0%21Walked
- 3.7%11Other means
- 19.4%58Worked at home

Time leaving home to go to work
![Time leaving home to go to work]()
- 2012:00 a.m. to 4:59 a.m.
- 15:00 a.m. to 5:29 a.m.
- 285:30 a.m. to 5:59 a.m.
- 266:00 a.m. to 6:29 a.m.
- 96:30 a.m. to 6:59 a.m.
- 687:00 a.m. to 7:29 a.m.
- 247:30 a.m. to 7:59 a.m.
- 488:00 a.m. to 8:29 a.m.
- 278:30 a.m. to 8:59 a.m.
- 589:00 a.m. to 9:59 a.m.
- 2010:00 a.m. to 10:59 a.m.
- 1011:00 a.m. to 11:59 a.m.
- 612:00 p.m. to 3:59 p.m.
- 114:00 p.m. to 11:59 p.m.

Occupations of males:
- Percentage of males in management occupations (except farmers):
Here: 5.9% city: 13.0%
- Percentage of males in business and financial operations occupations:
Here: 5.3% city: 4.6%
- Percentage of males in computer and mathematical occupations:
Here: 7.0% city: 13.6%
- Percentage of males in architecture and engineering occupations:
Here: 6.6% city: 10.2%
- Percentage of males in life, physical, and social science occupations:
Here: 4.2% city: 1.1%
- Percentage of males in education, training, and library occupations:
Here: 4.2% city: 2.8%
- Percentage of males in arts, design, entertainment, sports, and media occupations:
Here: 4.6% city: 1.8%
- Percentage of males in service occupations:
Here: 27.0% city: 12.7%
- Percentage of males in sales and office occupations:
Here: 16.6% city: 12.8%
- Percentage of males in farming, fishing, and forestry occupations:
Here: 7.4% city: 0.4%
- Percentage of males in construction, extraction, and maintenance occupations:
Here: 9.7% city: 7.8%
- Percentage of males in transportation occupations:
Here: 3.1% city: 3.6%
Occupations of females:
- Percentage of females in management occupations (except farmers):
Here: 11.9% city: 11.0%
- Percentage of females in business and financial operations occupations:
Here: 12.8% city: 8.6%
- Percentage of females in computer and mathematical occupations:
Here: 2.9% city: 5.4%
- Percentage of females in architecture and engineering occupations:
Here: 3.2% city: 2.8%
- Percentage of females in community and social services occupations:
Here: 14.9% city: 1.8%
- Percentage of females in education, training, and library occupations:
Here: 7.5% city: 8.1%
- Percentage of females in healthcare practitioners and technical occupations:
Here: 13.3% city: 6.8%
- Percentage of females in service occupations:
Here: 4.8% city: 21.7%
- Percentage of females in sales and office occupations:
Here: 24.6% city: 22.0%
- Percentage of females in construction, extraction, and maintenance occupations:
Here: 1.6% city: 0.2%
- Percentage of females in production occupations:
Here: 3.0% city: 4.0%
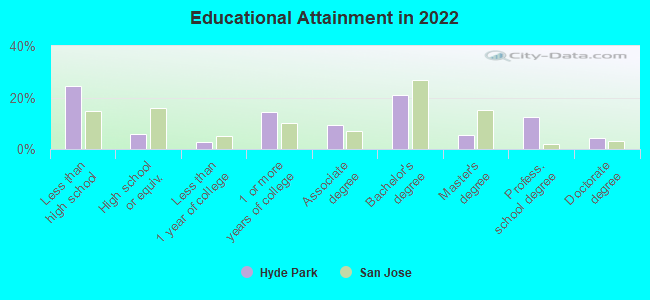
Education in this neighborhood (subdivision or community):
- Percentage of people 3 years and older in K-12 schools:
Hyde Park: 38.6% San Jose: 16.1%
- Percentage of people 3 years and older in undergraduate colleges:
Hyde Park: 9.8% San Jose: 6.5%
- Percentage of people 3 years and older in grad. or professional schools:
Hyde Park: 3.5% San Jose: 2.0%
- Percentage of students K-12 enrolled in private schools:
Hyde Park: 43.0% San Jose: 14.9%
Percentage of population below poverty level:
| Hyde Park: | 9.1% |
| San Jose: | 9.0% |
Median year renter moved in (as recorded in 2022):
| Hyde Park: | 2018 |
| San Jose: | 2020 |
Percentage of married-couple families with both working:
| Hyde Park: | 189.0% |
| San Jose: | 72.5% |

- 49.0%Utility gas
- 46.0%Electricity
- 1.9%No fuel used
- 1.6%Other fuel
- 1.5%Bottled, tank, or LP gas
Roads and streets:
E Hedding St
Length: 0.57 miles
Direction: SW-NE
Address range: 50 to 377
Direction: SW-NE
Address range: 50 to 377
E Younger Ave
Length: 0.41 miles
Direction: SW-NE
Address range: 50 to 1284
Direction: SW-NE
Address range: 50 to 1284
N 3rd St
Length: 0.39 miles
Direction: SE-NW
Address range: 900 to 1199
Direction: SE-NW
Address range: 900 to 1199
N 2nd St
Length: 0.39 miles
Direction: SE-NW
Address range: 900 to 1199
Direction: SE-NW
Address range: 900 to 1199
N 4th St
Length: 0.37 miles
Direction: SE-NW
Address range: 900 to 1152
Direction: SE-NW
Address range: 900 to 1152
N 5th St
Length: 0.28 miles
Direction: SE-NW
Address range: 900 to 1057
Direction: SE-NW
Address range: 900 to 1057
N 6th St
Length: 0.19 miles
Direction: SE-NW
Address range: 900 to 1099
Direction: SE-NW
Address range: 900 to 1099
Burton Ave
Length: 0.16 miles
Direction: SW-NE
Address range: 50 to 199
Direction: SW-NE
Address range: 50 to 199
N 7th St
Length: 0.15 miles
Direction: SE-NW
Address range: 900 to 999
Direction: SE-NW
Address range: 900 to 999