Little Italy neighborhood in Chicago, Illinois (IL), 60607 detailed profile
Settings
X

Business Search - 14 Million verified businesses
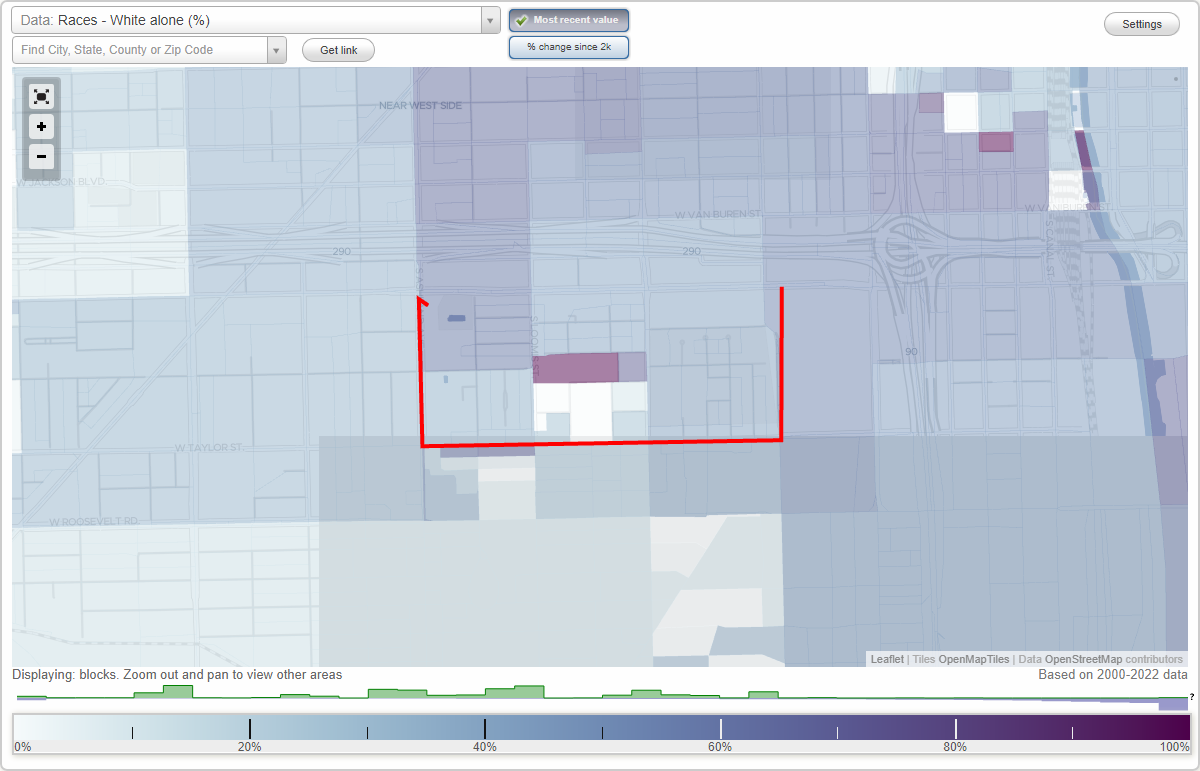
Area: 0.265 square miles
Population: 5,731
Population density:
| Little Italy: | 21,644 people per square mile |
| Chicago: | 11,734 people per square mile |

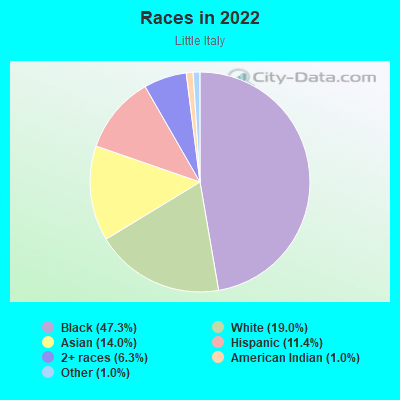
- 2,85147.3%Black
- 1,14419.0%White
- 84114.0%Asian
- 68611.4%Hispanic or Latino
- 3776.3%Two or more races
- 631.0%American Indian
- 601.0%Some other race
Distribution of median household income
![Distribution of median household income]()
- 234Less than $10,000
- 322$10,000 to $19,999
- 936$20,000 to $29,999
- 72$30,000 to $39,999
- 199$40,000 to $49,999
- 378$50,000 to $59,999
- 222$60,000 to $74,999
- 266$75,000 to $99,999
- 216$100,000 to $124,999
- 74$125,000 to $149,999
- 247$150,000 to $199,999
- 258$200,000 or more

Distribution of owner-occupied house/condo value
![Distribution of owner-occupied house/condo value]()
- 33Less than $50,000
- 77$150,000 to $199,999
- 205$200,000 to $249,999
- 215$250,000 to $299,999
- 182$300,000 to $399,999
- 506$400,000 to $499,999
- 95$500,000 to $749,999
- 66$750,000 to $999,999
- 54$1,000,000 or more

Distribution of rent paid by renters
![Distribution of rent paid by renters]()
- 163$100 to $199
- 112$200 to $299
- 159$300 to $399
- 56$400 to $499
- 163$600 to $699
- 322$700 to $799
- 201$900 to $999
- 150$1,000 to $1,249
- 366$1,250 to $1,499
- 273$1,500 to $1,999
- 360$2,000 or more

Median rent in 2022:
| Little Italy: | $1,167 |
| Chicago: | $1,161 |
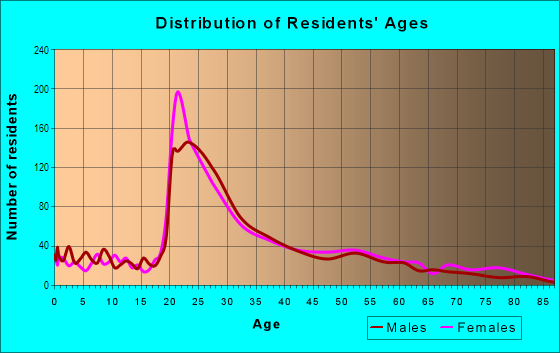
| Males: | 2,351 |
| Females: | 3,380 |
Males:
| This neighborhood: | 27.1 years |
| Whole city: | 35.3 years |
| This neighborhood: | 41.0 years |
| Whole city: | 36.2 years |
Average household size:
| Little Italy: | 2.2 people |
| Chicago: | 2.3 people |
Percentage of family households:
| Little Italy: | 36.0% |
| Chicago: | 36.7% |
| Here: | 19.5% |
| Chicago: | 30.4% |
Percentage of married-couple families with children (among all households):
| Little Italy: | 12.2% |
| Chicago: | 24.1% |
Percentage of single-mother households (among all households):
| Little Italy: | 32.9% |
| Chicago: | 16.0% |
Percentage of never married males 15 years old and over:
Percentage of never married females 15 years old and over:
| Little Italy: | 24.0% |
| Chicago: | 24.5% |
Percentage of never married females 15 years old and over:
| Little Italy: | 34.7% |
| city: | 24.9% |
Percentage of people that speak English not well or not at all:
| Little Italy: | 8.9% |
| Chicago: | 7.1% |
Percentage of people born in this state:
Percentage of people born in another U.S. state:
Percentage of native residents but born outside the U.S.:
Percentage of foreign born residents:
| Here: | 44.9% |
| Chicago: | 58.6% |
Percentage of people born in another U.S. state:
| Little Italy: | 25.4% |
| Chicago: | 18.8% |
Percentage of native residents but born outside the U.S.:
| Here: | 4.7% |
| city: | 2.1% |
Percentage of foreign born residents:
| Here: | 25.0% |
| Chicago: | 20.6% |
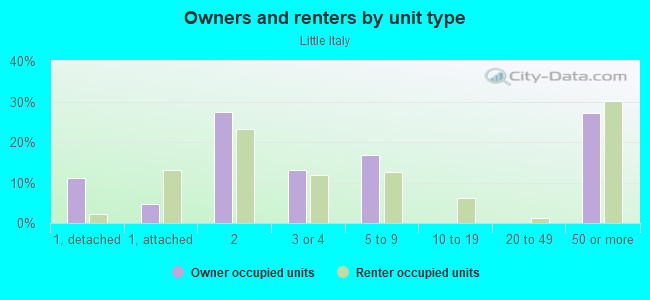
Owner-occupied
Renter-occupied

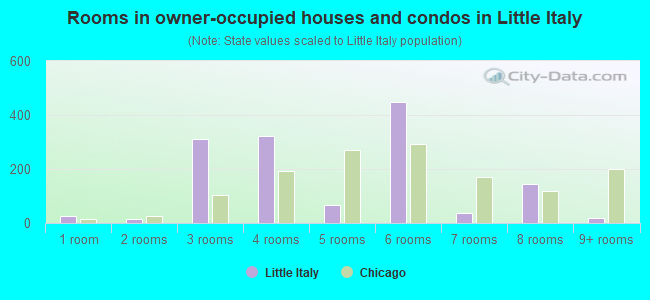
- Rooms in owner-occupied houses and condos in Little Italy
- 271 room
- 132 rooms
- 3113 rooms
- 3214 rooms
- 685 rooms
- 4486 rooms
- 377 rooms
- 1448 rooms
- 189+ rooms
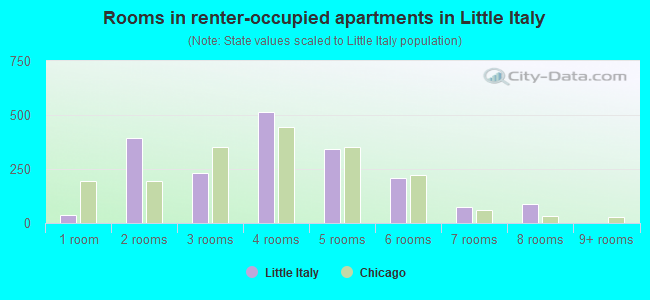
- Rooms in renter-occupied apartments in Little Italy
- 371 room
- 3952 rooms
- 2323 rooms
- 5164 rooms
- 3415 rooms
- 2076 rooms
- 727 rooms
- 868 rooms
- 09+ rooms
Owner-occupied
Renter-occupied
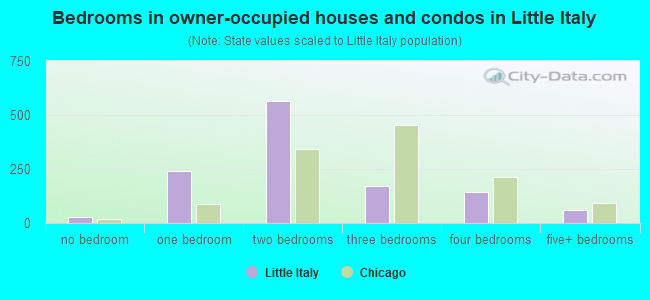
- Bedrooms in owner-occupied houses and condos in Little Italy
- 27no bedroom
- 2421 bedroom
- 5642 bedrooms
- 1693 bedrooms
- 1444 bedrooms
- 595+ bedrooms
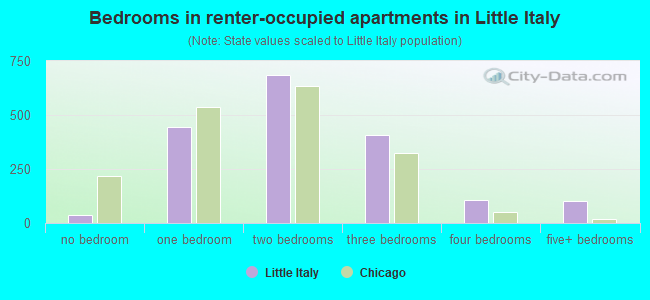
- Bedrooms in renter-occupied apartments in Little Italy
- 37no bedroom
- 4461 bedroom
- 6842 bedrooms
- 4063 bedrooms
- 1054 bedrooms
- 1025+ bedrooms
Average number of cars or other vehicles available in houses/condos:
Average number of cars or other vehicles available in apartments:
| This neighborhood: | 1.7 |
| Chicago: | 1.5 |
Average number of cars or other vehicles available in apartments:
| Here: | 0.6 |
| city: | 0.8 |
Percentage of units with a mortgage:
| Little Italy: | 49.7% |
| Chicago: | 64.7% |
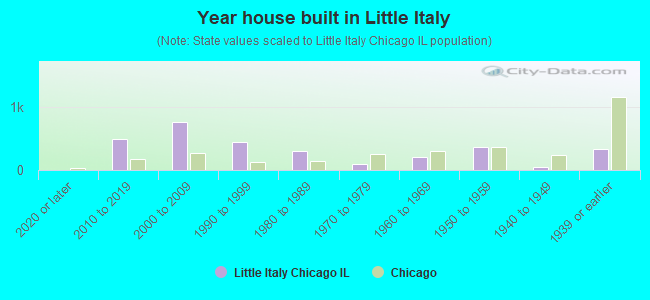
- Year house built in Little Italy
- 02020 or later
- 4842010 to 2019
- 7592000 to 2009
- 4371990 to 1999
- 3031980 to 1989
- 1021970 to 1979
- 2001960 to 1969
- 3671950 to 1959
- 421940 to 1949
- 3361939 or earlier
City-data.com crime index for city in 2020 (higher means more crime):
| City: | 421.1 |
| U.S. average: | 219.5 |
Travel time to work (commute)
![Travel time to work (commute)]()
- 49Less than 5 minutes
- 2975 to 9 minutes
- 37910 to 14 minutes
- 42215 to 19 minutes
- 45620 to 24 minutes
- 23525 to 29 minutes
- 32430 to 34 minutes
- 3335 to 39 minutes
- 20940 to 44 minutes
- 44945 to 59 minutes
- 15260 to 89 minutes
- 8290 or more minutes

Means of transportation to work
![Means of transportation to work]()
- 41.6%1,070Drove a car alone
- 8.2%211Carpooled
- 20.0%515Bus
- 14.5%372Subway or elevated rail
- 3.6%93Long-distance train or commuter rail
- 4.4%112Bicycle
- 11.6%298Walked
- 5.6%145Worked at home

Time leaving home to go to work
![Time leaving home to go to work]()
- 12612:00 a.m. to 4:59 a.m.
- 615:00 a.m. to 5:29 a.m.
- 805:30 a.m. to 5:59 a.m.
- 2416:00 a.m. to 6:29 a.m.
- 996:30 a.m. to 6:59 a.m.
- 6087:00 a.m. to 7:29 a.m.
- 2797:30 a.m. to 7:59 a.m.
- 4318:00 a.m. to 8:29 a.m.
- 2368:30 a.m. to 8:59 a.m.
- 1589:00 a.m. to 9:59 a.m.
- 47710:00 a.m. to 10:59 a.m.
- 2911:00 a.m. to 11:59 a.m.
- 23012:00 p.m. to 3:59 p.m.
- 1824:00 p.m. to 11:59 p.m.

Occupations of males:
- Percentage of males in management occupations (except farmers):
Here: 13.1% city: 12.0%
- Percentage of males in business and financial operations occupations:
Here: 5.6% city: 7.9%
- Percentage of males in computer and mathematical occupations:
Here: 6.9% city: 6.3%
- Percentage of males in architecture and engineering occupations:
Here: 4.7% city: 2.4%
- Percentage of males in life, physical, and social science occupations:
Here: 8.8% city: 1.1%
- Percentage of males in legal occupations:
Here: 3.5% city: 2.1%
- Percentage of males in education, training, and library occupations:
Here: 4.9% city: 4.2%
- Percentage of males in arts, design, entertainment, sports, and media occupations:
Here: 3.7% city: 3.0%
- Percentage of males in healthcare practitioners and technical occupations:
Here: 8.3% city: 3.1%
- Percentage of males in service occupations:
Here: 22.5% city: 15.8%
- Percentage of males in sales and office occupations:
Here: 17.3% city: 14.5%
- Percentage of males in farming, fishing, and forestry occupations:
Here: 2.3% city: 0.1%
- Percentage of males in construction, extraction, and maintenance occupations:
Here: 1.6% city: 5.6%
- Percentage of males in production occupations:
Here: 1.6% city: 5.6%
- Percentage of males in material moving occupations:
Here: 2.5% city: 5.4%
Occupations of females:
- Percentage of females in management occupations (except farmers):
Here: 5.2% city: 11.1%
- Percentage of females in business and financial operations occupations:
Here: 11.8% city: 9.2%
- Percentage of females in computer and mathematical occupations:
Here: 4.2% city: 2.3%
- Percentage of females in life, physical, and social science occupations:
Here: 5.4% city: 1.2%
- Percentage of females in community and social services occupations:
Here: 3.0% city: 3.0%
- Percentage of females in legal occupations:
Here: 4.1% city: 2.3%
- Percentage of females in education, training, and library occupations:
Here: 7.2% city: 8.8%
- Percentage of females in healthcare practitioners and technical occupations:
Here: 6.0% city: 8.5%
- Percentage of females in service occupations:
Here: 21.9% city: 19.6%
- Percentage of females in sales and office occupations:
Here: 23.4% city: 23.3%
- Percentage of females in production occupations:
Here: 6.6% city: 3.0%
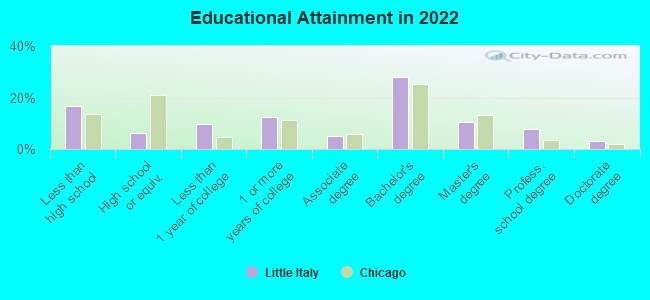
Education in this neighborhood (subdivision or community):
- Percentage of people 3 years and older in K-12 schools:
Little Italy: 17.8% Chicago: 14.6%
- Percentage of people 3 years and older in undergraduate colleges:
Little Italy: 6.9% Chicago: 5.1%
- Percentage of people 3 years and older in grad. or professional schools:
Little Italy: 12.0% Chicago: 2.6%
- Percentage of students K-12 enrolled in private schools:
Little Italy: 5.6% Chicago: 15.6%
Percentage of population below poverty level:
| Little Italy: | 27.8% |
| Chicago: | 17.2% |
Median year owner moved in (as recorded in 2022):
Median year renter moved in (as recorded in 2022):
| Little Italy: | 2001 |
| Chicago: | 2010 |
Median year renter moved in (as recorded in 2022):
| Little Italy: | 2014 |
| Chicago: | 2020 |
Percentage of married-couple families with both working:
| Little Italy: | 91.0% |
| Chicago: | 69.2% |
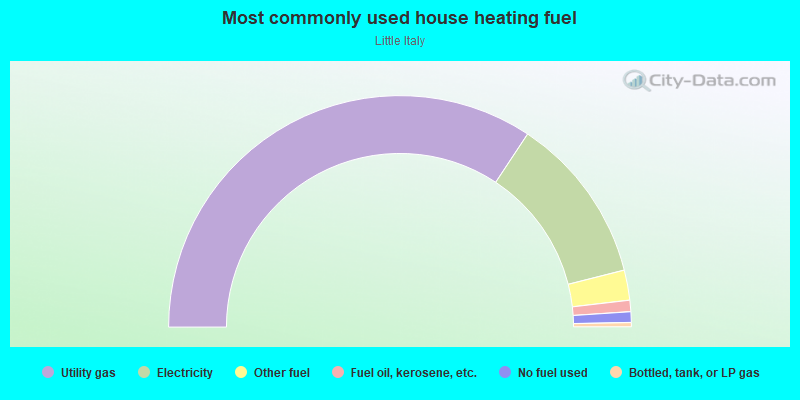
- 68.6%Utility gas
- 23.5%Electricity
- 4.2%Other fuel
- 1.6%Fuel oil, kerosene, etc.
- 1.5%No fuel used
- 0.6%Bottled, tank, or LP gas
Roads and streets:
W Taylor St
Length: 1.00 miles
Direction: E-W
Address range: 1000 to 1567
Direction: E-W
Address range: 1000 to 1567
W Polk St
Length: 0.81 miles
Directions: E-W, SE-NW
Address range: 1000 to 1595
Directions: E-W, SE-NW
Address range: 1000 to 1595
W Flournoy St
Length: 0.50 miles
Directions: E-W, SW-NE
Address range: 1205 to 1499
Directions: E-W, SW-NE
Address range: 1205 to 1499
W Lexington St
Length: 0.45 miles
Direction: E-W
Address range: 1200 to 1498
Direction: E-W
Address range: 1200 to 1498
W Vernon Park Pl
Length: 0.36 miles
Direction: E-W
Address range: 716 to 1199
Direction: E-W
Address range: 716 to 1199
S Laflin St
Length: 0.31 miles
Direction: N-S
Address range: 608 to 999
Direction: N-S
Address range: 608 to 999
S Loomis St
Length: 0.30 miles
Direction: N-S
Address range: 611 to 999
Direction: N-S
Address range: 611 to 999
S Racine Ave
Length: 0.30 miles
Directions: N-S, SE-NW
Address range: 623 to 999
Directions: N-S, SE-NW
Address range: 623 to 999
S Lytle St
Length: 0.30 miles
Direction: N-S
Address range: 600 to 999
Direction: N-S
Address range: 600 to 999
W Cabrini St
Length: 0.29 miles
Directions: E-W, SE-NW, SW-NE
Address range: 1054 to 1299
Directions: E-W, SE-NW, SW-NE
Address range: 1054 to 1299
S Miller St
Length: 0.23 miles
Direction: N-S
Address range: 700 to 999
Direction: N-S
Address range: 700 to 999
S Ada St
Length: 0.23 miles
Directions: N-S, SW-NE
Address range: 619 to 999
Directions: N-S, SW-NE
Address range: 619 to 999
S Morgan St
Length: 0.23 miles
Directions: E-W, N-S, SE-NW, SW-NE
Address range: 706 to 999
Directions: E-W, N-S, SE-NW, SW-NE
Address range: 706 to 999
S Aberdeen St
Length: 0.22 miles
Directions: N-S, SE-NW
Address range: 701 to 999
Directions: N-S, SE-NW
Address range: 701 to 999
S Carpenter St
Length: 0.22 miles
Directions: N-S, SE-NW
Address range: 700 to 999
Directions: N-S, SE-NW
Address range: 700 to 999
S May St
Length: 0.22 miles
Directions: N-S, SE-NW, SW-NE
Address range: 700 to 999
Directions: N-S, SE-NW, SW-NE
Address range: 700 to 999
Morgan St
Length: 0.20 miles
Directions: E-W, N-S, SE-NW, SW-NE
Directions: E-W, N-S, SE-NW, SW-NE
W Arthington St
Length: 0.18 miles
Direction: E-W
Address range: 1054 to 1399
Direction: E-W
Address range: 1054 to 1399
Ashland Ave
Length: 0.17 miles
Direction: N-S
Direction: N-S
W Westgate Ter
Length: 0.11 miles
Direction: E-W
Address range: 1236 to 1323
Direction: E-W
Address range: 1236 to 1323
S Bishop St
Length: 0.08 miles
Direction: N-S
Address range: 800 to 1830
Direction: N-S
Address range: 800 to 1830
Racine Ave
Length: 0.07 miles
Direction: N-S
Direction: N-S
Bishop St ()
Length: 0.06 miles
Direction: N-S
Direction: N-S