Loma Linda neighborhood in Midland, Texas (TX), 79705 detailed profile
Settings
X


Business Search - 14 Million verified businesses
Area: 0.251 square miles
Population: 4,270
Population density:
| Loma Linda: | 17,032 people per square mile |
| Midland: | 2,018 people per square mile |

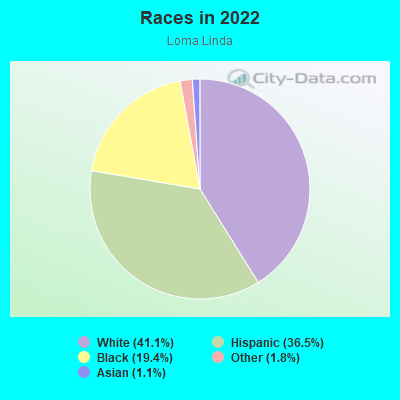
- 1,75341.1%White
- 1,56036.5%Hispanic or Latino
- 82819.4%Black
- 751.8%Some other race
- 491.1%Asian
- 40.09%Two or more races
Median household income in 2022:
| Loma Linda: | $124,281 |
| Midland: | $80,235 |
Distribution of median household income
![Distribution of median household income]()
- 215Less than $10,000
- 53$10,000 to $19,999
- 33$20,000 to $29,999
- 10$30,000 to $39,999
- 83$40,000 to $49,999
- 150$50,000 to $59,999
- 95$60,000 to $74,999
- 311$75,000 to $99,999
- 131$100,000 to $124,999
- 240$125,000 to $149,999
- 80$150,000 to $199,999
- 288$200,000 or more

Distribution of owner-occupied house/condo value
![Distribution of owner-occupied house/condo value]()
- 108$50,000 to $99,999
- 54$100,000 to $149,999
- 215$150,000 to $199,999
- 120$200,000 to $249,999
- 387$250,000 to $299,999
- 134$300,000 to $399,999
- 87$1,000,000 or more

Distribution of rent paid by renters
![Distribution of rent paid by renters]()
- 5$600 to $699
- 64$1,000 to $1,249
- 245$1,250 to $1,499
- 361$2,000 or more

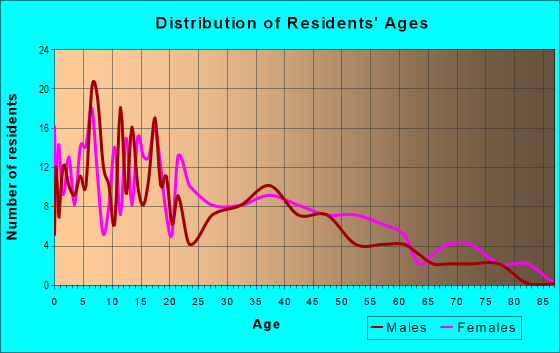
| Males: | 2,112 |
| Females: | 2,158 |
Males:
| This neighborhood: | 30.7 years |
| Whole city: | 32.3 years |
| This neighborhood: | 38.7 years |
| Whole city: | 33.3 years |
Average household size:
| Loma Linda: | 2.9 people |
| Midland: | 2.4 people |
Percentage of family households:
| Loma Linda: | 47.1% |
| Midland: | 52.0% |
| Here: | 57.3% |
| Midland: | 46.4% |
Percentage of married-couple families with children (among all households):
| Loma Linda: | 38.6% |
| Midland: | 30.9% |
Percentage of single-mother households (among all households):
| Loma Linda: | 1.7% |
| Midland: | 8.1% |
Percentage of never married males 15 years old and over:
Percentage of never married females 15 years old and over:
| Loma Linda: | 14.2% |
| Midland: | 15.2% |
Percentage of never married females 15 years old and over:
| Loma Linda: | 9.5% |
| city: | 14.9% |
Percentage of people that speak English not well or not at all:
| Loma Linda: | 4.3% |
| Midland: | 5.7% |
Percentage of people born in this state:
Percentage of people born in another U.S. state:
Percentage of native residents but born outside the U.S.:
Percentage of foreign born residents:
| Here: | 74.3% |
| Midland: | 69.5% |
Percentage of people born in another U.S. state:
| Loma Linda: | 13.9% |
| Midland: | 18.2% |
Percentage of native residents but born outside the U.S.:
| Here: | 0.4% |
| city: | 1.2% |
Percentage of foreign born residents:
| Here: | 11.4% |
| Midland: | 11.2% |
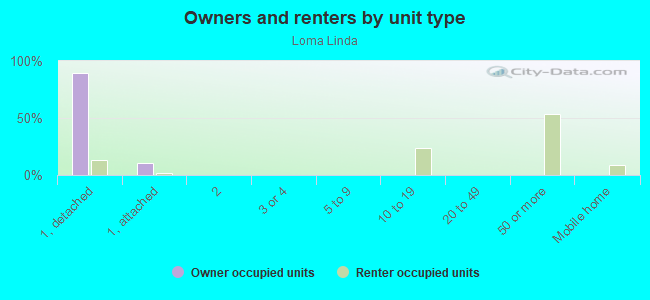
Owner-occupied
Renter-occupied

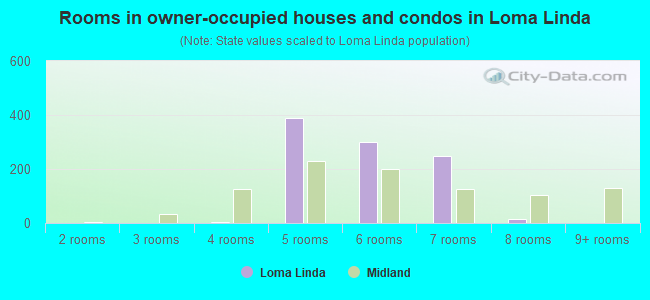
- Rooms in owner-occupied houses and condos in Loma Linda
- 01 room
- 02 rooms
- 13 rooms
- 44 rooms
- 3895 rooms
- 2996 rooms
- 2507 rooms
- 158 rooms
- 09+ rooms
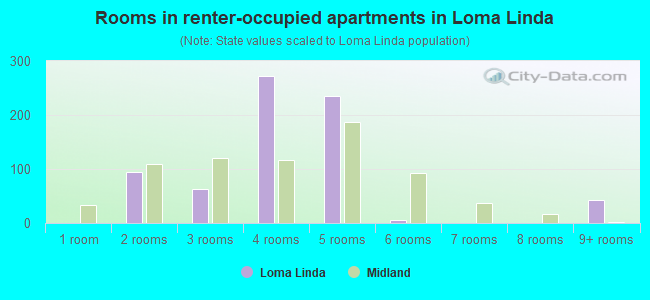
- Rooms in renter-occupied apartments in Loma Linda
- 01 room
- 942 rooms
- 633 rooms
- 2724 rooms
- 2365 rooms
- 66 rooms
- 07 rooms
- 08 rooms
- 429+ rooms
Owner-occupied
Renter-occupied
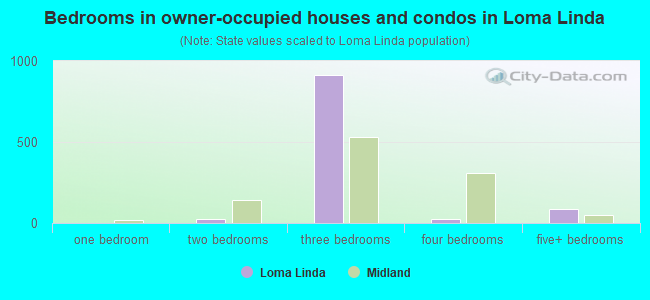
- Bedrooms in owner-occupied houses and condos in Loma Linda
- 7no bedroom
- 01 bedroom
- 222 bedrooms
- 9123 bedrooms
- 264 bedrooms
- 865+ bedrooms
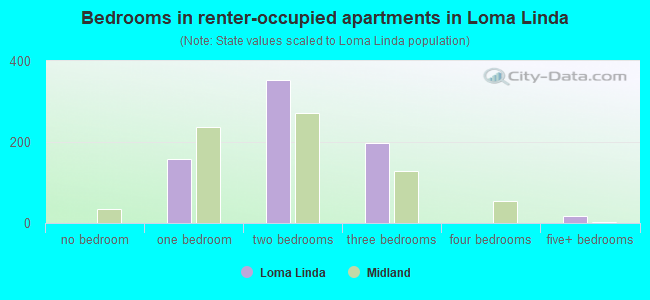
- Bedrooms in renter-occupied apartments in Loma Linda
- 0no bedroom
- 1581 bedroom
- 3532 bedrooms
- 1983 bedrooms
- 04 bedrooms
- 185+ bedrooms
Average number of cars or other vehicles available in houses/condos:
Average number of cars or other vehicles available in apartments:
| This neighborhood: | 1.9 |
| Midland: | 2.1 |
Average number of cars or other vehicles available in apartments:
| Here: | 1.9 |
| city: | 1.4 |
Percentage of units with a mortgage:
| Loma Linda: | 49.2% |
| Midland: | 58.2% |
Average estimated value of detached houses in 2022 (57.9% of all units):
| Loma Linda: | $231,559 |
| Texas: | $369,058 |
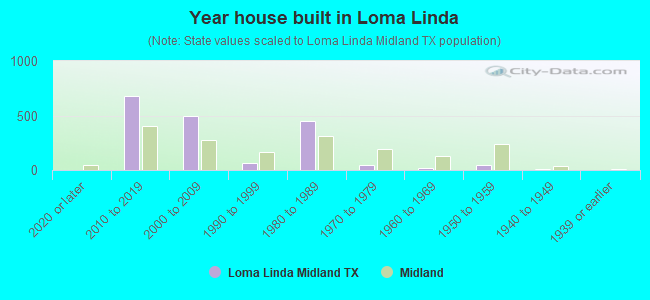
- Year house built in Loma Linda
- 02020 or later
- 6822010 to 2019
- 4932000 to 2009
- 601990 to 1999
- 4511980 to 1989
- 481970 to 1979
- 221960 to 1969
- 481950 to 1959
- 131940 to 1949
- 01939 or earlier
City-data.com crime index for city in 2020 (higher means more crime):
| City: | 223.8 |
| U.S. average: | 219.5 |
Travel time to work (commute)
![Travel time to work (commute)]()
- 1145 to 9 minutes
- 11610 to 14 minutes
- 13715 to 19 minutes
- 2420 to 24 minutes
- 11830 to 34 minutes
- 4035 to 39 minutes
- 26645 to 59 minutes
- 4690 or more minutes

Means of transportation to work
![Means of transportation to work]()
- 85.7%1,908Drove a car alone
- 8.2%182Carpooled
- 0.0%1Bus
- 3.2%72Walked
- 2.7%60Worked at home

Time leaving home to go to work
![Time leaving home to go to work]()
- 5212:00 a.m. to 4:59 a.m.
- 625:00 a.m. to 5:29 a.m.
- 616:00 a.m. to 6:29 a.m.
- 1116:30 a.m. to 6:59 a.m.
- 987:00 a.m. to 7:29 a.m.
- 1087:30 a.m. to 7:59 a.m.
- 138:00 a.m. to 8:29 a.m.
- 498:30 a.m. to 8:59 a.m.
- 539:00 a.m. to 9:59 a.m.
- 1912:00 p.m. to 3:59 p.m.
- 144:00 p.m. to 11:59 p.m.

Occupations of males:
- Percentage of males in management occupations (except farmers):
Here: 8.7% city: 14.6%
- Percentage of males in business and financial operations occupations:
Here: 4.7% city: 3.8%
- Percentage of males in architecture and engineering occupations:
Here: 4.9% city: 7.5%
- Percentage of males in legal occupations:
Here: 1.5% city: 1.2%
- Percentage of males in education, training, and library occupations:
Here: 6.1% city: 2.5%
- Percentage of males in service occupations:
Here: 9.7% city: 9.5%
- Percentage of males in sales and office occupations:
Here: 8.9% city: 14.8%
- Percentage of males in construction, extraction, and maintenance occupations:
Here: 8.8% city: 15.1%
- Percentage of males in production occupations:
Here: 15.1% city: 7.5%
- Percentage of males in transportation occupations:
Here: 11.7% city: 5.1%
- Percentage of males in material moving occupations:
Here: 12.0% city: 4.8%
Occupations of females:
- Percentage of females in management occupations (except farmers):
Here: 8.6% city: 11.6%
- Percentage of females in business and financial operations occupations:
Here: 4.2% city: 6.9%
- Percentage of females in life, physical, and social science occupations:
Here: 1.9% city: 0.8%
- Percentage of females in education, training, and library occupations:
Here: 7.0% city: 11.2%
- Percentage of females in healthcare practitioners and technical occupations:
Here: 14.6% city: 6.8%
- Percentage of females in service occupations:
Here: 11.8% city: 16.8%
- Percentage of females in sales and office occupations:
Here: 51.9% city: 33.2%
- Percentage of females in production occupations:
Here: 2.4% city: 2.0%
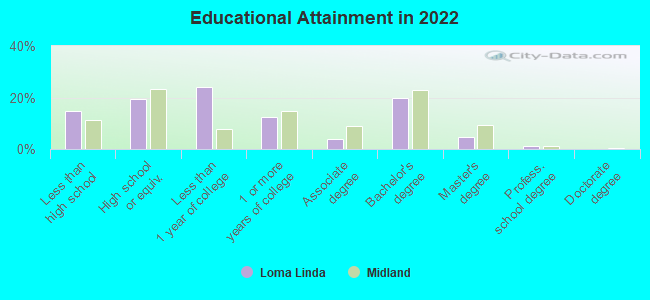
Education in this neighborhood (subdivision or community):
- Percentage of people 3 years and older in K-12 schools:
Loma Linda: 23.4% Midland: 22.4%
- Percentage of people 3 years and older in undergraduate colleges:
Loma Linda: 3.9% Midland: 3.0%
- Percentage of people 3 years and older in grad. or professional schools:
Loma Linda: 0.0% Midland: 1.8%
- Percentage of students K-12 enrolled in private schools:
Loma Linda: 15.8% Midland: 16.2%
Percentage of population below poverty level:
| Loma Linda: | 13.8% |
| Midland: | 11.7% |
Median year owner moved in (as recorded in 2022):
| Loma Linda: | 2009 |
| Midland: | 2015 |
Percentage of married-couple families with both working:
| Loma Linda: | 48.2% |
| Midland: | 63.2% |
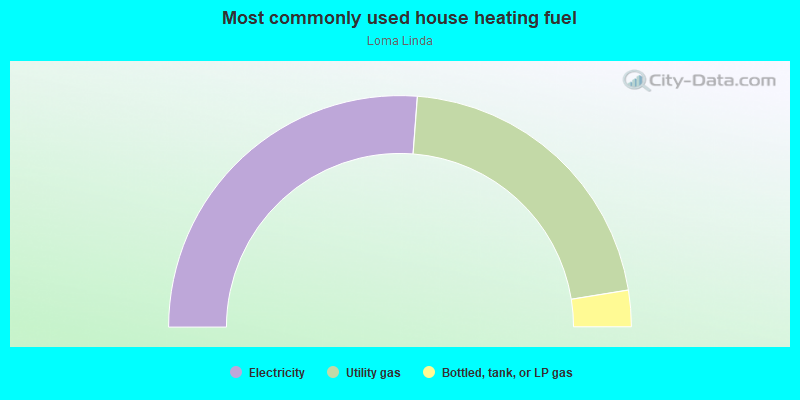
- 52.4%Electricity
- 42.5%Utility gas
- 5.1%Bottled, tank, or LP gas
Roads and streets:
Barber St
Length: 0.66 miles
Direction: N-S
Address range: 1900 to 2899
Direction: N-S
Address range: 1900 to 2899
N Lamesa Rd
Length: 0.52 miles
Direction: N-S
Address range: 1800 to 2848
Direction: N-S
Address range: 1800 to 2848
E Spruce Ave
Length: 0.44 miles
Direction: E-W
Address range: 100 to 499
Direction: E-W
Address range: 100 to 499
E Pecan Ave
Length: 0.44 miles
Direction: E-W
Address range: 100 to 499
Direction: E-W
Address range: 100 to 499
E Pine Ave
Length: 0.44 miles
Direction: E-W
Address range: 100 to 499
Direction: E-W
Address range: 100 to 499
E Oak Ave
Length: 0.44 miles
Direction: E-W
Address range: 100 to 499
Direction: E-W
Address range: 100 to 499
E Scharbauer Dr
Length: 0.35 miles
Direction: E-W
Address range: 400 to 1099
Direction: E-W
Address range: 400 to 1099
N Edwards St
Length: 0.19 miles
Direction: N-S
Address range: 2600 to 2899
Direction: N-S
Address range: 2600 to 2899
N Main St
Length: 0.19 miles
Direction: N-S
Address range: 2600 to 2899
Direction: N-S
Address range: 2600 to 2899
E Maple Ave
Length: 0.17 miles
Direction: E-W
Address range: 400 to 499
Direction: E-W
Address range: 400 to 499
E Magnolia Ave
Length: 0.17 miles
Direction: E-W
Address range: 400 to 499
Direction: E-W
Address range: 400 to 499
Cedar Ave
Length: 0.17 miles
Direction: E-W
Address range: 400 to 499
Direction: E-W
Address range: 400 to 499
E Hickory Ave
Length: 0.17 miles
Direction: E-W
Address range: 400 to 499
Direction: E-W
Address range: 400 to 499
Elm Ave
Length: 0.17 miles
Direction: E-W
Address range: 400 to 499
Direction: E-W
Address range: 400 to 499
Cottonwood Ave
Length: 0.12 miles
Direction: E-W
Address range: 400 to 499
Direction: E-W
Address range: 400 to 499