Lyndale neighborhood in Minneapolis, Minnesota (MN), 55408 detailed profile
Settings
X

Business Search - 14 Million verified businesses
Area: 0.483 square miles
Population: 7,909
Population density:
| Lyndale: | 16,380 people per square mile |
| Minneapolis: | 7,744 people per square mile |

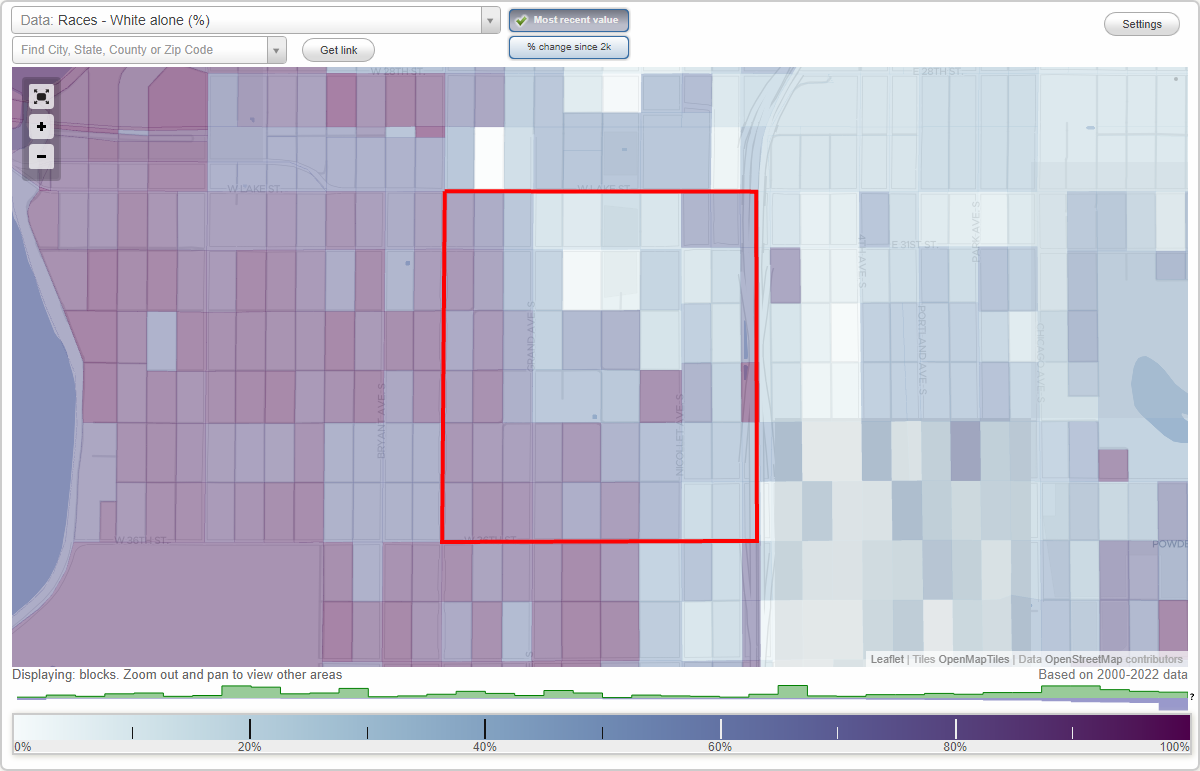
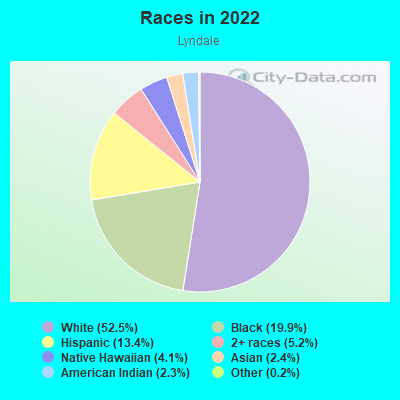
- 4,42952.5%White
- 1,67819.9%Black
- 1,13013.4%Hispanic or Latino
- 4395.2%Two or more races
- 3484.1%Native Hawaiian and Other
Pacific Islander - 2002.4%Asian
- 1962.3%American Indian
- 170.2%Some other race
Median household income in 2022:
| Lyndale: | $64,958 |
| Minneapolis: | $74,473 |
Distribution of median household income
![Distribution of median household income]()
- 570Less than $10,000
- 579$10,000 to $19,999
- 715$20,000 to $29,999
- 377$30,000 to $39,999
- 717$40,000 to $49,999
- 365$50,000 to $59,999
- 498$60,000 to $74,999
- 562$75,000 to $99,999
- 432$100,000 to $124,999
- 143$125,000 to $149,999
- 313$150,000 to $199,999
- 319$200,000 or more

Distribution of owner-occupied house/condo value
![Distribution of owner-occupied house/condo value]()
- 175Less than $50,000
- 259$50,000 to $99,999
- 366$100,000 to $149,999
- 736$150,000 to $199,999
- 503$200,000 to $249,999
- 342$250,000 to $299,999
- 411$300,000 to $399,999
- 281$400,000 to $499,999
- 309$500,000 to $749,999
- 143$1,000,000 or more

Distribution of rent paid by renters
![Distribution of rent paid by renters]()
- 453Less than $100
- 387$100 to $199
- 731$200 to $299
- 334$300 to $399
- 488$400 to $499
- 246$500 to $599
- 237$600 to $699
- 251$700 to $799
- 290$800 to $899
- 593$900 to $999
- 762$1,000 to $1,249
- 409$1,250 to $1,499
- 367$1,500 to $1,999
- 514$2,000 or more

Median rent in 2022:
| Lyndale: | $1,049 |
| Minneapolis: | $1,159 |
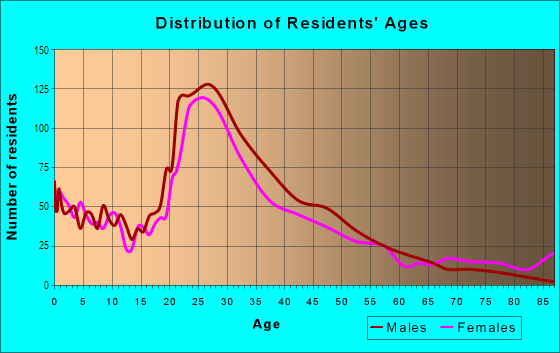
| Males: | 4,106 |
| Females: | 3,803 |
Males:
| This neighborhood: | 31.7 years |
| Whole city: | 33.3 years |
| This neighborhood: | 29.6 years |
| Whole city: | 33.2 years |
Average household size:
| Lyndale: | 2.2 people |
| Minneapolis: | 2.1 people |
Percentage of family households:
| Lyndale: | 33.3% |
| Minneapolis: | 34.1% |
| Here: | 24.8% |
| Minneapolis: | 29.8% |
Percentage of married-couple families with children (among all households):
| Lyndale: | 31.6% |
| Minneapolis: | 31.8% |
Percentage of single-mother households (among all households):
| Lyndale: | 24.7% |
| Minneapolis: | 10.5% |
Percentage of never married males 15 years old and over:
Percentage of never married females 15 years old and over:
| Lyndale: | 30.1% |
| Minneapolis: | 27.0% |
Percentage of never married females 15 years old and over:
| Lyndale: | 23.7% |
| city: | 25.4% |
Percentage of people that speak English not well or not at all:
| Lyndale: | 8.0% |
| Minneapolis: | 3.8% |
Percentage of people born in this state:
Percentage of people born in another U.S. state:
Percentage of native residents but born outside the U.S.:
Percentage of foreign born residents:
| Here: | 51.6% |
| Minneapolis: | 51.9% |
Percentage of people born in another U.S. state:
| Lyndale: | 26.4% |
| Minneapolis: | 31.8% |
Percentage of native residents but born outside the U.S.:
| Here: | 1.2% |
| city: | 1.5% |
Percentage of foreign born residents:
| Here: | 20.8% |
| Minneapolis: | 14.7% |
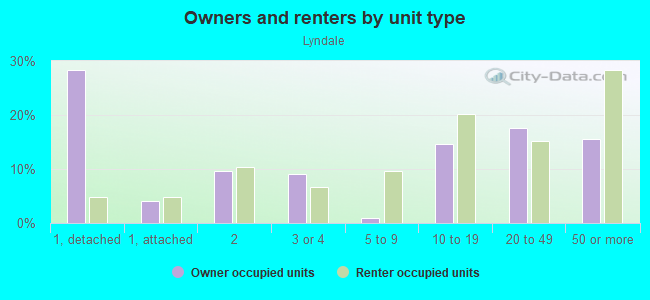
Owner-occupied
Renter-occupied

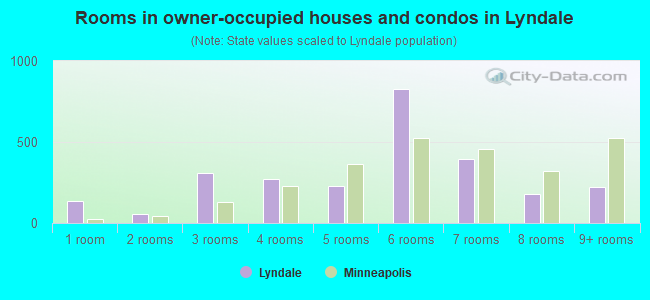
- Rooms in owner-occupied houses and condos in Lyndale
- 1341 room
- 562 rooms
- 3063 rooms
- 2694 rooms
- 2285 rooms
- 8286 rooms
- 3947 rooms
- 1818 rooms
- 2239+ rooms
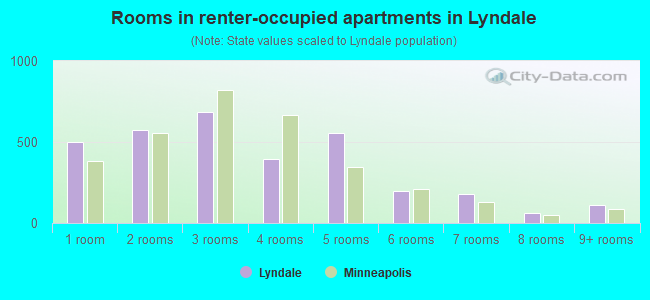
- Rooms in renter-occupied apartments in Lyndale
- 4971 room
- 5722 rooms
- 6853 rooms
- 3924 rooms
- 5565 rooms
- 2006 rooms
- 1807 rooms
- 608 rooms
- 1129+ rooms
Owner-occupied
Renter-occupied
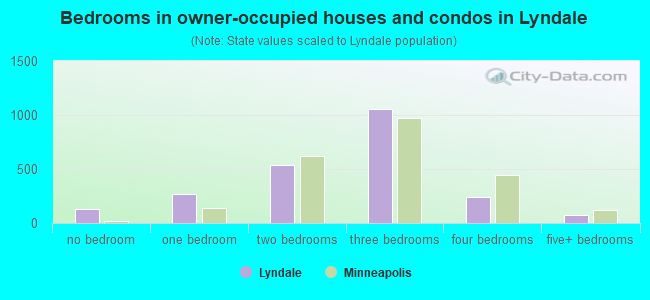
- Bedrooms in owner-occupied houses and condos in Lyndale
- 134no bedroom
- 2671 bedroom
- 5382 bedrooms
- 1,0583 bedrooms
- 2454 bedrooms
- 775+ bedrooms
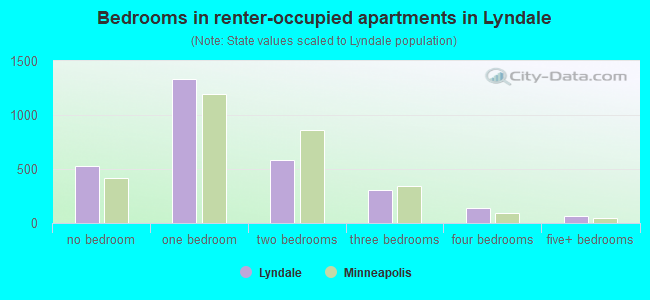
- Bedrooms in renter-occupied apartments in Lyndale
- 524no bedroom
- 1,3371 bedroom
- 5842 bedrooms
- 3073 bedrooms
- 1414 bedrooms
- 615+ bedrooms
Average number of cars or other vehicles available in houses/condos:
Average number of cars or other vehicles available in apartments:
| This neighborhood: | 2.0 |
| Minneapolis: | 1.6 |
Average number of cars or other vehicles available in apartments:
| Here: | 1.0 |
| city: | 1.1 |
Percentage of units with a mortgage:
| Lyndale: | 68.3% |
| Minneapolis: | 71.8% |
Average estimated '22 value of housing units in 5-or-more-unit structures (37.4% of all units):
| Lyndale: | $92,889 |
| Minnesota: | $258,516 |
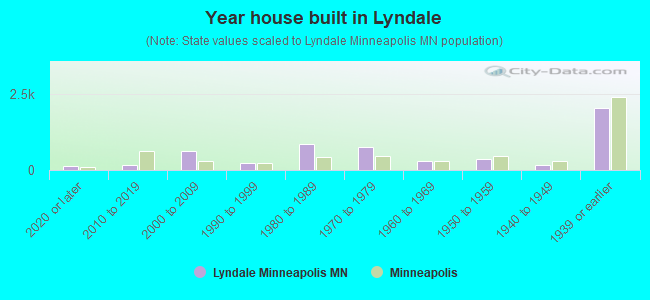
- Year house built in Lyndale
- 1212020 or later
- 1572010 to 2019
- 6392000 to 2009
- 2201990 to 1999
- 8581980 to 1989
- 7491970 to 1979
- 2881960 to 1969
- 3681950 to 1959
- 1591940 to 1949
- 2,0341939 or earlier
City-data.com crime index for city in 2020 (higher means more crime):
| City: | 600.2 |
| U.S. average: | 219.5 |
Travel time to work (commute)
![Travel time to work (commute)]()
- 139Less than 5 minutes
- 1705 to 9 minutes
- 44310 to 14 minutes
- 93815 to 19 minutes
- 39720 to 24 minutes
- 26325 to 29 minutes
- 60930 to 34 minutes
- 18135 to 39 minutes
- 13540 to 44 minutes
- 13745 to 59 minutes
- 11860 to 89 minutes
- 4490 or more minutes

Means of transportation to work
![Means of transportation to work]()
- 59.9%2,847Drove a car alone
- 8.3%394Carpooled
- 8.3%395Bus
- 2.3%110Subway or elevated rail
- 11.4%540Taxi
- 4.5%214Bicycle
- 4.8%227Walked
- 6.0%285Other means
- 16.0%758Worked at home

Time leaving home to go to work
![Time leaving home to go to work]()
- 6512:00 a.m. to 4:59 a.m.
- 1615:00 a.m. to 5:29 a.m.
- 565:30 a.m. to 5:59 a.m.
- 1876:00 a.m. to 6:29 a.m.
- 3016:30 a.m. to 6:59 a.m.
- 1777:00 a.m. to 7:29 a.m.
- 3217:30 a.m. to 7:59 a.m.
- 4988:00 a.m. to 8:29 a.m.
- 2468:30 a.m. to 8:59 a.m.
- 5239:00 a.m. to 9:59 a.m.
- 13910:00 a.m. to 10:59 a.m.
- 12411:00 a.m. to 11:59 a.m.
- 41012:00 p.m. to 3:59 p.m.
- 2704:00 p.m. to 11:59 p.m.

Occupations of males:
- Percentage of males in management occupations (except farmers):
Here: 3.8% city: 12.1%
- Percentage of males in business and financial operations occupations:
Here: 13.9% city: 9.1%
- Percentage of males in computer and mathematical occupations:
Here: 14.9% city: 8.4%
- Percentage of males in architecture and engineering occupations:
Here: 3.9% city: 4.6%
- Percentage of males in life, physical, and social science occupations:
Here: 4.3% city: 2.0%
- Percentage of males in community and social services occupations:
Here: 3.6% city: 1.8%
- Percentage of males in education, training, and library occupations:
Here: 2.4% city: 5.2%
- Percentage of males in arts, design, entertainment, sports, and media occupations:
Here: 4.3% city: 4.0%
- Percentage of males in healthcare practitioners and technical occupations:
Here: 3.7% city: 3.6%
- Percentage of males in service occupations:
Here: 11.3% city: 12.6%
- Percentage of males in sales and office occupations:
Here: 13.1% city: 15.3%
- Percentage of males in production occupations:
Here: 7.3% city: 5.8%
- Percentage of males in transportation occupations:
Here: 5.9% city: 4.1%
- Percentage of males in material moving occupations:
Here: 5.5% city: 3.6%
Occupations of females:
- Percentage of females in management occupations (except farmers):
Here: 9.3% city: 11.4%
- Percentage of females in business and financial operations occupations:
Here: 6.8% city: 9.8%
- Percentage of females in architecture and engineering occupations:
Here: 1.2% city: 1.2%
- Percentage of females in life, physical, and social science occupations:
Here: 1.4% city: 2.3%
- Percentage of females in community and social services occupations:
Here: 2.0% city: 3.8%
- Percentage of females in legal occupations:
Here: 1.3% city: 2.3%
- Percentage of females in education, training, and library occupations:
Here: 9.4% city: 10.6%
- Percentage of females in arts, design, entertainment, sports, and media occupations:
Here: 13.6% city: 5.6%
- Percentage of females in healthcare practitioners and technical occupations:
Here: 9.2% city: 8.3%
- Percentage of females in service occupations:
Here: 20.5% city: 17.8%
- Percentage of females in sales and office occupations:
Here: 22.6% city: 18.7%
- Percentage of females in production occupations:
Here: 1.6% city: 2.7%
- Percentage of females in material moving occupations:
Here: 1.2% city: 1.5%
Percentage of people 16-64 in Armed Forces:
| Lyndale: | 0.1% |
| Minneapolis: | 0.1% |
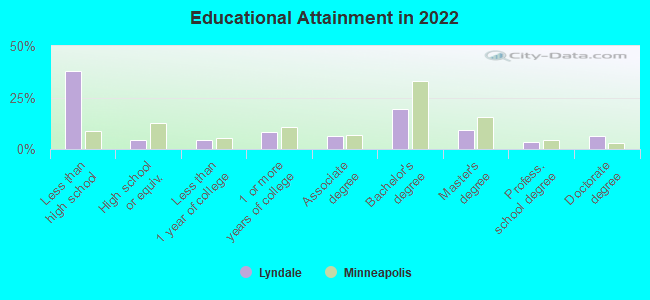
Education in this neighborhood (subdivision or community):
- Percentage of people 3 years and older in K-12 schools:
Lyndale: 32.6% Minneapolis: 14.0%
- Percentage of people 3 years and older in undergraduate colleges:
Lyndale: 5.5% Minneapolis: 8.6%
- Percentage of people 3 years and older in grad. or professional schools:
Lyndale: 7.7% Minneapolis: 2.9%
- Percentage of students K-12 enrolled in private schools:
Lyndale: 37.8% Minneapolis: 14.1%
Percentage of population below poverty level:
| Lyndale: | 21.7% |
| Minneapolis: | 17.2% |
Percentage of married-couple families with both working:
| Lyndale: | 105.4% |
| Minneapolis: | 73.9% |
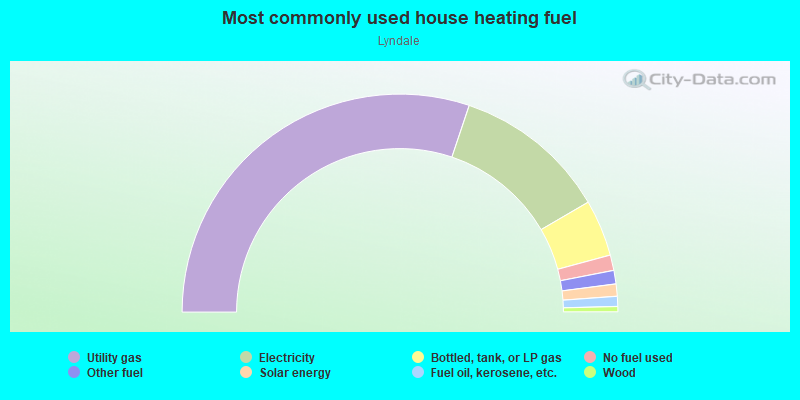
- 60.3%Utility gas
- 22.9%Electricity
- 8.4%Bottled, tank, or LP gas
- 2.3%No fuel used
- 2.0%Other fuel
- 1.8%Solar energy
- 1.5%Fuel oil, kerosene, etc.
- 0.8%Wood
Limited-access highways (interstate or state) in this neighborhood:
I- 35 (State Hwy 65)
Length: 0.37 miles
Direction: N-S
Direction: N-S
Roads and streets:
W 35th St
Length: 0.62 miles
Direction: E-W
Address range: 1 to 599
Direction: E-W
Address range: 1 to 599
W 34th St
Length: 0.62 miles
Direction: E-W
Address range: 1 to 599
Direction: E-W
Address range: 1 to 599
W 33rd St
Length: 0.62 miles
Direction: E-W
Address range: 1 to 599
Direction: E-W
Address range: 1 to 599
Stevens Ave S
Length: 0.62 miles
Directions: N-S, SE-NW, SW-NE
Address range: 3100 to 3599
Directions: N-S, SE-NW, SW-NE
Address range: 3100 to 3599
1st Ave S
Length: 0.61 miles
Directions: N-S, SE-NW
Address range: 3100 to 3599
Directions: N-S, SE-NW
Address range: 3100 to 3599
W 32nd St
Length: 0.61 miles
Direction: E-W
Address range: 1 to 599
Direction: E-W
Address range: 1 to 599
Co Rd 52 (Nicollet Ave)
Length: 0.61 miles
Direction: N-S
Address range: 3150 to 3599
Direction: N-S
Address range: 3150 to 3599
Grand Ave
Length: 0.61 miles
Direction: N-S
Address range: 3096 to 3599
Direction: N-S
Address range: 3096 to 3599
W 31st St
Length: 0.61 miles
Direction: E-W
Address range: 1 to 599
Direction: E-W
Address range: 1 to 599
Harriet Ave S
Length: 0.61 miles
Direction: N-S
Address range: 3100 to 3599
Direction: N-S
Address range: 3100 to 3599
Pillsbury Ave S
Length: 0.61 miles
Directions: N-S, SE-NW, SW-NE
Address range: 3100 to 3599
Directions: N-S, SE-NW, SW-NE
Address range: 3100 to 3599
Blaisdell Ave S
Length: 0.61 miles
Direction: N-S
Address range: 3100 to 3599
Direction: N-S
Address range: 3100 to 3599
Pleasant Ave S
Length: 0.56 miles
Direction: N-S
Address range: 3100 to 3599
Direction: N-S
Address range: 3100 to 3599
W 36th St
Length: 0.53 miles
Direction: E-W
Address range: 1 to 599
Direction: E-W
Address range: 1 to 599
Garfield Ave S
Length: 0.48 miles
Direction: N-S
Address range: 3201 to 3599
Direction: N-S
Address range: 3201 to 3599
E 35th St
Length: 0.22 miles
Direction: E-W
Address range: 1 to 199
Direction: E-W
Address range: 1 to 199
E 31st St
Length: 0.22 miles
Direction: E-W
Address range: 1 to 199
Direction: E-W
Address range: 1 to 199
E 36th St
Length: 0.18 miles
Direction: E-W
Address range: 1 to 199
Direction: E-W
Address range: 1 to 199
E 34th St
Length: 0.18 miles
Direction: E-W
Address range: 1 to 199
Direction: E-W
Address range: 1 to 199
E 33rd St
Length: 0.18 miles
Direction: E-W
Address range: 1 to 199
Direction: E-W
Address range: 1 to 199
E 32nd St
Length: 0.17 miles
Direction: E-W
Address range: 1 to 199
Direction: E-W
Address range: 1 to 199
Garfield Ave
Length: 0.13 miles
Direction: N-S
Address range: 3100 to 3199
Direction: N-S
Address range: 3100 to 3199