Makati neighborhood in San Jose, California (CA), 95123 detailed profile
Settings
X


Business Search - 14 Million verified businesses
Area: 0.078 square miles
Population: 783
Population density:
| Makati: | 10,080 people per square mile |
| San Jose: | 5,554 people per square mile |

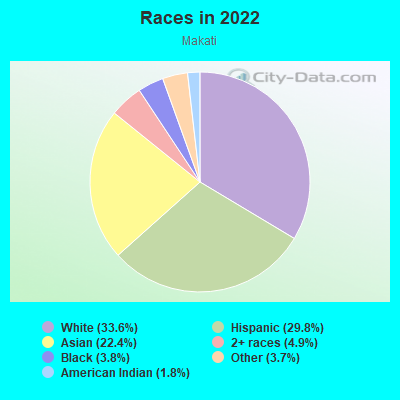
- 26733.6%White
- 23729.8%Hispanic or Latino
- 17822.4%Asian
- 394.9%Two or more races
- 303.8%Black
- 293.7%Some other race
- 141.8%American Indian
Median household income in 2022:
| Makati: | $92,306 |
| San Jose: | $133,835 |
Distribution of median household income
![Distribution of median household income]()
- 17Less than $10,000
- 28$10,000 to $19,999
- 33$20,000 to $29,999
- 30$30,000 to $39,999
- 38$40,000 to $49,999
- 39$50,000 to $59,999
- 26$60,000 to $74,999
- 17$75,000 to $99,999
- 20$100,000 to $124,999
- 102$125,000 to $149,999
- 97$150,000 to $199,999
- 95$200,000 or more

Distribution of owner-occupied house/condo value
![Distribution of owner-occupied house/condo value]()
- 26Less than $50,000
- 20$50,000 to $99,999
- 57$100,000 to $149,999
- 46$150,000 to $199,999
- 8$200,000 to $249,999
- 43$250,000 to $299,999
- 29$300,000 to $399,999
- 49$400,000 to $499,999
- 135$500,000 to $749,999
- 75$750,000 to $999,999
- 14$1,000,000 or more

Distribution of rent paid by renters
![Distribution of rent paid by renters]()
- 2$300 to $399
- 10$500 to $599
- 3$600 to $699
- 24$900 to $999
- 7$1,250 to $1,499
- 44$1,500 to $1,999
- 119$2,000 or more

Median rent in 2022:
| Makati: | $2,647 |
| San Jose: | $2,001 |
| Males: | 335 |
| Females: | 447 |
Males:
| This neighborhood: | 38.5 years |
| Whole city: | 37.6 years |
| This neighborhood: | 52.1 years |
| Whole city: | 39.1 years |
Average household size:
| Makati: | 2.3 people |
| San Jose: | 2.9 people |
Percentage of family households:
| Makati: | 29.6% |
| San Jose: | 49.9% |
| Here: | 26.0% |
| San Jose: | 53.0% |
Percentage of married-couple families with children (among all households):
| Makati: | 44.5% |
| San Jose: | 25.8% |
Percentage of single-mother households (among all households):
| Makati: | 6.8% |
| San Jose: | 5.2% |
Percentage of never married males 15 years old and over:
Percentage of never married females 15 years old and over:
| Makati: | 19.4% |
| San Jose: | 20.9% |
Percentage of never married females 15 years old and over:
| Makati: | 21.7% |
| city: | 16.7% |
Percentage of people that speak English not well or not at all:
| Makati: | 5.2% |
| San Jose: | 11.4% |
Percentage of people born in this state:
Percentage of people born in another U.S. state:
Percentage of native residents but born outside the U.S.:
Percentage of foreign born residents:
| Here: | 67.1% |
| San Jose: | 46.1% |
Percentage of people born in another U.S. state:
| Makati: | 14.8% |
| San Jose: | 10.4% |
Percentage of native residents but born outside the U.S.:
| Here: | 1.0% |
| city: | 1.7% |
Percentage of foreign born residents:
| Here: | 17.2% |
| San Jose: | 41.8% |
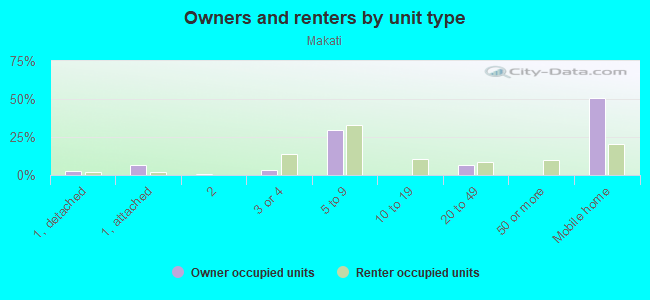
Owner-occupied
Renter-occupied

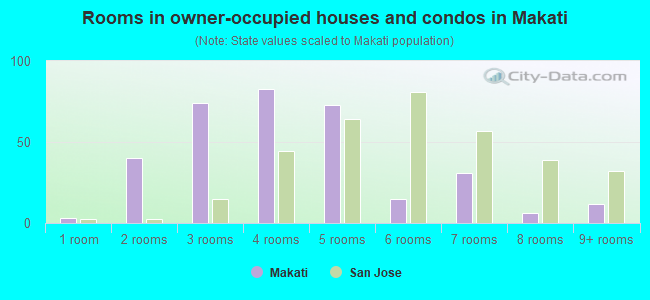
- Rooms in owner-occupied houses and condos in Makati
- 31 room
- 402 rooms
- 743 rooms
- 834 rooms
- 735 rooms
- 156 rooms
- 317 rooms
- 68 rooms
- 129+ rooms
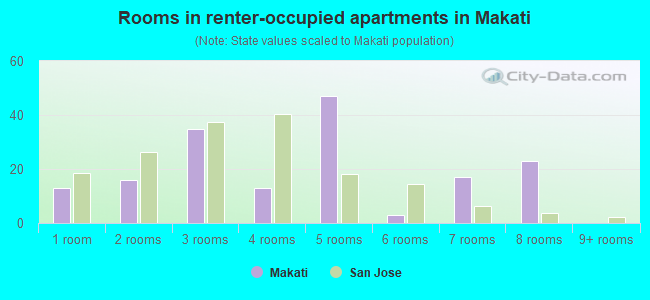
- Rooms in renter-occupied apartments in Makati
- 131 room
- 162 rooms
- 353 rooms
- 134 rooms
- 475 rooms
- 36 rooms
- 177 rooms
- 238 rooms
- 09+ rooms
Owner-occupied
Renter-occupied

- Bedrooms in owner-occupied houses and condos in Makati
- 3no bedroom
- 1051 bedroom
- 1662 bedrooms
- 153 bedrooms
- 194 bedrooms
- 75+ bedrooms
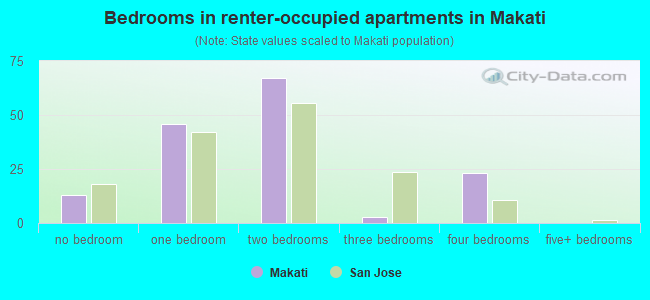
- Bedrooms in renter-occupied apartments in Makati
- 13no bedroom
- 461 bedroom
- 672 bedrooms
- 33 bedrooms
- 234 bedrooms
- 05+ bedrooms
Average number of cars or other vehicles available in houses/condos:
Average number of cars or other vehicles available in apartments:
| This neighborhood: | 1.4 |
| San Jose: | 2.3 |
Average number of cars or other vehicles available in apartments:
| Here: | 1.4 |
| city: | 1.6 |
Percentage of units with a mortgage:
| Makati: | 90.7% |
| San Jose: | 66.9% |
Housing prices:
- Average estimated value of detached houses in 2022 (4.0% of all units):
Makati: $602,120 San Jose: $1,532,815
- Average estimated value of mobile home in 2022 (83.1% of all units):
Makati: $234,839 San Jose: $237,683

- Year house built in Makati
- 02020 or later
- 242010 to 2019
- 162000 to 2009
- 171990 to 1999
- 3251980 to 1989
- 421970 to 1979
- 781960 to 1969
- 161950 to 1959
- 01940 to 1949
- 11939 or earlier
City-data.com crime index for city in 2020 (higher means more crime):
| City: | 268.4 |
| U.S. average: | 219.5 |
Travel time to work (commute)
![Travel time to work (commute)]()
- 13Less than 5 minutes
- 225 to 9 minutes
- 3710 to 14 minutes
- 5915 to 19 minutes
- 8320 to 24 minutes
- 1825 to 29 minutes
- 5330 to 34 minutes
- 935 to 39 minutes
- 640 to 44 minutes
- 1045 to 59 minutes
- 4960 to 89 minutes
- 690 or more minutes

Means of transportation to work
![Means of transportation to work]()
- 64.5%365Drove a car alone
- 9.5%54Carpooled
- 1.9%11Bus
- 0.4%2Long-distance train or commuter rail
- 5.1%29Light rail, streetcar or trolley
- 0.4%2Taxi
- 0.2%1Bicycle
- 0.5%3Walked
- 0.5%3Other means
- 18.6%105Worked at home

Time leaving home to go to work
![Time leaving home to go to work]()
- 2112:00 a.m. to 4:59 a.m.
- 145:00 a.m. to 5:29 a.m.
- 205:30 a.m. to 5:59 a.m.
- 156:00 a.m. to 6:29 a.m.
- 186:30 a.m. to 6:59 a.m.
- 437:00 a.m. to 7:29 a.m.
- 517:30 a.m. to 7:59 a.m.
- 998:00 a.m. to 8:29 a.m.
- 368:30 a.m. to 8:59 a.m.
- 289:00 a.m. to 9:59 a.m.
- 4210:00 a.m. to 10:59 a.m.
- 311:00 a.m. to 11:59 a.m.
- 2112:00 p.m. to 3:59 p.m.
- 134:00 p.m. to 11:59 p.m.

Occupations of males:
- Percentage of males in management occupations (except farmers):
Here: 8.0% city: 13.0%
- Percentage of males in business and financial operations occupations:
Here: 27.6% city: 4.6%
- Percentage of males in computer and mathematical occupations:
Here: 25.5% city: 13.6%
- Percentage of males in community and social services occupations:
Here: 3.0% city: 0.8%
- Percentage of males in education, training, and library occupations:
Here: 3.5% city: 2.8%
- Percentage of males in arts, design, entertainment, sports, and media occupations:
Here: 1.4% city: 1.8%
- Percentage of males in healthcare practitioners and technical occupations:
Here: 5.2% city: 2.0%
- Percentage of males in service occupations:
Here: 10.1% city: 12.7%
- Percentage of males in sales and office occupations:
Here: 7.4% city: 12.8%
- Percentage of males in transportation occupations:
Here: 5.3% city: 3.6%
- Percentage of males in material moving occupations:
Here: 7.3% city: 3.1%
Occupations of females:
- Percentage of females in management occupations (except farmers):
Here: 15.5% city: 11.0%
- Percentage of females in business and financial operations occupations:
Here: 25.6% city: 8.6%
- Percentage of females in computer and mathematical occupations:
Here: 5.0% city: 5.4%
- Percentage of females in architecture and engineering occupations:
Here: 12.7% city: 2.8%
- Percentage of females in legal occupations:
Here: 3.1% city: 1.3%
- Percentage of females in education, training, and library occupations:
Here: 6.0% city: 8.1%
- Percentage of females in arts, design, entertainment, sports, and media occupations:
Here: 5.3% city: 2.0%
- Percentage of females in healthcare practitioners and technical occupations:
Here: 5.7% city: 6.8%
- Percentage of females in service occupations:
Here: 10.8% city: 21.7%
- Percentage of females in sales and office occupations:
Here: 10.3% city: 22.0%
Education in this neighborhood (subdivision or community):
- Percentage of people 3 years and older in K-12 schools:
Makati: 15.0% San Jose: 16.1%
- Percentage of people 3 years and older in undergraduate colleges:
Makati: 8.5% San Jose: 6.5%
- Percentage of people 3 years and older in grad. or professional schools:
Makati: 3.0% San Jose: 2.0%
- Percentage of students K-12 enrolled in private schools:
Makati: 29.3% San Jose: 14.9%
Percentage of population below poverty level:
| Makati: | 3.3% |
| San Jose: | 9.0% |
Median year owner moved in (as recorded in 2022):
Median year renter moved in (as recorded in 2022):
| Makati: | 2010 |
| San Jose: | 2008 |
Median year renter moved in (as recorded in 2022):
| Makati: | 2011 |
| San Jose: | 2020 |
Percentage of married-couple families with both working:
| Makati: | 105.4% |
| San Jose: | 72.5% |
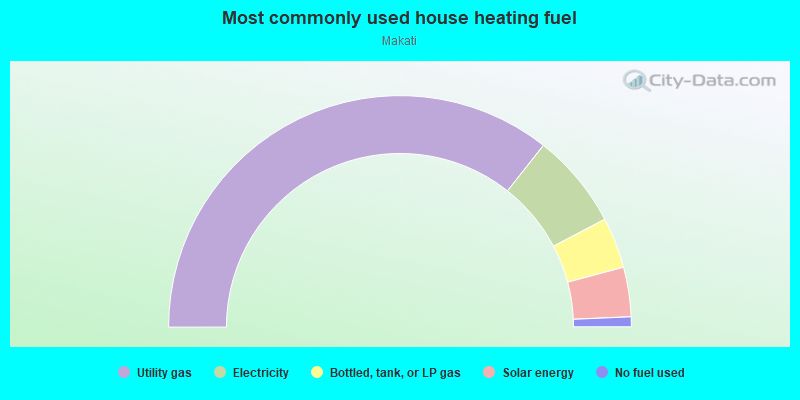
- 71.3%Utility gas
- 13.3%Electricity
- 7.1%Bottled, tank, or LP gas
- 6.9%Solar energy
- 1.4%No fuel used
Roads and streets:
Makati Cir
Length: 0.67 miles
Directions: E-W, N-S, SE-NW, SW-NE
Address range: 5172 to 5799
Directions: E-W, N-S, SE-NW, SW-NE
Address range: 5172 to 5799
Rochester Ave
Length: 0.14 miles
Directions: E-W, SW-NE
Directions: E-W, SW-NE