Mansion Flats neighborhood in Sacramento, California (CA), 95814 detailed profile
Settings
X


Business Search - 14 Million verified businesses
Area: 0.115 square miles
Population: 1,147
Population density:
| Mansion Flats: | 9,959 people per square mile |
| Sacramento: | 5,435 people per square mile |

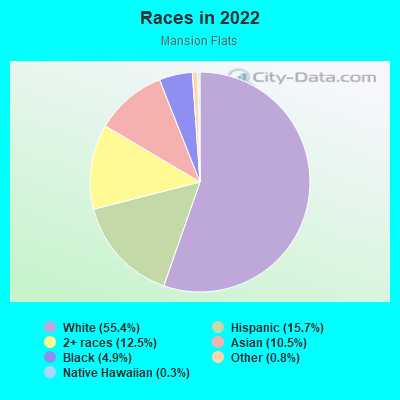
- 66155.4%White
- 18715.7%Hispanic or Latino
- 14912.5%Two or more races
- 12510.5%Asian
- 594.9%Black
- 100.8%Some other race
- 30.3%Native Hawaiian and Other
Pacific Islander
Distribution of median household income
![Distribution of median household income]()
- 30Less than $10,000
- 66$10,000 to $19,999
- 79$20,000 to $29,999
- 126$30,000 to $39,999
- 43$40,000 to $49,999
- 11$50,000 to $59,999
- 29$60,000 to $74,999
- 92$75,000 to $99,999
- 32$100,000 to $124,999
- 72$125,000 to $149,999
- 10$150,000 to $199,999
- 44$200,000 or more

Distribution of owner-occupied house/condo value
![Distribution of owner-occupied house/condo value]()
- 14$250,000 to $299,999
- 7$300,000 to $399,999
- 13$500,000 to $749,999
- 33$750,000 to $999,999
- 13$1,000,000 or more

Distribution of rent paid by renters
![Distribution of rent paid by renters]()
- 24$200 to $299
- 7$300 to $399
- 8$400 to $499
- 107$600 to $699
- 161$700 to $799
- 32$800 to $899
- 121$900 to $999
- 26$1,000 to $1,249
- 19$1,250 to $1,499
- 147$1,500 to $1,999
- 100$2,000 or more

Median rent in 2022:
| Mansion Flats: | $2,603 |
| Sacramento: | $1,473 |
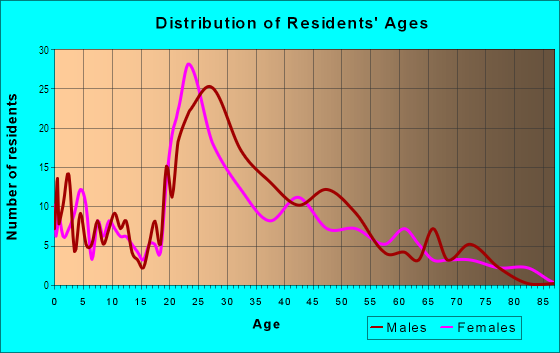
| Males: | 705 |
| Females: | 442 |
Males:
| This neighborhood: | 74.5 years |
| Whole city: | 35.5 years |
| This neighborhood: | 59.7 years |
| Whole city: | 36.6 years |
Average household size:
| Mansion Flats: | 3.4 people |
| Sacramento: | 2.6 people |
Percentage of family households:
| Mansion Flats: | 18.3% |
| Sacramento: | 42.4% |
| Here: | 21.7% |
| Sacramento: | 38.9% |
Percentage of married-couple families with children (among all households):
| Mansion Flats: | 51.7% |
| Sacramento: | 24.1% |
Percentage of single-mother households (among all households):
| Mansion Flats: | 0.0% |
| Sacramento: | 8.1% |
Percentage of never married males 15 years old and over:
Percentage of never married females 15 years old and over:
| Mansion Flats: | 31.0% |
| Sacramento: | 21.6% |
Percentage of never married females 15 years old and over:
| Mansion Flats: | 20.1% |
| city: | 20.9% |
Percentage of people that speak English not well or not at all:
| Mansion Flats: | 0.0% |
| Sacramento: | 8.0% |
Percentage of people born in this state:
Percentage of people born in another U.S. state:
Percentage of native residents but born outside the U.S.:
Percentage of foreign born residents:
| Here: | 66.5% |
| Sacramento: | 61.7% |
Percentage of people born in another U.S. state:
| Mansion Flats: | 20.5% |
| Sacramento: | 14.3% |
Percentage of native residents but born outside the U.S.:
| Here: | 4.8% |
| city: | 1.7% |
Percentage of foreign born residents:
| Here: | 8.2% |
| Sacramento: | 22.3% |
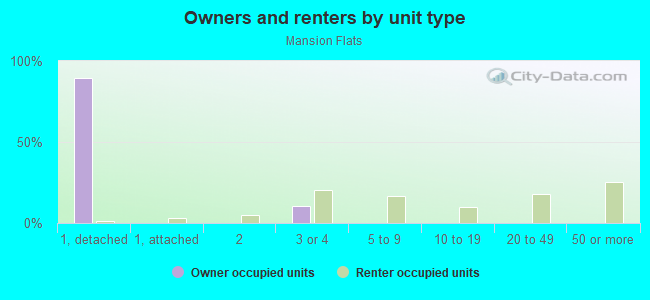
Owner-occupied
Renter-occupied

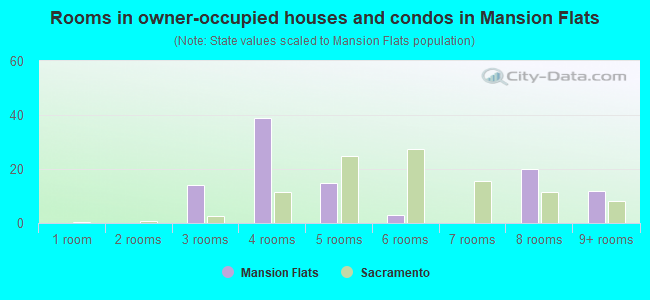
- Rooms in owner-occupied houses and condos in Mansion Flats
- 01 room
- 02 rooms
- 143 rooms
- 394 rooms
- 155 rooms
- 36 rooms
- 07 rooms
- 208 rooms
- 129+ rooms
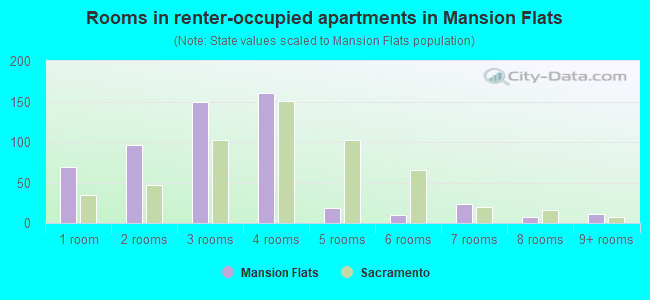
- Rooms in renter-occupied apartments in Mansion Flats
- 691 room
- 962 rooms
- 1493 rooms
- 1604 rooms
- 185 rooms
- 106 rooms
- 247 rooms
- 88 rooms
- 119+ rooms
Owner-occupied
Renter-occupied
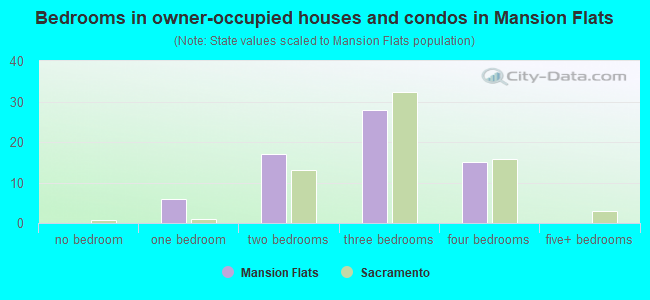
- Bedrooms in owner-occupied houses and condos in Mansion Flats
- 0no bedroom
- 61 bedroom
- 172 bedrooms
- 283 bedrooms
- 154 bedrooms
- 05+ bedrooms
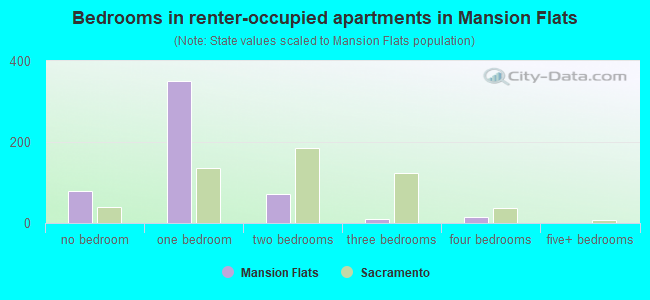
- Bedrooms in renter-occupied apartments in Mansion Flats
- 80no bedroom
- 3501 bedroom
- 712 bedrooms
- 113 bedrooms
- 154 bedrooms
- 05+ bedrooms
Average number of cars or other vehicles available in houses/condos:
Average number of cars or other vehicles available in apartments:
| This neighborhood: | 2.3 |
| Sacramento: | 2.1 |
Average number of cars or other vehicles available in apartments:
| Here: | 1.2 |
| city: | 1.5 |
Percentage of units with a mortgage:
| Mansion Flats: | 60.7% |
| Sacramento: | 69.5% |
Average estimated value of detached houses in 2022 (12.2% of all units):
| Mansion Flats: | $857,711 |
| Sacramento: | $494,234 |
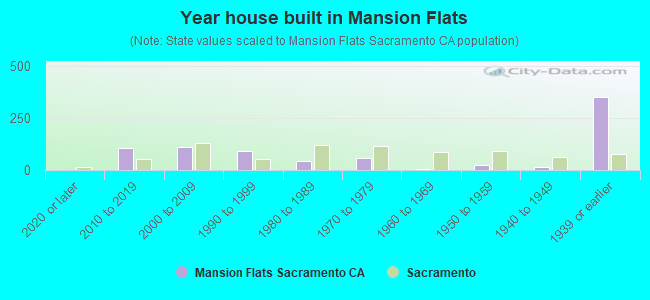
- Year house built in Mansion Flats
- 02020 or later
- 1082010 to 2019
- 1092000 to 2009
- 901990 to 1999
- 441980 to 1989
- 571970 to 1979
- 71960 to 1969
- 241950 to 1959
- 131940 to 1949
- 3511939 or earlier
City-data.com crime index for city in 2020 (higher means more crime):
| City: | 328.2 |
| U.S. average: | 219.5 |
Travel time to work (commute)
![Travel time to work (commute)]()
- 11Less than 5 minutes
- 225 to 9 minutes
- 4010 to 14 minutes
- 2615 to 19 minutes
- 3120 to 24 minutes
- 725 to 29 minutes
- 930 to 34 minutes
- 335 to 39 minutes
- 2245 to 59 minutes
- 860 to 89 minutes
- 390 or more minutes

Means of transportation to work
![Means of transportation to work]()
- 44.1%267Drove a car alone
- 5.8%35Carpooled
- 0.5%3Bus
- 5.6%34Bicycle
- 23.3%141Walked
- 2.3%14Other means
- 18.3%111Worked at home

Time leaving home to go to work
![Time leaving home to go to work]()
- 712:00 a.m. to 4:59 a.m.
- 15:00 a.m. to 5:29 a.m.
- 65:30 a.m. to 5:59 a.m.
- 86:30 a.m. to 6:59 a.m.
- 317:00 a.m. to 7:29 a.m.
- 287:30 a.m. to 7:59 a.m.
- 408:00 a.m. to 8:29 a.m.
- 58:30 a.m. to 8:59 a.m.
- 139:00 a.m. to 9:59 a.m.
- 510:00 a.m. to 10:59 a.m.
- 1212:00 p.m. to 3:59 p.m.
- 104:00 p.m. to 11:59 p.m.

Occupations of males:
- Percentage of males in management occupations (except farmers):
Here: 6.4% city: 9.5%
- Percentage of males in business and financial operations occupations:
Here: 2.0% city: 5.8%
- Percentage of males in computer and mathematical occupations:
Here: 4.5% city: 5.4%
- Percentage of males in architecture and engineering occupations:
Here: 2.0% city: 3.2%
- Percentage of males in legal occupations:
Here: 3.1% city: 2.0%
- Percentage of males in education, training, and library occupations:
Here: 9.6% city: 3.8%
- Percentage of males in arts, design, entertainment, sports, and media occupations:
Here: 3.1% city: 2.1%
- Percentage of males in healthcare practitioners and technical occupations:
Here: 4.9% city: 3.7%
- Percentage of males in service occupations:
Here: 10.9% city: 15.5%
- Percentage of males in sales and office occupations:
Here: 35.5% city: 16.4%
- Percentage of males in production occupations:
Here: 14.0% city: 4.8%
Occupations of females:
- Percentage of females in management occupations (except farmers):
Here: 7.1% city: 9.7%
- Percentage of females in business and financial operations occupations:
Here: 10.4% city: 8.0%
- Percentage of females in computer and mathematical occupations:
Here: 13.8% city: 3.6%
- Percentage of females in life, physical, and social science occupations:
Here: 3.0% city: 2.1%
- Percentage of females in legal occupations:
Here: 6.9% city: 2.5%
- Percentage of females in education, training, and library occupations:
Here: 2.4% city: 7.1%
- Percentage of females in arts, design, entertainment, sports, and media occupations:
Here: 3.6% city: 2.5%
- Percentage of females in healthcare practitioners and technical occupations:
Here: 17.5% city: 7.4%
- Percentage of females in service occupations:
Here: 10.4% city: 20.0%
- Percentage of females in sales and office occupations:
Here: 24.0% city: 25.9%
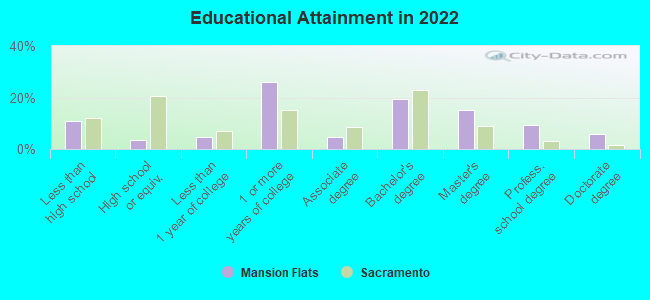
Education in this neighborhood (subdivision or community):
- Percentage of people 3 years and older in K-12 schools:
Mansion Flats: 2.7% Sacramento: 15.8%
- Percentage of people 3 years and older in undergraduate colleges:
Mansion Flats: 6.0% Sacramento: 6.8%
- Percentage of people 3 years and older in grad. or professional schools:
Mansion Flats: 8.2% Sacramento: 2.2%
- Percentage of students K-12 enrolled in private schools:
Mansion Flats: 66.7% Sacramento: 9.8%
Percentage of population below poverty level:
| Mansion Flats: | 17.0% |
| Sacramento: | 13.7% |
Median year owner moved in (as recorded in 2022):
Median year renter moved in (as recorded in 2022):
| Mansion Flats: | 3962 |
| Sacramento: | 2012 |
Median year renter moved in (as recorded in 2022):
| Mansion Flats: | 3985 |
| Sacramento: | 2019 |
Percentage of married-couple families with both working:
| Mansion Flats: | 100.0% |
| Sacramento: | 67.3% |
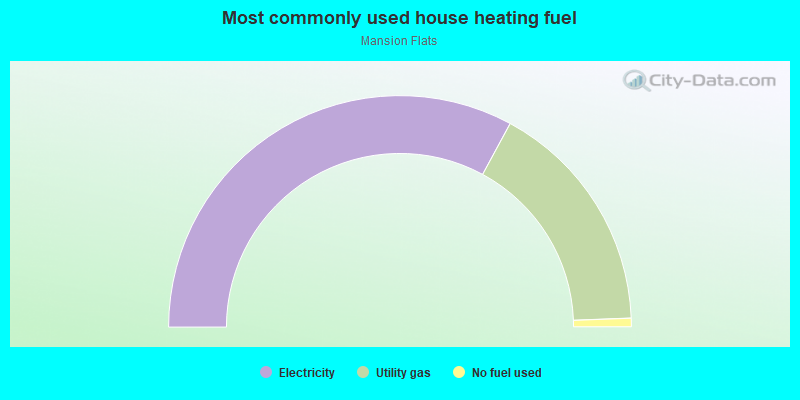
- 65.8%Electricity
- 33.0%Utility gas
- 1.2%No fuel used
Highways in this neighborhood:
State Hwy 160 (15th St)
Length: 0.33 miles
Direction: SW-NE
Address range: 500 to 899
Direction: SW-NE
Address range: 500 to 899
State Hwy 160 (F St)
Length: 0.30 miles
Direction: E-W
Address range: 1206 to 1499
Direction: E-W
Address range: 1206 to 1499
Roads and streets:
14th St
Length: 0.45 miles
Direction: SW-NE
Address range: 340 to 899
Direction: SW-NE
Address range: 340 to 899
13th St
Length: 0.45 miles
Direction: SW-NE
Address range: 346 to 899
Direction: SW-NE
Address range: 346 to 899
E St
Length: 0.30 miles
Direction: E-W
Address range: 1208 to 1499
Direction: E-W
Address range: 1208 to 1499
I St
Length: 0.25 miles
Direction: E-W
Address range: 1244 to 1499
Direction: E-W
Address range: 1244 to 1499
H St
Length: 0.19 miles
Direction: E-W
Address range: 1300 to 1499
Direction: E-W
Address range: 1300 to 1499
G St
Length: 0.19 miles
Direction: E-W
Address range: 1300 to 1499
Direction: E-W
Address range: 1300 to 1499
D St
Length: 0.09 miles
Direction: E-W
Address range: 1300 to 1399
Direction: E-W
Address range: 1300 to 1399
Railroad features:
Union Pacific
Length: 0.16 miles
Direction: SW-NE
Direction: SW-NE