Milton-Montford neighborhood in Baltimore, Maryland (MD), 21205 detailed profile
Settings
X

Business Search - 14 Million verified businesses
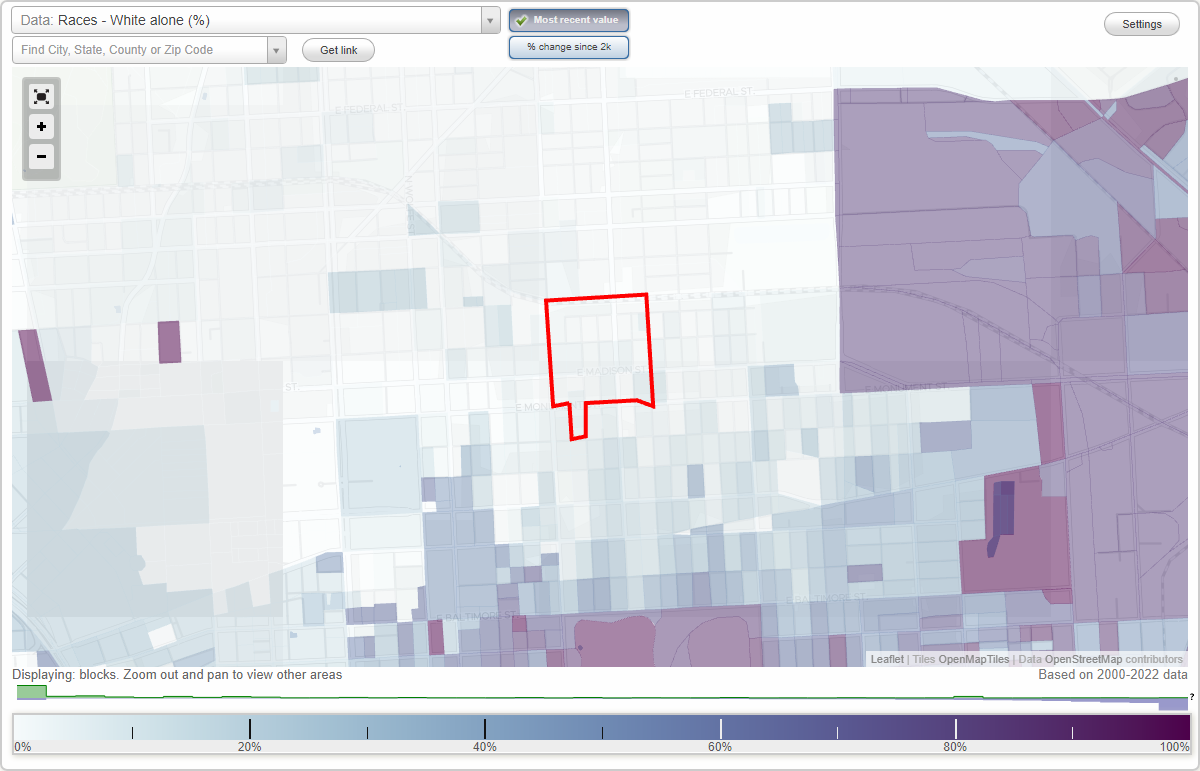
Area: 0.058 square miles
Population: 2,027
Population density:
| Milton-Montford: | 34,827 people per square mile |
| Baltimore: | 7,053 people per square mile |

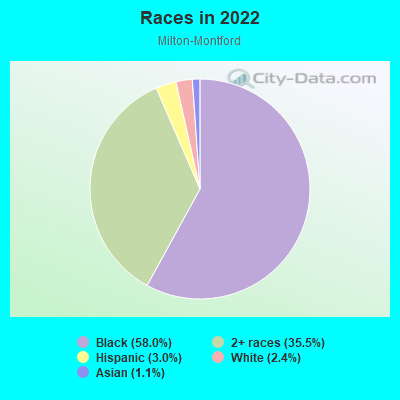
- 1,22558.0%Black
- 74935.5%Two or more races
- 643.0%Hispanic or Latino
- 502.4%White
- 241.1%Asian
Distribution of median household income
![Distribution of median household income]()
- 153Less than $10,000
- 107$10,000 to $19,999
- 121$20,000 to $29,999
- 149$30,000 to $39,999
- 102$40,000 to $49,999
- 22$50,000 to $59,999
- 50$60,000 to $74,999
- 44$75,000 to $99,999
- 79$100,000 to $124,999
- 24$125,000 to $149,999
- 44$150,000 to $199,999
- 121$200,000 or more

Distribution of owner-occupied house/condo value
![Distribution of owner-occupied house/condo value]()
- 361Less than $50,000
- 377$50,000 to $99,999
- 52$100,000 to $149,999
- 153$150,000 to $199,999
- 40$200,000 to $249,999
- 58$250,000 to $299,999
- 30$300,000 to $399,999
- 3$400,000 to $499,999
- 30$500,000 to $749,999

Distribution of rent paid by renters
![Distribution of rent paid by renters]()
- 43Less than $100
- 88$100 to $199
- 37$200 to $299
- 29$300 to $399
- 130$400 to $499
- 143$500 to $599
- 26$600 to $699
- 26$700 to $799
- 77$800 to $899
- 12$900 to $999
- 85$1,000 to $1,249
- 98$1,250 to $1,499
- 69$1,500 to $1,999
- 77$2,000 or more

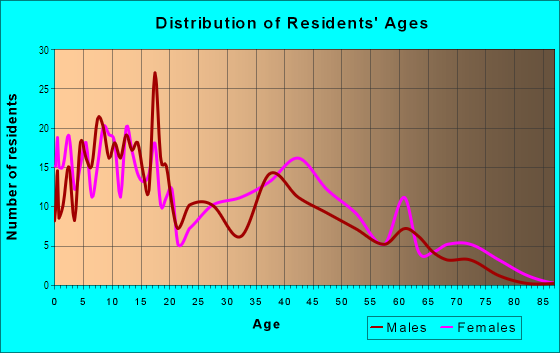
| Males: | 756 |
| Females: | 1,271 |
Males:
| This neighborhood: | 28.6 years |
| Whole city: | 35.0 years |
| This neighborhood: | 33.8 years |
| Whole city: | 38.2 years |
Average household size:
| Milton-Montford: | 8.2 people |
| Baltimore: | 2.2 people |
Percentage of family households:
| Milton-Montford: | 60.8% |
| Baltimore: | 34.2% |
| Here: | 24.6% |
| Baltimore: | 23.3% |
Percentage of married-couple families with children (among all households):
| Milton-Montford: | 7.6% |
| Baltimore: | 22.4% |
Percentage of single-mother households (among all households):
| Milton-Montford: | 19.1% |
| Baltimore: | 18.7% |
Percentage of never married males 15 years old and over:
Percentage of never married females 15 years old and over:
| Milton-Montford: | 21.0% |
| Baltimore: | 25.1% |
Percentage of never married females 15 years old and over:
| Milton-Montford: | 27.8% |
| city: | 27.5% |
Percentage of people that speak English not well or not at all:
| Milton-Montford: | 13.5% |
| Baltimore: | 2.3% |
Percentage of people born in this state:
Percentage of people born in another U.S. state:
Percentage of native residents but born outside the U.S.:
Percentage of foreign born residents:
| Here: | 71.4% |
| Baltimore: | 64.4% |
Percentage of people born in another U.S. state:
| Milton-Montford: | 9.8% |
| Baltimore: | 25.0% |
Percentage of native residents but born outside the U.S.:
| Here: | 5.3% |
| city: | 0.9% |
Percentage of foreign born residents:
| Here: | 13.5% |
| Baltimore: | 9.7% |
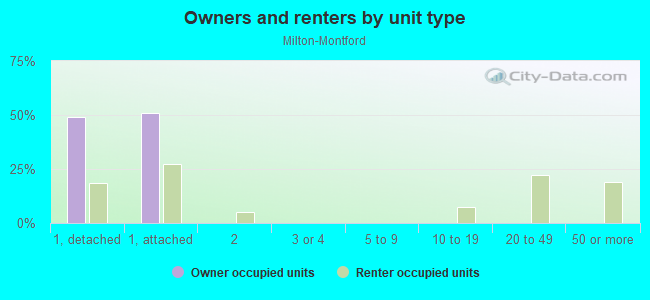
Owner-occupied
Renter-occupied

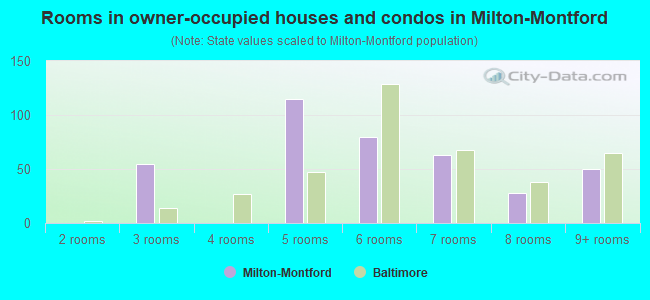
- Rooms in owner-occupied houses and condos in Milton-Montford
- 01 room
- 02 rooms
- 553 rooms
- 04 rooms
- 1155 rooms
- 806 rooms
- 637 rooms
- 288 rooms
- 509+ rooms
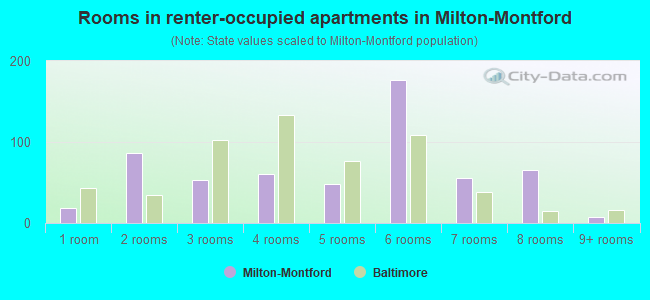
- Rooms in renter-occupied apartments in Milton-Montford
- 181 room
- 862 rooms
- 533 rooms
- 604 rooms
- 485 rooms
- 1776 rooms
- 557 rooms
- 658 rooms
- 89+ rooms
Owner-occupied
Renter-occupied
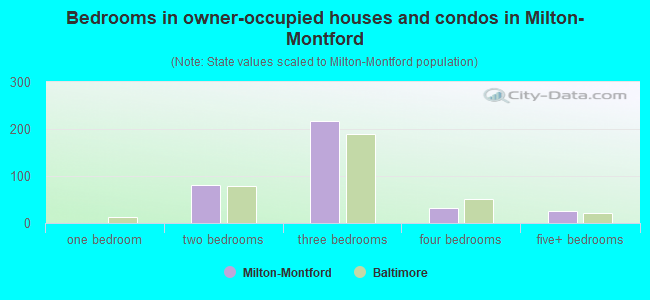
- Bedrooms in owner-occupied houses and condos in Milton-Montford
- 0no bedroom
- 01 bedroom
- 802 bedrooms
- 2173 bedrooms
- 324 bedrooms
- 265+ bedrooms
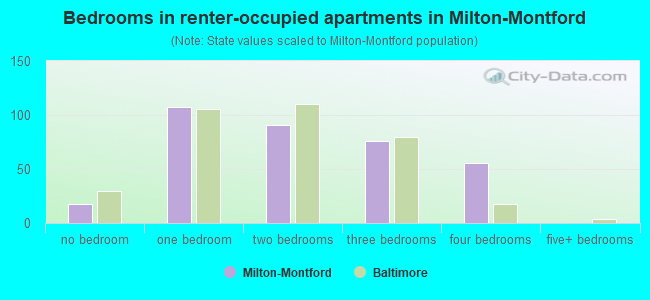
- Bedrooms in renter-occupied apartments in Milton-Montford
- 18no bedroom
- 1071 bedroom
- 912 bedrooms
- 763 bedrooms
- 564 bedrooms
- 05+ bedrooms
Average number of cars or other vehicles available in houses/condos:
Average number of cars or other vehicles available in apartments:
| This neighborhood: | 1.0 |
| Baltimore: | 1.5 |
Average number of cars or other vehicles available in apartments:
| Here: | |
| city: |
Percentage of units with a mortgage:
| Milton-Montford: | 35.5% |
| Baltimore: | 64.3% |
Average estimated value of townhouses or other attached units in 2022 (79.5% of all units):
| This neighborhood: | $146,393 |
| city: | $206,258 |
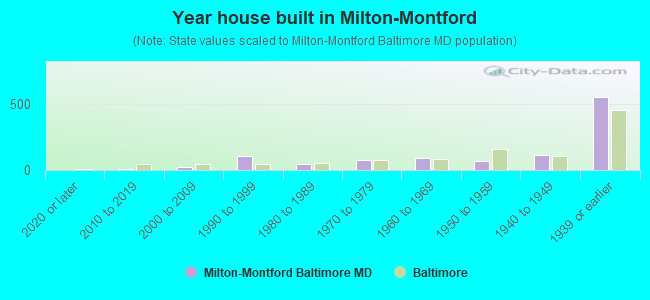
- Year house built in Milton-Montford
- 02020 or later
- 72010 to 2019
- 252000 to 2009
- 1021990 to 1999
- 481980 to 1989
- 751970 to 1979
- 891960 to 1969
- 691950 to 1959
- 1121940 to 1949
- 5491939 or earlier
Travel time to work (commute)
![Travel time to work (commute)]()
- 14Less than 5 minutes
- 185 to 9 minutes
- 2210 to 14 minutes
- 11315 to 19 minutes
- 8320 to 24 minutes
- 2225 to 29 minutes
- 4630 to 34 minutes
- 235 to 39 minutes
- 1540 to 44 minutes
- 3445 to 59 minutes
- 5860 to 89 minutes
- 4590 or more minutes

Means of transportation to work
![Means of transportation to work]()
- 30.7%150Drove a car alone
- 26.4%129Carpooled
- 31.8%155Bus
- 5.7%28Long-distance train or commuter rail
- 3.9%19Taxi
- 24.2%118Walked
- 10.9%53Other means
- 21.5%105Worked at home

Time leaving home to go to work
![Time leaving home to go to work]()
- 2312:00 a.m. to 4:59 a.m.
- 215:00 a.m. to 5:29 a.m.
- 315:30 a.m. to 5:59 a.m.
- 616:00 a.m. to 6:29 a.m.
- 166:30 a.m. to 6:59 a.m.
- 307:00 a.m. to 7:29 a.m.
- 197:30 a.m. to 7:59 a.m.
- 478:00 a.m. to 8:29 a.m.
- 408:30 a.m. to 8:59 a.m.
- 129:00 a.m. to 9:59 a.m.
- 1910:00 a.m. to 10:59 a.m.
- 1311:00 a.m. to 11:59 a.m.
- 5312:00 p.m. to 3:59 p.m.
- 744:00 p.m. to 11:59 p.m.

Occupations of males:
- Percentage of males in computer and mathematical occupations:
Here: 13.4% city: 6.1%
- Percentage of males in community and social services occupations:
Here: 9.9% city: 1.6%
- Percentage of males in service occupations:
Here: 41.0% city: 14.7%
- Percentage of males in sales and office occupations:
Here: 24.3% city: 14.2%
- Percentage of males in construction, extraction, and maintenance occupations:
Here: 2.7% city: 5.6%
- Percentage of males in transportation occupations:
Here: 2.6% city: 6.8%
- Percentage of males in material moving occupations:
Here: 4.9% city: 7.0%
Occupations of females:
- Percentage of females in management occupations (except farmers):
Here: 1.5% city: 10.1%
- Percentage of females in life, physical, and social science occupations:
Here: 2.0% city: 2.5%
- Percentage of females in community and social services occupations:
Here: 10.2% city: 3.6%
- Percentage of females in legal occupations:
Here: 2.1% city: 1.8%
- Percentage of females in education, training, and library occupations:
Here: 20.2% city: 10.7%
- Percentage of females in arts, design, entertainment, sports, and media occupations:
Here: 20.6% city: 2.4%
- Percentage of females in healthcare practitioners and technical occupations:
Here: 17.2% city: 9.8%
- Percentage of females in service occupations:
Here: 6.9% city: 20.4%
- Percentage of females in sales and office occupations:
Here: 17.3% city: 22.3%
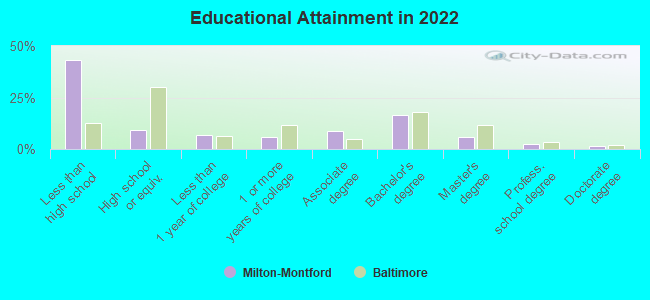
Education in this neighborhood (subdivision or community):
- Percentage of people 3 years and older in K-12 schools:
Milton-Montford: 42.2% Baltimore: 14.7%
- Percentage of people 3 years and older in undergraduate colleges:
Milton-Montford: 4.6% Baltimore: 6.0%
- Percentage of people 3 years and older in grad. or professional schools:
Milton-Montford: 12.4% Baltimore: 2.8%
- Percentage of students K-12 enrolled in private schools:
Milton-Montford: 14.4% Baltimore: 12.7%
Percentage of population below poverty level:
| Milton-Montford: | 35.9% |
| Baltimore: | 18.5% |
Median year renter moved in (as recorded in 2022):
| Milton-Montford: | 2015 |
| Baltimore: | 2019 |
Percentage of married-couple families with both working:
| Milton-Montford: | 10.7% |
| Baltimore: | 79.2% |
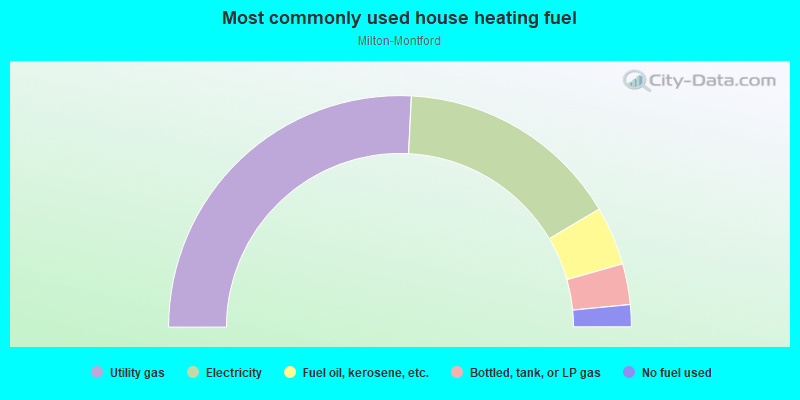
- 51.6%Utility gas
- 31.4%Electricity
- 8.2%Fuel oil, kerosene, etc.
- 5.7%Bottled, tank, or LP gas
- 3.1%No fuel used
Roads and streets:
N Montford Ave
Length: 0.25 miles
Direction: N-S
Address range: 610 to 999
Direction: N-S
Address range: 610 to 999
N Luzerne Ave
Length: 0.24 miles
Direction: N-S
Address range: 700 to 1013
Direction: N-S
Address range: 700 to 1013
E Madison St
Length: 0.24 miles
Direction: E-W
Address range: 2310 to 2599
Direction: E-W
Address range: 2310 to 2599
Ashland Ave
Length: 0.24 miles
Direction: E-W
Address range: 2310 to 2599
Direction: E-W
Address range: 2310 to 2599
E Eager St
Length: 0.24 miles
Direction: E-W
Address range: 2315 to 2578
Direction: E-W
Address range: 2315 to 2578
N Bradford St
Length: 0.17 miles
Direction: N-S
Address range: 710 to 999
Direction: N-S
Address range: 710 to 999
N Milton Ave
Length: 0.17 miles
Direction: N-S
Address range: 800 to 1015
Direction: N-S
Address range: 800 to 1015
N Port St
Length: 0.13 miles
Direction: N-S
Address range: 800 to 999
Direction: N-S
Address range: 800 to 999
N Rose St
Length: 0.13 miles
Direction: N-S
Address range: 800 to 999
Direction: N-S
Address range: 800 to 999
Dimling Ct
Length: 0.05 miles
Directions: E-W, N-S
Address range: 600 to 699
Directions: E-W, N-S
Address range: 600 to 699
Milliman St
Length: 0.05 miles
Direction: E-W
Address range: 2300 to 2399
Direction: E-W
Address range: 2300 to 2399
Railroad features:
Penn Central RR
Length: 0.19 miles
Direction: E-W
Direction: E-W