Montclair neighborhood in Lexington, Kentucky (KY), 40502 detailed profile
Settings
X


Area: 0.106 square miles
Population: 509
Population density: 4,812 people per square mile

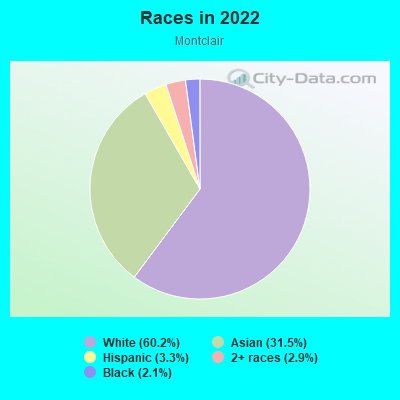
- 31260.2%White
- 16331.5%Asian
- 173.3%Hispanic or Latino
- 152.9%Two or more races
- 112.1%Black
Median household income in 2022:
| Montclair: | $57,906 |
| Kentucky: | $59,341 |
Distribution of median household income
![Distribution of median household income]()
- 23Less than $10,000
- 19$10,000 to $19,999
- 45$20,000 to $29,999
- 16$30,000 to $39,999
- 39$40,000 to $49,999
- 53$50,000 to $59,999
- 16$60,000 to $74,999
- 11$75,000 to $99,999
- 21$100,000 to $124,999
- 5$125,000 to $149,999
- 13$150,000 to $199,999
- 26$200,000 or more

Distribution of owner-occupied house/condo value
![Distribution of owner-occupied house/condo value]()
- 1Less than $50,000
- 4$50,000 to $99,999
- 4$100,000 to $149,999
- 6$150,000 to $199,999
- 7$200,000 to $249,999
- 5$250,000 to $299,999
- 35$300,000 to $399,999
- 11$400,000 to $499,999
- 15$500,000 to $749,999
- 4$750,000 to $999,999
- 14$1,000,000 or more

Distribution of rent paid by renters
![Distribution of rent paid by renters]()
- 8$200 to $299
- 5$300 to $399
- 7$400 to $499
- 12$500 to $599
- 93$600 to $699
- 19$700 to $799
- 64$800 to $899
- 10$900 to $999
- 4$1,000 to $1,249
- 8$1,250 to $1,499
- 47$1,500 to $1,999
- 47$2,000 or more

Median rent in 2022:
| Montclair: | $765 |
| Kentucky: | $702 |
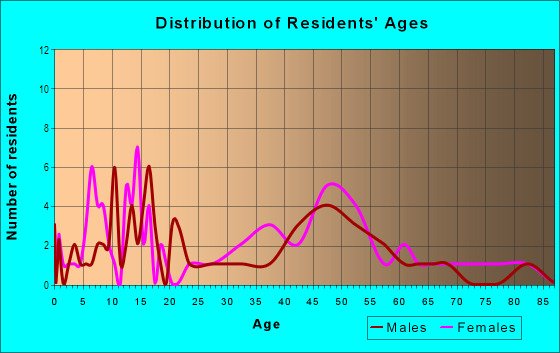
| Males: | 252 |
| Females: | 256 |
| Males: | 29.3 years |
| Females: | 30.6 years |
Average household size:
| Montclair: | 2.0 people |
| Kentucky: | 2.4 people |
Percentage of family households:
| Montclair: | 44.7% |
| Kentucky: | 45.9% |
| Here: | 46.2% |
| Kentucky: | 47.1% |
Percentage of married-couple families with children (among all households):
| Montclair: | 49.2% |
| Kentucky: | 58.4% |
Percentage of single-mother households (among all households):
| Montclair: | 1.8% |
| Kentucky: | 9.3% |
Percentage of never married males 15 years old and over:
Percentage of never married females 15 years old and over:
| Montclair: | 22.8% |
| Kentucky: | 16.3% |
Percentage of never married females 15 years old and over:
| Montclair: | 16.0% |
| Kentucky: | 13.5% |
Percentage of people that speak English not well or not at all:
| Montclair: | 1.5% |
| Kentucky: | 1.1% |
Percentage of people born in this state:
Percentage of people born in another U.S. state:
Percentage of native residents but born outside the U.S.:
Percentage of foreign born residents:
| Here: | 48.1% |
| Kentucky: | 67.2% |
Percentage of people born in another U.S. state:
| Montclair: | 31.0% |
| Kentucky: | 28.0% |
Percentage of native residents but born outside the U.S.:
| Here: | 0.9% |
| Kentucky: | 0.8% |
Percentage of foreign born residents:
| Here: | 20.0% |
| Kentucky: | 4.0% |
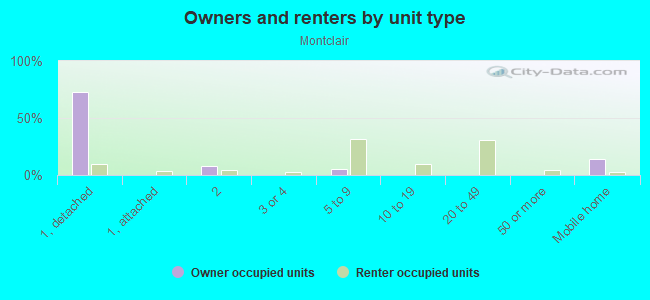
Owner-occupied
Renter-occupied

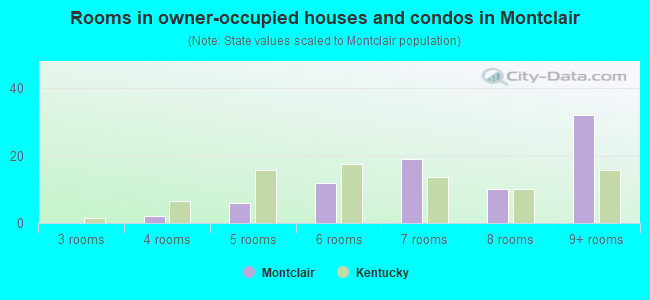
- Rooms in owner-occupied houses and condos in Montclair
- 01 room
- 02 rooms
- 03 rooms
- 24 rooms
- 65 rooms
- 126 rooms
- 197 rooms
- 108 rooms
- 329+ rooms
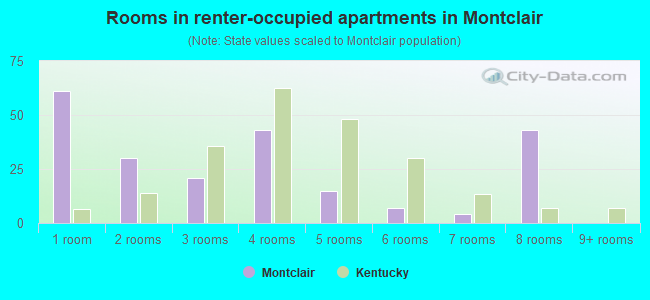
- Rooms in renter-occupied apartments in Montclair
- 611 room
- 302 rooms
- 213 rooms
- 434 rooms
- 155 rooms
- 76 rooms
- 47 rooms
- 438 rooms
- 09+ rooms
Owner-occupied
Renter-occupied
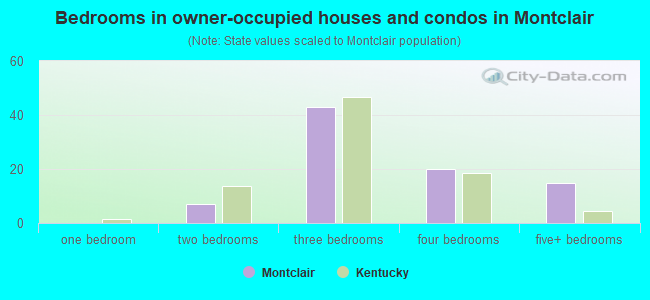
- Bedrooms in owner-occupied houses and condos in Montclair
- 0no bedroom
- 01 bedroom
- 72 bedrooms
- 433 bedrooms
- 204 bedrooms
- 155+ bedrooms
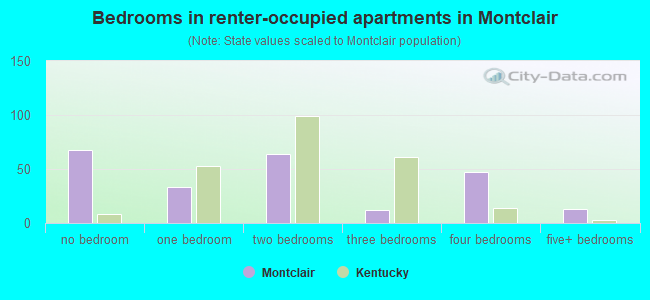
- Bedrooms in renter-occupied apartments in Montclair
- 68no bedroom
- 331 bedroom
- 642 bedrooms
- 123 bedrooms
- 474 bedrooms
- 135+ bedrooms
Average number of cars or other vehicles available in houses/condos:
Average number of cars or other vehicles available in apartments:
| This neighborhood: | 2.0 |
| Kentucky: | 2.1 |
Average number of cars or other vehicles available in apartments:
| Here: | 0.9 |
| Kentucky: | 1.3 |
Percentage of units with a mortgage:
| Montclair: | 52.1% |
| Kentucky: | 56.7% |
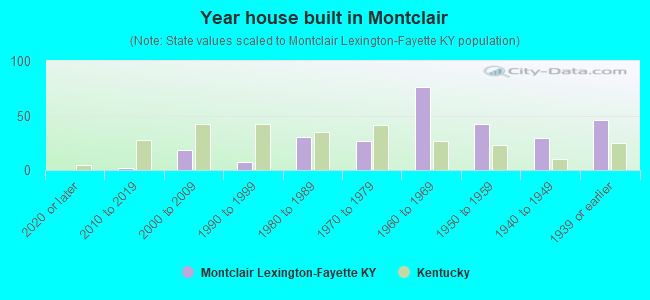
- Year house built in Montclair
- 02020 or later
- 22010 to 2019
- 182000 to 2009
- 71990 to 1999
- 301980 to 1989
- 271970 to 1979
- 761960 to 1969
- 421950 to 1959
- 291940 to 1949
- 461939 or earlier
Travel time to work (commute)
![Travel time to work (commute)]()
- 4Less than 5 minutes
- 415 to 9 minutes
- 5910 to 14 minutes
- 5115 to 19 minutes
- 3220 to 24 minutes
- 1225 to 29 minutes
- 1430 to 34 minutes
- 135 to 39 minutes
- 440 to 44 minutes
- 445 to 59 minutes
- 3160 to 89 minutes
- 2690 or more minutes

Means of transportation to work
![Means of transportation to work]()
- 38.8%102Drove a car alone
- 2.3%6Carpooled
- 28.9%76Bus
- 0.4%1Motorcycle
- 6.1%16Bicycle
- 18.6%49Walked
- 8.7%23Other means
- 10.3%27Worked at home

Time leaving home to go to work
![Time leaving home to go to work]()
- 212:00 a.m. to 4:59 a.m.
- 15:00 a.m. to 5:29 a.m.
- 35:30 a.m. to 5:59 a.m.
- 76:00 a.m. to 6:29 a.m.
- 76:30 a.m. to 6:59 a.m.
- 187:00 a.m. to 7:29 a.m.
- 367:30 a.m. to 7:59 a.m.
- 358:00 a.m. to 8:29 a.m.
- 218:30 a.m. to 8:59 a.m.
- 419:00 a.m. to 9:59 a.m.
- 610:00 a.m. to 10:59 a.m.
- 1211:00 a.m. to 11:59 a.m.
- 2812:00 p.m. to 3:59 p.m.
- 104:00 p.m. to 11:59 p.m.

Occupations of males:
- Percentage of males in management occupations (except farmers):
Here: 3.9% Kentucky: 10.7%
- Percentage of males in business and financial operations occupations:
Here: 2.2% Kentucky: 4.0%
- Percentage of males in computer and mathematical occupations:
Here: 3.4% Kentucky: 3.0%
- Percentage of males in architecture and engineering occupations:
Here: 2.4% Kentucky: 2.7%
- Percentage of males in life, physical, and social science occupations:
Here: 13.6% Kentucky: 0.8%
- Percentage of males in community and social services occupations:
Here: 2.4% Kentucky: 1.4%
- Percentage of males in legal occupations:
Here: 3.9% Kentucky: 0.8%
- Percentage of males in education, training, and library occupations:
Here: 45.9% Kentucky: 2.9%
- Percentage of males in arts, design, entertainment, sports, and media occupations:
Here: 2.5% Kentucky: 1.3%
- Percentage of males in healthcare practitioners and technical occupations:
Here: 5.6% Kentucky: 3.1%
- Percentage of males in sales and office occupations:
Here: 5.6% Kentucky: 14.0%
- Percentage of males in construction, extraction, and maintenance occupations:
Here: 1.8% Kentucky: 8.7%
- Percentage of males in production occupations:
Here: 7.9% Kentucky: 12.3%
- Percentage of males in transportation occupations:
Here: 8.1% Kentucky: 6.7%
Occupations of females:
- Percentage of females in management occupations (except farmers):
Here: 11.9% Kentucky: 8.4%
- Percentage of females in business and financial operations occupations:
Here: 1.1% Kentucky: 5.3%
- Percentage of females in computer and mathematical occupations:
Here: 2.4% Kentucky: 1.2%
- Percentage of females in architecture and engineering occupations:
Here: 1.9% Kentucky: 0.6%
- Percentage of females in life, physical, and social science occupations:
Here: 3.2% Kentucky: 0.8%
- Percentage of females in legal occupations:
Here: 2.3% Kentucky: 1.1%
- Percentage of females in education, training, and library occupations:
Here: 50.5% Kentucky: 9.3%
- Percentage of females in healthcare practitioners and technical occupations:
Here: 4.3% Kentucky: 11.8%
- Percentage of females in service occupations:
Here: 4.8% Kentucky: 19.1%
- Percentage of females in sales and office occupations:
Here: 12.8% Kentucky: 27.8%
- Percentage of females in production occupations:
Here: 4.5% Kentucky: 5.2%
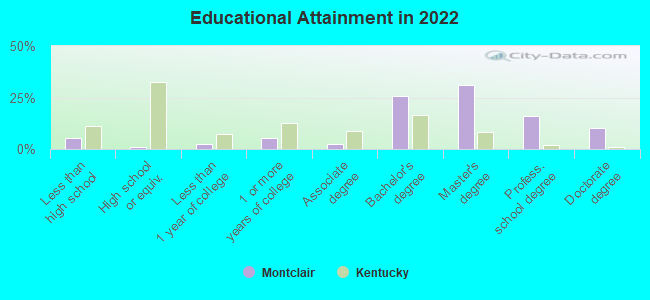
Education in this neighborhood (subdivision or community):
- Percentage of people 3 years and older in K-12 schools:
Montclair: 12.0% Kentucky: 16.5%
- Percentage of people 3 years and older in undergraduate colleges:
Montclair: 6.2% Kentucky: 4.1%
- Percentage of people 3 years and older in grad. or professional schools:
Montclair: 33.7% Kentucky: 1.3%
- Percentage of students K-12 enrolled in private schools:
Montclair: 51.7% Kentucky: 16.3%
Percentage of population below poverty level:
| Montclair: | 19.1% |
| Kentucky: | 16.5% |
Median year owner moved in (as recorded in 2022):
Median year renter moved in (as recorded in 2022):
| Montclair: | 2000 |
| Kentucky: | 2010 |
Median year renter moved in (as recorded in 2022):
| Montclair: | 2018 |
| Kentucky: | 2020 |
Percentage of married-couple families with both working:
| Montclair: | 41.8% |
| Kentucky: | 70.7% |
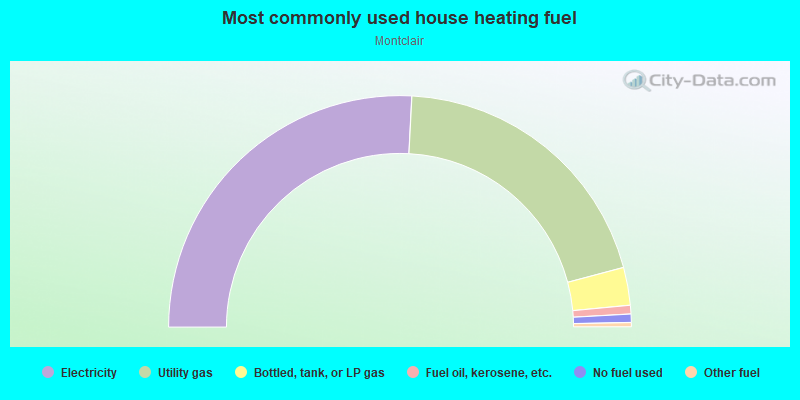
- 51.7%Electricity
- 40.1%Utility gas
- 5.3%Bottled, tank, or LP gas
- 1.2%Fuel oil, kerosene, etc.
- 1.2%No fuel used
- 0.6%Other fuel
Roads and streets:
Montclair Dr
Length: 0.50 miles
Directions: E-W, SE-NW
Address range: 600 to 899
Directions: E-W, SE-NW
Address range: 600 to 899
Cooper Dr
Length: 0.31 miles
Directions: E-W, SE-NW
Address range: 632 to 799
Directions: E-W, SE-NW
Address range: 632 to 799
Summit Dr
Length: 0.25 miles
Directions: E-W, N-S, SE-NW, SW-NE
Address range: 1202 to 1299
Directions: E-W, N-S, SE-NW, SW-NE
Address range: 1202 to 1299
Scoville Rd
Length: 0.23 miles
Direction: SW-NE
Address range: 1200 to 1299
Direction: SW-NE
Address range: 1200 to 1299
Kastle Rd
Length: 0.21 miles
Directions: N-S, SW-NE
Address range: 1200 to 1298
Directions: N-S, SW-NE
Address range: 1200 to 1298
Eldemere Rd
Length: 0.17 miles
Direction: SW-NE
Address range: 1200 to 1299
Direction: SW-NE
Address range: 1200 to 1299