Ninth Street neighborhood in Boulder, Colorado (CO), 80302 detailed profile
Settings
X


Business Search - 14 Million verified businesses
Area: 0.135 square miles
Population: 1,776
Population density:
| Ninth Street: | 13,131 people per square mile |
| Boulder: | 4,328 people per square mile |

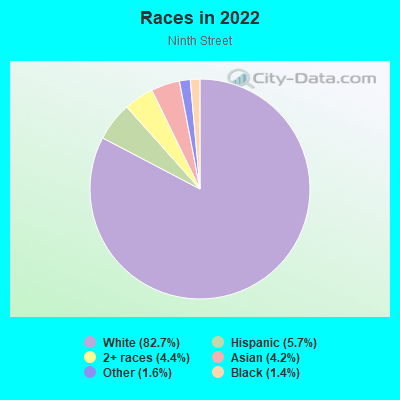
- 1,53082.7%White
- 1065.7%Hispanic or Latino
- 814.4%Two or more races
- 784.2%Asian
- 291.6%Some other race
- 251.4%Black
Distribution of median household income
![Distribution of median household income]()
- 169Less than $10,000
- 146$10,000 to $19,999
- 123$20,000 to $29,999
- 58$30,000 to $39,999
- 115$40,000 to $49,999
- 77$50,000 to $59,999
- 24$60,000 to $74,999
- 64$75,000 to $99,999
- 46$100,000 to $124,999
- 29$125,000 to $149,999
- 28$150,000 to $199,999
- 97$200,000 or more

Distribution of owner-occupied house/condo value
![Distribution of owner-occupied house/condo value]()
- 10$50,000 to $99,999
- 2$100,000 to $149,999
- 31$150,000 to $199,999
- 6$300,000 to $399,999
- 34$400,000 to $499,999
- 72$500,000 to $749,999
- 26$750,000 to $999,999
- 158$1,000,000 or more

Distribution of rent paid by renters
![Distribution of rent paid by renters]()
- 1$100 to $199
- 5$200 to $299
- 3$300 to $399
- 20$400 to $499
- 54$500 to $599
- 4$800 to $899
- 14$900 to $999
- 177$1,000 to $1,249
- 125$1,250 to $1,499
- 115$1,500 to $1,999
- 258$2,000 or more

Median rent in 2022:
| Ninth Street: | $2,529 |
| Boulder: | $1,700 |
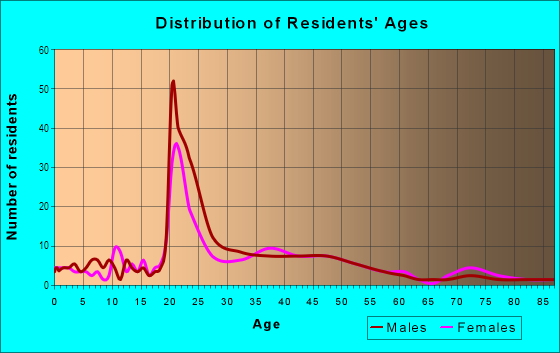
| Males: | 825 |
| Females: | 951 |
Males:
| This neighborhood: | 31.4 years |
| Whole city: | 28.3 years |
| This neighborhood: | 30.1 years |
| Whole city: | 29.2 years |
Average household size:
| Ninth Street: | 2.8 people |
| Boulder: | 2.1 people |
Percentage of family households:
| Ninth Street: | 18.7% |
| Boulder: | 26.9% |
| Here: | 20.3% |
| Boulder: | 30.4% |
Percentage of married-couple families with children (among all households):
| Ninth Street: | 35.0% |
| Boulder: | 32.8% |
Percentage of single-mother households (among all households):
| Ninth Street: | 0.8% |
| Boulder: | 6.3% |
Percentage of never married males 15 years old and over:
Percentage of never married females 15 years old and over:
| Ninth Street: | 36.9% |
| Boulder: | 32.7% |
Percentage of never married females 15 years old and over:
| Ninth Street: | 42.2% |
| city: | 28.3% |
Percentage of people that speak English not well or not at all:
| Ninth Street: | 0.0% |
| Boulder: | 1.0% |
Percentage of people born in this state:
Percentage of people born in another U.S. state:
Percentage of native residents but born outside the U.S.:
Percentage of foreign born residents:
| Here: | 38.3% |
| Boulder: | 28.3% |
Percentage of people born in another U.S. state:
| Ninth Street: | 54.8% |
| Boulder: | 60.5% |
Percentage of native residents but born outside the U.S.:
| Here: | 1.2% |
| city: | 2.1% |
Percentage of foreign born residents:
| Here: | 5.7% |
| Boulder: | 9.1% |
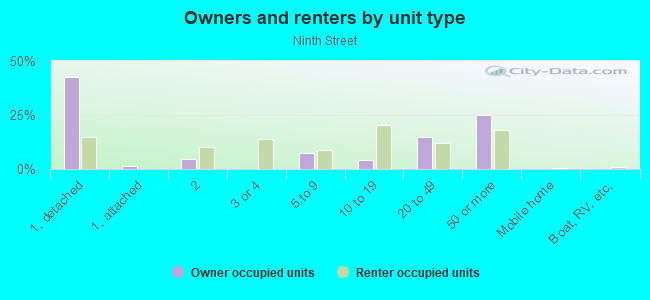
Owner-occupied
Renter-occupied

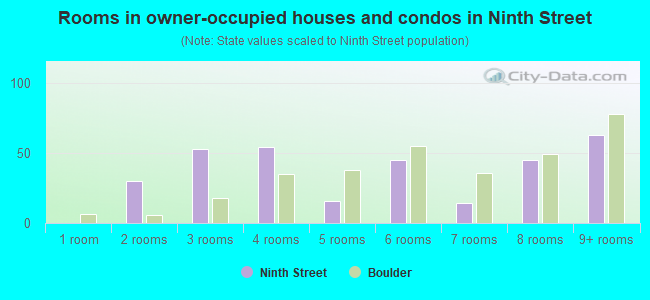
- Rooms in owner-occupied houses and condos in Ninth Street
- 01 room
- 302 rooms
- 533 rooms
- 544 rooms
- 165 rooms
- 456 rooms
- 147 rooms
- 458 rooms
- 639+ rooms
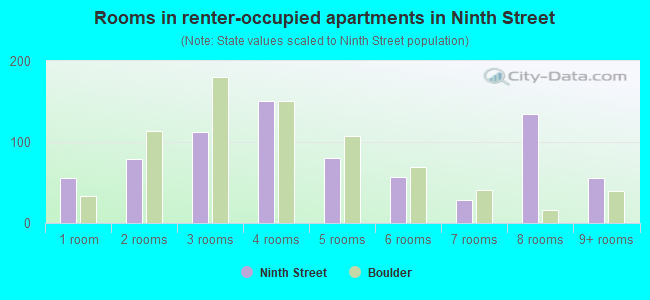
- Rooms in renter-occupied apartments in Ninth Street
- 551 room
- 792 rooms
- 1123 rooms
- 1514 rooms
- 805 rooms
- 576 rooms
- 287 rooms
- 1348 rooms
- 559+ rooms
Owner-occupied
Renter-occupied
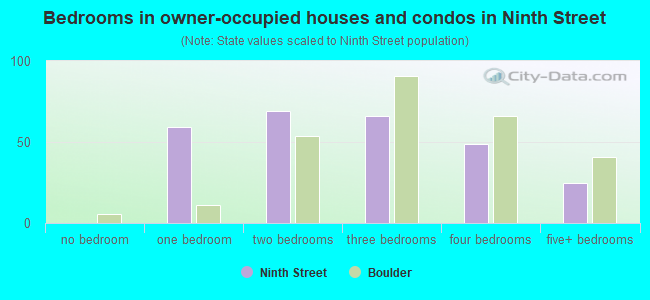
- Bedrooms in owner-occupied houses and condos in Ninth Street
- 0no bedroom
- 591 bedroom
- 692 bedrooms
- 663 bedrooms
- 494 bedrooms
- 255+ bedrooms
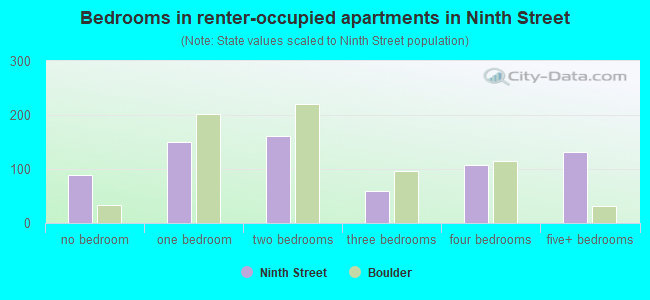
- Bedrooms in renter-occupied apartments in Ninth Street
- 89no bedroom
- 1501 bedroom
- 1622 bedrooms
- 603 bedrooms
- 1074 bedrooms
- 1315+ bedrooms
Average number of cars or other vehicles available in houses/condos:
Average number of cars or other vehicles available in apartments:
| This neighborhood: | |
| Boulder: |
Average number of cars or other vehicles available in apartments:
| Here: | 1.8 |
| city: | 1.6 |
Percentage of units with a mortgage:
| Ninth Street: | 33.5% |
| Boulder: | 60.5% |
Average estimated value of detached houses in 2022 (48.4% of all units):
| Ninth Street: | $1,313,848 |
| Boulder: | $1,567,950 |
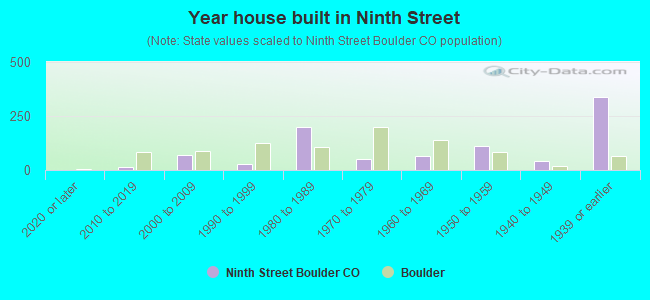
- Year house built in Ninth Street
- 02020 or later
- 122010 to 2019
- 712000 to 2009
- 261990 to 1999
- 1991980 to 1989
- 491970 to 1979
- 661960 to 1969
- 1131950 to 1959
- 421940 to 1949
- 3371939 or earlier
City-data.com crime index for city in 2020 (higher means more crime):
| City: | 275.1 |
| U.S. average: | 219.5 |
Travel time to work (commute)
![Travel time to work (commute)]()
- 9Less than 5 minutes
- 1645 to 9 minutes
- 15610 to 14 minutes
- 12515 to 19 minutes
- 7520 to 24 minutes
- 525 to 29 minutes
- 6030 to 34 minutes
- 835 to 39 minutes
- 3845 to 59 minutes
- 4460 to 89 minutes
- 2190 or more minutes

Means of transportation to work
![Means of transportation to work]()
- 39.2%351Drove a car alone
- 7.5%67Carpooled
- 3.1%28Bus
- 12.7%114Bicycle
- 17.4%156Walked
- 3.2%29Other means
- 28.8%258Worked at home

Time leaving home to go to work
![Time leaving home to go to work]()
- 312:00 a.m. to 4:59 a.m.
- 215:00 a.m. to 5:29 a.m.
- 35:30 a.m. to 5:59 a.m.
- 166:00 a.m. to 6:29 a.m.
- 96:30 a.m. to 6:59 a.m.
- 607:00 a.m. to 7:29 a.m.
- 827:30 a.m. to 7:59 a.m.
- 1028:00 a.m. to 8:29 a.m.
- 328:30 a.m. to 8:59 a.m.
- 1299:00 a.m. to 9:59 a.m.
- 2310:00 a.m. to 10:59 a.m.
- 2411:00 a.m. to 11:59 a.m.
- 6412:00 p.m. to 3:59 p.m.
- 1134:00 p.m. to 11:59 p.m.

Occupations of males:
- Percentage of males in management occupations (except farmers):
Here: 6.2% city: 12.9%
- Percentage of males in business and financial operations occupations:
Here: 6.9% city: 7.6%
- Percentage of males in computer and mathematical occupations:
Here: 11.0% city: 10.0%
- Percentage of males in architecture and engineering occupations:
Here: 2.3% city: 6.1%
- Percentage of males in community and social services occupations:
Here: 8.1% city: 1.0%
- Percentage of males in service occupations:
Here: 35.9% city: 14.4%
- Percentage of males in sales and office occupations:
Here: 13.6% city: 14.5%
- Percentage of males in construction, extraction, and maintenance occupations:
Here: 1.3% city: 2.8%
- Percentage of males in production occupations:
Here: 1.3% city: 2.3%
- Percentage of males in transportation occupations:
Here: 4.4% city: 2.5%
- Percentage of males in material moving occupations:
Here: 7.4% city: 2.4%
Occupations of females:
- Percentage of females in management occupations (except farmers):
Here: 4.1% city: 8.8%
- Percentage of females in computer and mathematical occupations:
Here: 1.4% city: 4.6%
- Percentage of females in life, physical, and social science occupations:
Here: 2.7% city: 4.7%
- Percentage of females in education, training, and library occupations:
Here: 10.2% city: 13.1%
- Percentage of females in arts, design, entertainment, sports, and media occupations:
Here: 3.5% city: 5.5%
- Percentage of females in healthcare practitioners and technical occupations:
Here: 4.0% city: 7.2%
- Percentage of females in service occupations:
Here: 34.1% city: 20.9%
- Percentage of females in sales and office occupations:
Here: 28.8% city: 19.4%
- Percentage of females in transportation occupations:
Here: 2.5% city: 1.0%
- Percentage of females in material moving occupations:
Here: 7.8% city: 1.9%
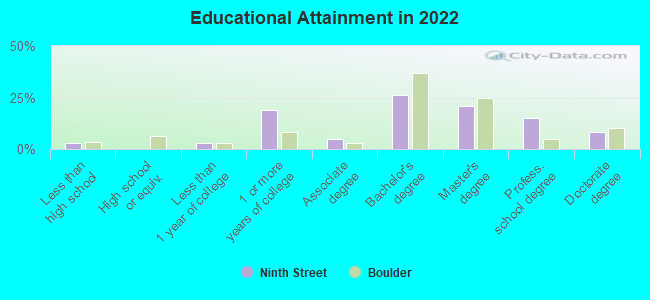
Education in this neighborhood (subdivision or community):
- Percentage of people 3 years and older in K-12 schools:
Ninth Street: 10.6% Boulder: 8.8%
- Percentage of people 3 years and older in undergraduate colleges:
Ninth Street: 60.1% Boulder: 28.2%
- Percentage of people 3 years and older in grad. or professional schools:
Ninth Street: 3.1% Boulder: 6.1%
- Percentage of students K-12 enrolled in private schools:
Ninth Street: 59.6% Boulder: 8.5%
Percentage of population below poverty level:
| Ninth Street: | 63.9% |
| Boulder: | 24.1% |
Percentage of married-couple families with both working:
| Ninth Street: | 72.1% |
| Boulder: | 76.2% |
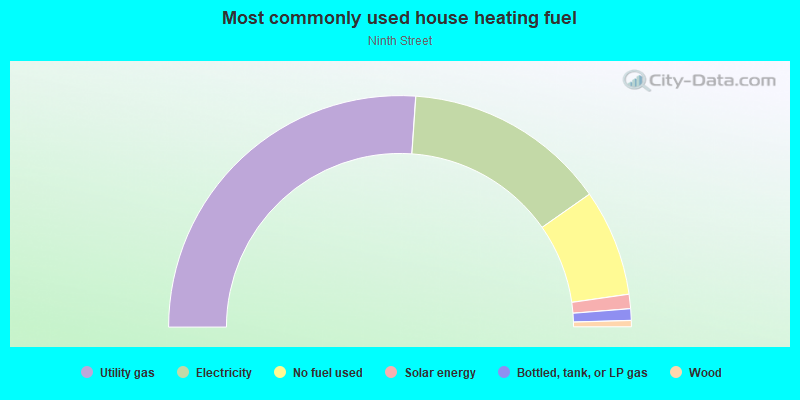
- 52.1%Utility gas
- 28.3%Electricity
- 14.9%No fuel used
- 2.0%Solar energy
- 1.6%Bottled, tank, or LP gas
- 0.9%Wood
Roads and streets:
9th St
Length: 0.83 miles
Directions: N-S, SE-NW
Address range: 700 to 1599
Directions: N-S, SE-NW
Address range: 700 to 1599
10th St
Length: 0.50 miles
Direction: N-S
Address range: 700 to 1099
Direction: N-S
Address range: 700 to 1099
Grant Pl
Length: 0.37 miles
Direction: N-S
Address range: 700 to 899
Direction: N-S
Address range: 700 to 899
Lincoln Pl
Length: 0.37 miles
Direction: N-S
Address range: 700 to 999
Direction: N-S
Address range: 700 to 999
Baseline Rd
Length: 0.26 miles
Direction: E-W
Address range: 803 to 1015
Direction: E-W
Address range: 803 to 1015
Aurora Ave
Length: 0.22 miles
Direction: E-W
Address range: 850 to 999
Direction: E-W
Address range: 850 to 999
Cascade Ave
Length: 0.22 miles
Direction: E-W
Address range: 851 to 999
Direction: E-W
Address range: 851 to 999
Euclid Ave
Length: 0.22 miles
Direction: E-W
Address range: 847 to 999
Direction: E-W
Address range: 847 to 999
University Ave
Length: 0.03 miles
Direction: E-W
Address range: 815 to 899
Direction: E-W
Address range: 815 to 899