Northwood neighborhood in Midland, Texas (TX), 79707 detailed profile
Settings
X


Business Search - 14 Million verified businesses
Area: 0.089 square miles
Population: 603
Population density:
| Northwood: | 6,763 people per square mile |
| Midland: | 2,018 people per square mile |

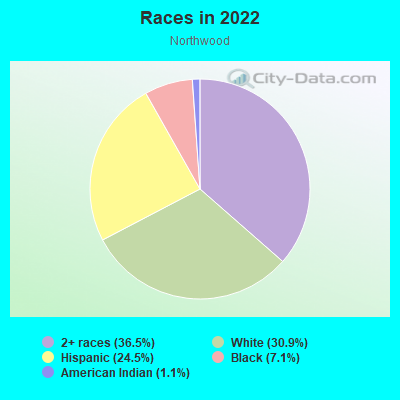
- 22236.5%Two or more races
- 18830.9%White
- 14924.5%Hispanic or Latino
- 437.1%Black
- 71.1%American Indian
Median household income in 2022:
| Northwood: | $95,435 |
| Midland: | $80,235 |
Distribution of median household income
![Distribution of median household income]()
- 59Less than $10,000
- 7$10,000 to $19,999
- 21$20,000 to $29,999
- 24$40,000 to $49,999
- 5$50,000 to $59,999
- 24$60,000 to $74,999
- 38$75,000 to $99,999
- 53$100,000 to $124,999
- 3$125,000 to $149,999
- 36$150,000 to $199,999
- 35$200,000 or more

Distribution of owner-occupied house/condo value
![Distribution of owner-occupied house/condo value]()
- 15Less than $50,000
- 10$50,000 to $99,999
- 17$150,000 to $199,999
- 10$200,000 to $249,999
- 12$250,000 to $299,999
- 33$300,000 to $399,999
- 12$400,000 to $499,999
- 45$500,000 to $749,999
- 6$750,000 to $999,999
- 6$1,000,000 or more

Distribution of rent paid by renters
![Distribution of rent paid by renters]()
- 13$500 to $599
- 20$700 to $799
- 8$800 to $899
- 3$900 to $999
- 17$1,000 to $1,249
- 15$1,250 to $1,499
- 67$1,500 to $1,999
- 17$2,000 or more

Median rent in 2022:
| Northwood: | $1,591 |
| Midland: | $1,135 |
| Males: | 308 |
| Females: | 295 |
Males:
| This neighborhood: | 26.6 years |
| Whole city: | 32.3 years |
| This neighborhood: | 30.0 years |
| Whole city: | 33.3 years |
Average household size:
| Northwood: | 2.2 people |
| Midland: | 2.4 people |
Percentage of family households:
| Northwood: | 39.0% |
| Midland: | 52.0% |
| Here: | 38.6% |
| Midland: | 46.4% |
Percentage of married-couple families with children (among all households):
| Northwood: | 45.7% |
| Midland: | 30.9% |
Percentage of single-mother households (among all households):
| Northwood: | 5.9% |
| Midland: | 8.1% |
Percentage of never married males 15 years old and over:
Percentage of never married females 15 years old and over:
| Northwood: | 28.4% |
| Midland: | 15.2% |
Percentage of never married females 15 years old and over:
| Northwood: | 18.3% |
| city: | 14.9% |
Percentage of people that speak English not well or not at all:
| Northwood: | 2.4% |
| Midland: | 5.7% |
Percentage of people born in this state:
Percentage of people born in another U.S. state:
Percentage of native residents but born outside the U.S.:
Percentage of foreign born residents:
| Here: | 57.7% |
| Midland: | 69.5% |
Percentage of people born in another U.S. state:
| Northwood: | 28.5% |
| Midland: | 18.2% |
Percentage of native residents but born outside the U.S.:
| Here: | 0.5% |
| city: | 1.2% |
Percentage of foreign born residents:
| Here: | 13.4% |
| Midland: | 11.2% |
Owner-occupied
Renter-occupied

- Rooms in owner-occupied houses and condos in Northwood
- 01 room
- 02 rooms
- 53 rooms
- 194 rooms
- 205 rooms
- 146 rooms
- 417 rooms
- 268 rooms
- 199+ rooms
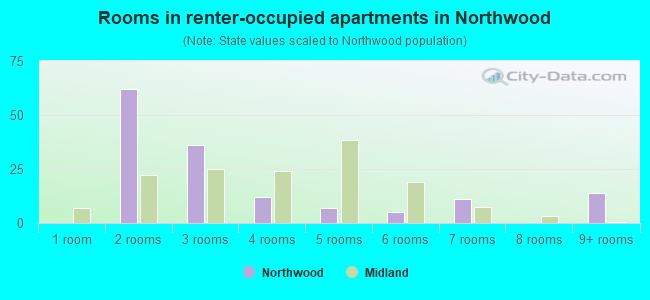
- Rooms in renter-occupied apartments in Northwood
- 01 room
- 622 rooms
- 363 rooms
- 124 rooms
- 75 rooms
- 56 rooms
- 117 rooms
- 08 rooms
- 149+ rooms
Owner-occupied
Renter-occupied
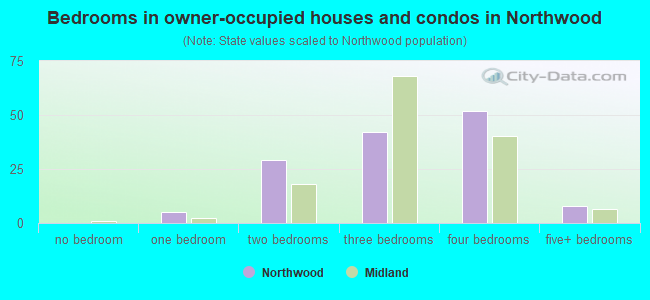
- Bedrooms in owner-occupied houses and condos in Northwood
- 0no bedroom
- 51 bedroom
- 292 bedrooms
- 423 bedrooms
- 524 bedrooms
- 85+ bedrooms
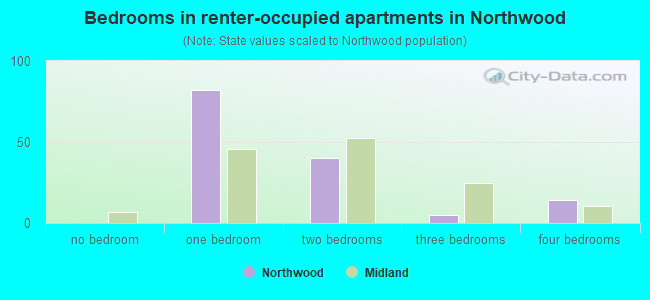
- Bedrooms in renter-occupied apartments in Northwood
- 0no bedroom
- 821 bedroom
- 402 bedrooms
- 53 bedrooms
- 144 bedrooms
- 05+ bedrooms
Average number of cars or other vehicles available in houses/condos:
Average number of cars or other vehicles available in apartments:
| This neighborhood: | 1.7 |
| Midland: | 2.1 |
Average number of cars or other vehicles available in apartments:
| Here: | 1.4 |
| city: | 1.4 |
Percentage of units with a mortgage:
| Northwood: | 59.4% |
| Midland: | 58.2% |
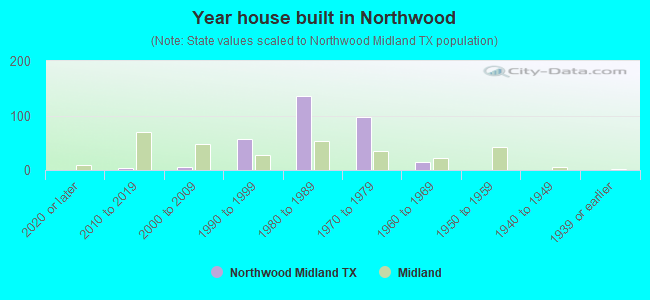
- Year house built in Northwood
- 02020 or later
- 32010 to 2019
- 62000 to 2009
- 561990 to 1999
- 1361980 to 1989
- 981970 to 1979
- 151960 to 1969
- 01950 to 1959
- 01940 to 1949
- 01939 or earlier
City-data.com crime index for city in 2020 (higher means more crime):
| City: | 223.8 |
| U.S. average: | 219.5 |
Travel time to work (commute)
![Travel time to work (commute)]()
- 7Less than 5 minutes
- 655 to 9 minutes
- 3910 to 14 minutes
- 6715 to 19 minutes
- 4320 to 24 minutes
- 325 to 29 minutes
- 930 to 34 minutes
- 1635 to 39 minutes
- 745 to 59 minutes
- 360 to 89 minutes
- 890 or more minutes

Means of transportation to work
![Means of transportation to work]()
- 88.6%266Drove a car alone
- 9.3%28Carpooled
- 0.3%1Walked
- 1.3%4Worked at home

Time leaving home to go to work
![Time leaving home to go to work]()
- 412:00 a.m. to 4:59 a.m.
- 75:00 a.m. to 5:29 a.m.
- 165:30 a.m. to 5:59 a.m.
- 216:00 a.m. to 6:29 a.m.
- 216:30 a.m. to 6:59 a.m.
- 477:00 a.m. to 7:29 a.m.
- 507:30 a.m. to 7:59 a.m.
- 228:00 a.m. to 8:29 a.m.
- 118:30 a.m. to 8:59 a.m.
- 199:00 a.m. to 9:59 a.m.
- 510:00 a.m. to 10:59 a.m.
- 3612:00 p.m. to 3:59 p.m.
- 84:00 p.m. to 11:59 p.m.

Occupations of males:
- Percentage of males in management occupations (except farmers):
Here: 19.7% city: 14.6%
- Percentage of males in business and financial operations occupations:
Here: 11.1% city: 3.8%
- Percentage of males in computer and mathematical occupations:
Here: 7.8% city: 1.9%
- Percentage of males in architecture and engineering occupations:
Here: 10.1% city: 7.5%
- Percentage of males in life, physical, and social science occupations:
Here: 4.3% city: 1.9%
- Percentage of males in legal occupations:
Here: 2.0% city: 1.2%
- Percentage of males in education, training, and library occupations:
Here: 3.8% city: 2.5%
- Percentage of males in service occupations:
Here: 8.6% city: 9.5%
- Percentage of males in sales and office occupations:
Here: 26.3% city: 14.8%
- Percentage of males in construction, extraction, and maintenance occupations:
Here: 2.8% city: 15.1%
- Percentage of males in production occupations:
Here: 2.7% city: 7.5%
- Percentage of males in transportation occupations:
Here: 2.6% city: 5.1%
- Percentage of males in material moving occupations:
Here: 9.6% city: 4.8%
Occupations of females:
- Percentage of females in management occupations (except farmers):
Here: 11.8% city: 11.6%
- Percentage of females in business and financial operations occupations:
Here: 21.0% city: 6.9%
- Percentage of females in computer and mathematical occupations:
Here: 2.8% city: 1.4%
- Percentage of females in architecture and engineering occupations:
Here: 9.0% city: 1.8%
- Percentage of females in education, training, and library occupations:
Here: 7.3% city: 11.2%
- Percentage of females in arts, design, entertainment, sports, and media occupations:
Here: 3.6% city: 1.7%
- Percentage of females in healthcare practitioners and technical occupations:
Here: 4.0% city: 6.8%
- Percentage of females in service occupations:
Here: 33.7% city: 16.8%
- Percentage of females in sales and office occupations:
Here: 31.5% city: 33.2%
- Percentage of females in construction, extraction, and maintenance occupations:
Here: 15.7% city: 0.6%
- Percentage of females in production occupations:
Here: 1.5% city: 2.0%
- Percentage of females in transportation occupations:
Here: 1.5% city: 0.7%
Education in this neighborhood (subdivision or community):
- Percentage of people 3 years and older in K-12 schools:
Northwood: 26.2% Midland: 22.4%
- Percentage of people 3 years and older in undergraduate colleges:
Northwood: 2.2% Midland: 3.0%
- Percentage of people 3 years and older in grad. or professional schools:
Northwood: 0.9% Midland: 1.8%
- Percentage of students K-12 enrolled in private schools:
Northwood: 93.5% Midland: 16.2%
Percentage of population below poverty level:
| Northwood: | 6.8% |
| Midland: | 11.7% |
Median year owner moved in (as recorded in 2022):
Median year renter moved in (as recorded in 2022):
| Northwood: | 2008 |
| Midland: | 2015 |
Median year renter moved in (as recorded in 2022):
| Northwood: | 2019 |
| Midland: | 2022 |
Percentage of married-couple families with both working:
| Northwood: | 27.7% |
| Midland: | 63.2% |
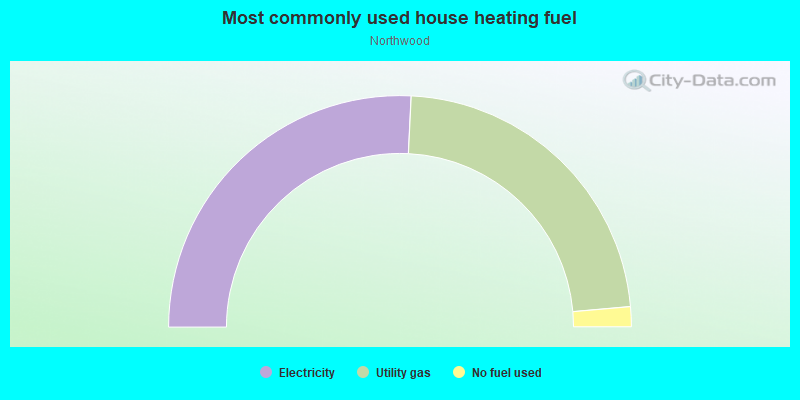
- 51.6%Electricity
- 45.7%Utility gas
- 2.8%No fuel used
Roads and streets:
Russell Dr
Length: 0.12 miles
Direction: E-W
Address range: 4200 to 4299
Direction: E-W
Address range: 4200 to 4299
Merrill Dr
Length: 0.12 miles
Direction: E-W
Address range: 4200 to 4299
Direction: E-W
Address range: 4200 to 4299
St Andrews Dr
Length: 0.12 miles
Direction: E-W
Address range: 4200 to 4299
Direction: E-W
Address range: 4200 to 4299
Stratton Dr
Length: 0.10 miles
Direction: N-S
Direction: N-S
Norwood St
Length: 0.10 miles
Direction: N-S
Address range: 3800 to 3999
Direction: N-S
Address range: 3800 to 3999
Merrill Ct
Length: 0.07 miles
Direction: E-W
Address range: 4300 to 4399
Direction: E-W
Address range: 4300 to 4399
Russell Ct
Length: 0.07 miles
Direction: E-W
Address range: 4300 to 4399
Direction: E-W
Address range: 4300 to 4399
Gleneagles Ct
Length: 0.04 miles
Direction: E-W
Address range: 4000 to 4215
Direction: E-W
Address range: 4000 to 4215