Oak Ridge neighborhood in Leesburg, Florida (FL), 34748 detailed profile
Settings
X


Business Search - 14 Million verified businesses
Area: 0.015 square miles
Population: 5,967
Population density:
| Oak Ridge: | 399,799 people per square mile |
| Leesburg: | 1,459 people per square mile |

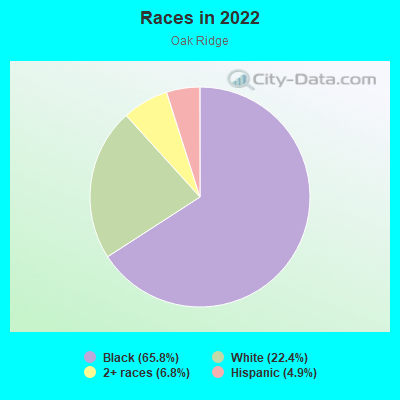
- 4,02665.8%Black
- 1,37222.4%White
- 4186.8%Two or more races
- 3024.9%Hispanic or Latino
Median household income in 2022:
| Oak Ridge: | $52,440 |
| Leesburg: | $43,733 |
Distribution of median household income
![Distribution of median household income]()
- 271Less than $10,000
- 296$10,000 to $19,999
- 490$20,000 to $29,999
- 287$30,000 to $39,999
- 159$40,000 to $49,999
- 123$50,000 to $59,999
- 182$60,000 to $74,999
- 225$75,000 to $99,999
- 159$100,000 to $124,999
- 73$125,000 to $149,999
- 427$150,000 to $199,999
- 29$200,000 or more

Distribution of owner-occupied house/condo value
![Distribution of owner-occupied house/condo value]()
- 849Less than $50,000
- 424$50,000 to $99,999
- 360$100,000 to $149,999
- 289$150,000 to $199,999
- 143$200,000 to $249,999
- 420$250,000 to $299,999
- 52$300,000 to $399,999
- 93$400,000 to $499,999
- 58$500,000 to $749,999
- 23$750,000 to $999,999
- 137$1,000,000 or more

Distribution of rent paid by renters
![Distribution of rent paid by renters]()
- 81$200 to $299
- 227$300 to $399
- 328$400 to $499
- 168$500 to $599
- 145$600 to $699
- 124$700 to $799
- 193$800 to $899
- 40$900 to $999
- 77$1,000 to $1,249

Median rent in 2022:
| Oak Ridge: | $760 |
| Leesburg: | $842 |
| Males: | 2,810 |
| Females: | 3,157 |
Males:
| This neighborhood: | 28.6 years |
| Whole city: | 41.7 years |
| This neighborhood: | 37.3 years |
| Whole city: | 44.9 years |
Average household size:
| Oak Ridge: | 3.0 people |
| Leesburg: | 2.4 people |
Percentage of family households:
| Oak Ridge: | 49.0% |
| Leesburg: | 38.1% |
| Here: | 22.9% |
| Leesburg: | 42.7% |
Percentage of married-couple families with children (among all households):
| Oak Ridge: | 10.1% |
| Leesburg: | 21.2% |
Percentage of single-mother households (among all households):
| Oak Ridge: | 12.0% |
| Leesburg: | 18.6% |
Percentage of never married males 15 years old and over:
Percentage of never married females 15 years old and over:
| Oak Ridge: | 27.6% |
| Leesburg: | 17.6% |
Percentage of never married females 15 years old and over:
| Oak Ridge: | 23.3% |
| city: | 14.9% |
Percentage of people that speak English not well or not at all:
| Oak Ridge: | 2.3% |
| Leesburg: | 4.6% |
Percentage of people born in this state:
Percentage of people born in another U.S. state:
Percentage of native residents but born outside the U.S.:
Percentage of foreign born residents:
| Here: | 76.8% |
| Leesburg: | 41.2% |
Percentage of people born in another U.S. state:
| Oak Ridge: | 20.3% |
| Leesburg: | 42.4% |
Percentage of native residents but born outside the U.S.:
| Here: | 0.2% |
| city: | 6.3% |
Percentage of foreign born residents:
| Here: | 2.9% |
| Leesburg: | 10.0% |
Owner-occupied
Renter-occupied

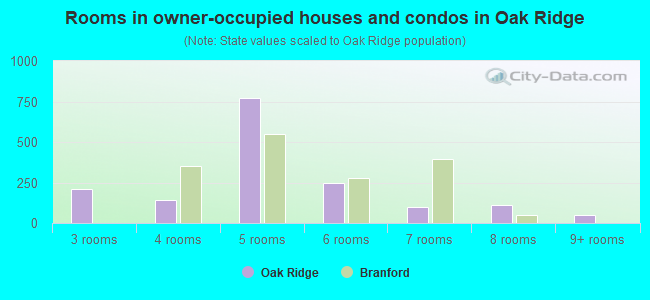
- Rooms in owner-occupied houses and condos in Oak Ridge
- 01 room
- 02 rooms
- 2103 rooms
- 1424 rooms
- 7735 rooms
- 2456 rooms
- 1007 rooms
- 1098 rooms
- 509+ rooms
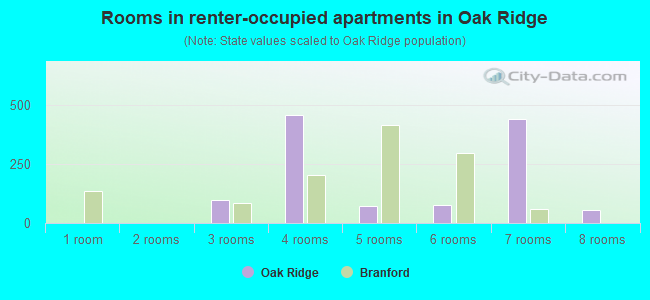
- Rooms in renter-occupied apartments in Oak Ridge
- 01 room
- 02 rooms
- 993 rooms
- 4574 rooms
- 715 rooms
- 786 rooms
- 4397 rooms
- 548 rooms
- 09+ rooms
Owner-occupied
Renter-occupied
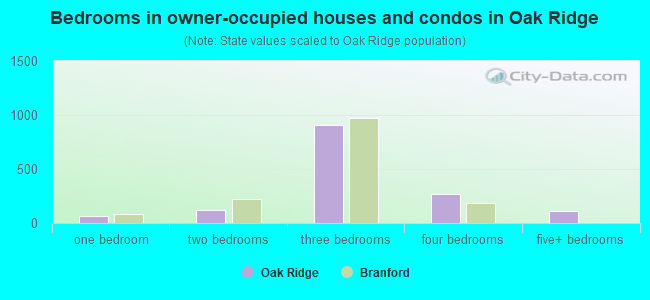
- Bedrooms in owner-occupied houses and condos in Oak Ridge
- 0no bedroom
- 611 bedroom
- 1162 bedrooms
- 9103 bedrooms
- 2684 bedrooms
- 1155+ bedrooms
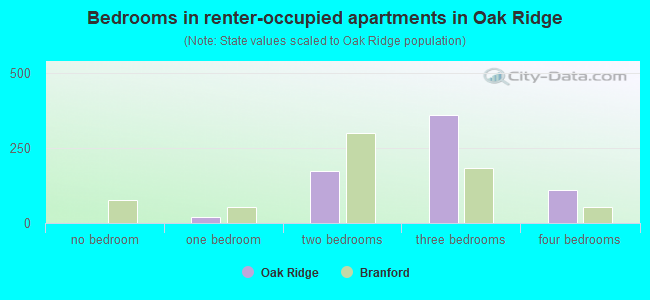
- Bedrooms in renter-occupied apartments in Oak Ridge
- 0no bedroom
- 191 bedroom
- 1722 bedrooms
- 3593 bedrooms
- 1114 bedrooms
- 05+ bedrooms
Average number of cars or other vehicles available in houses/condos:
Average number of cars or other vehicles available in apartments:
| This neighborhood: | 1.3 |
| Leesburg: | 1.6 |
Average number of cars or other vehicles available in apartments:
| Here: | 1.3 |
| city: | 1.2 |
Percentage of units with a mortgage:
| Oak Ridge: | 55.4% |
| Leesburg: | 46.0% |
Housing prices:
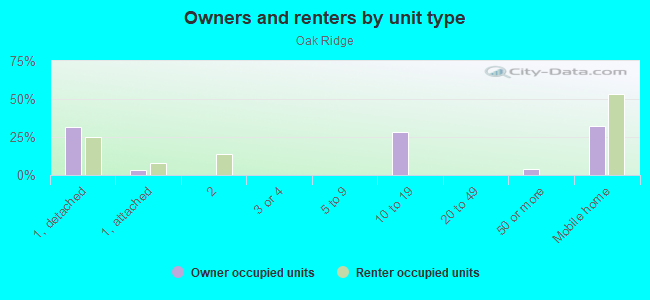
- Average estimated value of detached houses in 2022 (40.3% of all units):
Oak Ridge: $260,203 Leesburg: $238,402
- Average estimated value of mobile home in 2022 (55.9% of all units):
Oak Ridge: $221,822 Leesburg: $35,294
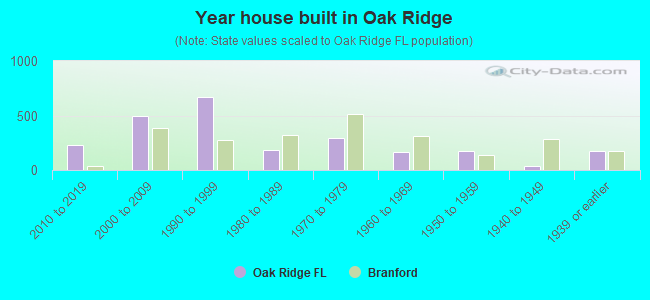
- Year house built in Oak Ridge
- 02020 or later
- 2302010 to 2019
- 4922000 to 2009
- 6711990 to 1999
- 1851980 to 1989
- 2941970 to 1979
- 1681960 to 1969
- 1781950 to 1959
- 411940 to 1949
- 1711939 or earlier
City-data.com crime index for city in 2020 (higher means more crime):
| City: | 392.2 |
| U.S. average: | 219.5 |
Travel time to work (commute)
![Travel time to work (commute)]()
- 104Less than 5 minutes
- 2825 to 9 minutes
- 71810 to 14 minutes
- 92715 to 19 minutes
- 2,14520 to 24 minutes
- 26625 to 29 minutes
- 90930 to 34 minutes
- 2240 to 44 minutes
- 17645 to 59 minutes
- 8860 to 89 minutes
- 18290 or more minutes

Means of transportation to work
![Means of transportation to work]()
- 69.8%1,592Drove a car alone
- 8.8%201Carpooled
- 25.2%575Bus
- 15.4%351Bicycle
- 18.8%429Walked
- 4.6%104Other means
- 13.5%308Worked at home

Time leaving home to go to work
![Time leaving home to go to work]()
- 34012:00 a.m. to 4:59 a.m.
- 515:00 a.m. to 5:29 a.m.
- 5335:30 a.m. to 5:59 a.m.
- 1796:00 a.m. to 6:29 a.m.
- 8836:30 a.m. to 6:59 a.m.
- 9777:00 a.m. to 7:29 a.m.
- 4537:30 a.m. to 7:59 a.m.
- 2878:00 a.m. to 8:29 a.m.
- 4538:30 a.m. to 8:59 a.m.
- 2309:00 a.m. to 9:59 a.m.
- 2110:00 a.m. to 10:59 a.m.
- 29112:00 p.m. to 3:59 p.m.
- 8404:00 p.m. to 11:59 p.m.

Occupations of males:
- Percentage of males in management occupations (except farmers):
Here: 4.3% city: 10.5%
- Percentage of males in business and financial operations occupations:
Here: 2.3% city: 2.4%
- Percentage of males in computer and mathematical occupations:
Here: 1.7% city: 2.7%
- Percentage of males in community and social services occupations:
Here: 6.0% city: 0.2%
- Percentage of males in education, training, and library occupations:
Here: 4.6% city: 0.7%
- Percentage of males in healthcare practitioners and technical occupations:
Here: 4.0% city: 3.1%
- Percentage of males in service occupations:
Here: 28.9% city: 17.0%
- Percentage of males in sales and office occupations:
Here: 6.3% city: 15.9%
- Percentage of males in construction, extraction, and maintenance occupations:
Here: 15.6% city: 15.4%
- Percentage of males in production occupations:
Here: 6.3% city: 1.5%
- Percentage of males in transportation occupations:
Here: 8.8% city: 12.9%
- Percentage of males in material moving occupations:
Here: 7.8% city: 4.4%
Occupations of females:
- Percentage of females in management occupations (except farmers):
Here: 10.9% city: 10.1%
- Percentage of females in business and financial operations occupations:
Here: 1.4% city: 4.0%
- Percentage of females in computer and mathematical occupations:
Here: 2.0% city: 0.5%
- Percentage of females in architecture and engineering occupations:
Here: 10.7% city: 0.7%
- Percentage of females in community and social services occupations:
Here: 2.6% city: 3.0%
- Percentage of females in legal occupations:
Here: 10.6% city: 0.7%
- Percentage of females in education, training, and library occupations:
Here: 2.8% city: 1.1%
- Percentage of females in arts, design, entertainment, sports, and media occupations:
Here: 5.1% city: 2.5%
- Percentage of females in healthcare practitioners and technical occupations:
Here: 7.5% city: 12.4%
- Percentage of females in service occupations:
Here: 31.0% city: 32.4%
- Percentage of females in sales and office occupations:
Here: 24.9% city: 24.6%
- Percentage of females in farming, fishing, and forestry occupations:
Here: 4.2% city: 0.2%
- Percentage of females in production occupations:
Here: 1.7% city: 4.2%
- Percentage of females in transportation occupations:
Here: 4.2% city: 1.1%
- Percentage of females in material moving occupations:
Here: 4.3% city: 1.2%
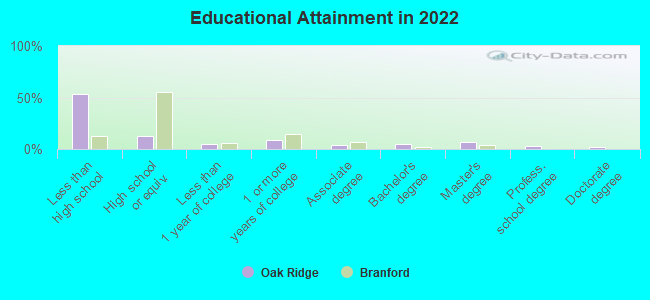
Education in this neighborhood (subdivision or community):
- Percentage of people 3 years and older in K-12 schools:
Oak Ridge: 27.0% Leesburg: 16.7%
- Percentage of people 3 years and older in undergraduate colleges:
Oak Ridge: 8.9% Leesburg: 2.6%
- Percentage of people 3 years and older in grad. or professional schools:
Oak Ridge: 5.7% Leesburg: 0.4%
- Percentage of students K-12 enrolled in private schools:
Oak Ridge: 41.9% Leesburg: 16.0%
Percentage of population below poverty level:
| Oak Ridge: | 27.2% |
| Leesburg: | 18.5% |
Median year owner moved in (as recorded in 2022):
Median year renter moved in (as recorded in 2022):
| Oak Ridge: | 2048 |
| Leesburg: | 2012 |
Median year renter moved in (as recorded in 2022):
| Oak Ridge: | 2054 |
| Leesburg: | 2016 |
Percentage of married-couple families with both working:
| Oak Ridge: | 120.2% |
| Leesburg: | 62.7% |
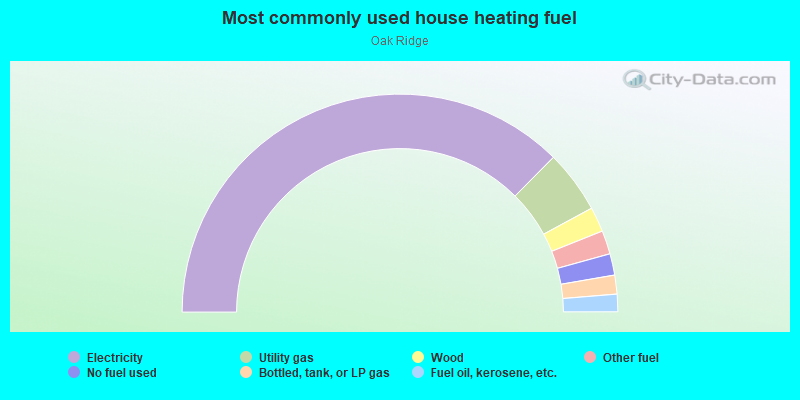
- 74.9%Electricity
- 9.3%Utility gas
- 3.7%Wood
- 3.5%Other fuel
- 3.2%No fuel used
- 2.8%Bottled, tank, or LP gas
- 2.6%Fuel oil, kerosene, etc.