Overfelt neighborhood in San Jose, California (CA), 95122 detailed profile
Settings
X

Business Search - 14 Million verified businesses
Area: 0.463 square miles
Population: 3,524
Population density:
| Overfelt: | 7,615 people per square mile |
| San Jose: | 5,554 people per square mile |

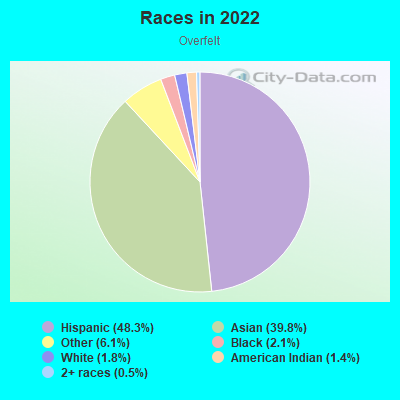
- 1,86748.3%Hispanic or Latino
- 1,53939.8%Asian
- 2376.1%Some other race
- 812.1%Black
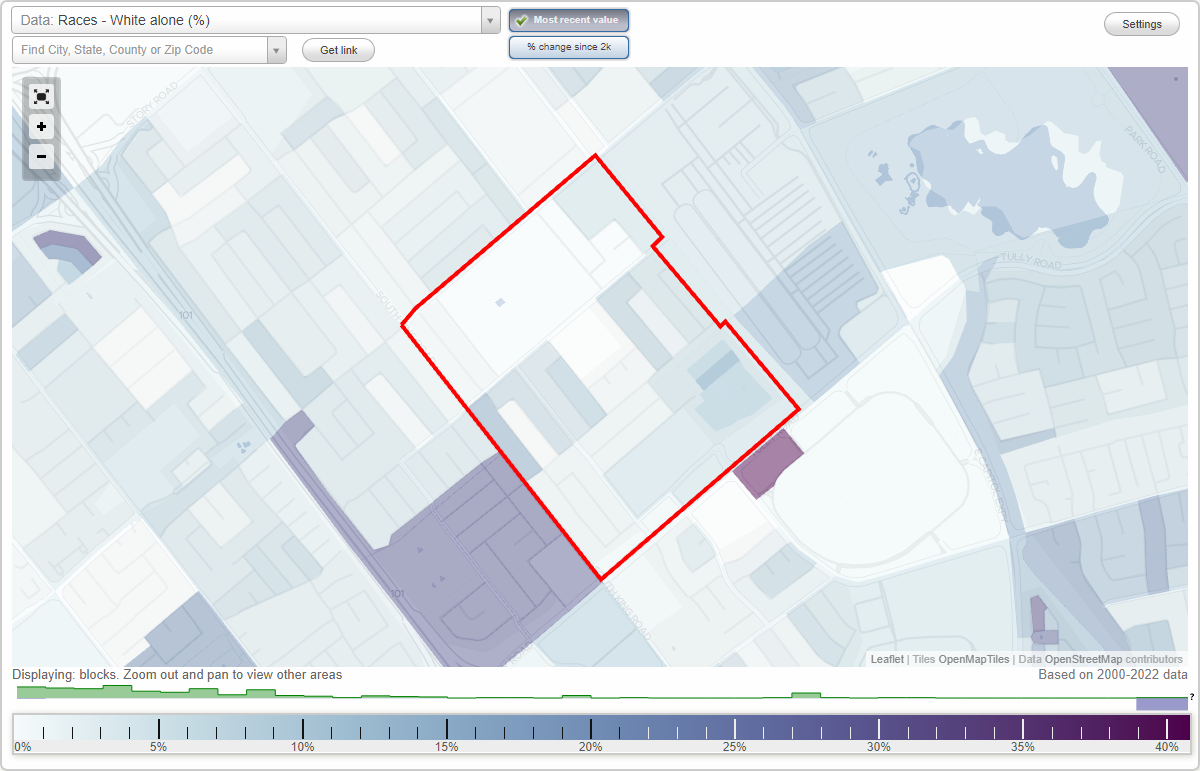
- 681.8%White
- 551.4%American Indian
- 190.5%Two or more races
Distribution of median household income
![Distribution of median household income]()
- 17Less than $10,000
- 27$10,000 to $19,999
- 71$20,000 to $29,999
- 51$30,000 to $39,999
- 130$40,000 to $49,999
- 47$50,000 to $59,999
- 27$60,000 to $74,999
- 96$75,000 to $99,999
- 79$100,000 to $124,999
- 69$125,000 to $149,999
- 109$150,000 to $199,999
- 207$200,000 or more

Distribution of owner-occupied house/condo value
![Distribution of owner-occupied house/condo value]()
- 37Less than $50,000
- 119$50,000 to $99,999
- 13$100,000 to $149,999
- 13$150,000 to $199,999
- 24$200,000 to $249,999
- 57$250,000 to $299,999
- 32$300,000 to $399,999
- 49$400,000 to $499,999
- 144$500,000 to $749,999
- 195$750,000 to $999,999
- 183$1,000,000 or more

Distribution of rent paid by renters
![Distribution of rent paid by renters]()
- 16$100 to $199
- 59$200 to $299
- 56$300 to $399
- 80$400 to $499
- 1$500 to $599
- 65$700 to $799
- 90$800 to $899
- 49$900 to $999
- 173$1,000 to $1,249
- 7$1,250 to $1,499
- 61$1,500 to $1,999
- 336$2,000 or more

Median rent in 2022:
| Overfelt: | $2,384 |
| San Jose: | $2,001 |
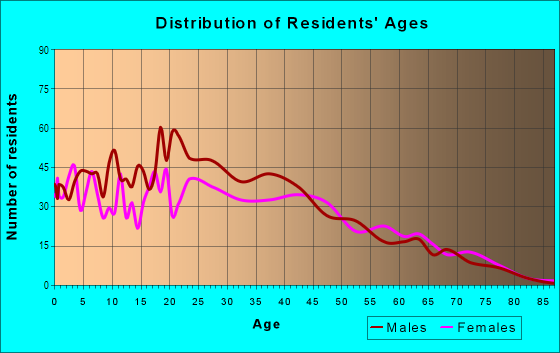
| Males: | 1,775 |
| Females: | 1,749 |
Males:
| This neighborhood: | 33.8 years |
| Whole city: | 37.6 years |
| This neighborhood: | 37.2 years |
| Whole city: | 39.1 years |
Average household size:
| Overfelt: | 5.1 people |
| San Jose: | 2.9 people |
Percentage of family households:
| Overfelt: | 64.9% |
| San Jose: | 49.9% |
| Here: | 64.1% |
| San Jose: | 53.0% |
Percentage of married-couple families with children (among all households):
| Overfelt: | 16.1% |
| San Jose: | 25.8% |
Percentage of single-mother households (among all households):
| Overfelt: | 3.8% |
| San Jose: | 5.2% |
Percentage of never married males 15 years old and over:
Percentage of never married females 15 years old and over:
| Overfelt: | 22.8% |
| San Jose: | 20.9% |
Percentage of never married females 15 years old and over:
| Overfelt: | 17.8% |
| city: | 16.7% |
Percentage of people that speak English not well or not at all:
| Overfelt: | 23.3% |
| San Jose: | 11.4% |
Percentage of people born in this state:
Percentage of people born in another U.S. state:
Percentage of native residents but born outside the U.S.:
Percentage of foreign born residents:
| Here: | 41.5% |
| San Jose: | 46.1% |
Percentage of people born in another U.S. state:
| Overfelt: | 1.9% |
| San Jose: | 10.4% |
Percentage of native residents but born outside the U.S.:
| Here: | 1.7% |
| city: | 1.7% |
Percentage of foreign born residents:
| Here: | 54.8% |
| San Jose: | 41.8% |
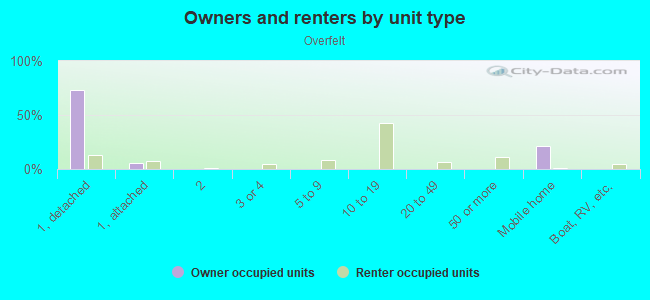
Owner-occupied
Renter-occupied

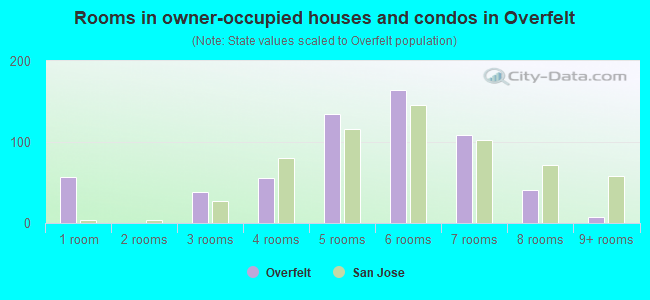
- Rooms in owner-occupied houses and condos in Overfelt
- 571 room
- 02 rooms
- 383 rooms
- 564 rooms
- 1355 rooms
- 1646 rooms
- 1097 rooms
- 418 rooms
- 89+ rooms
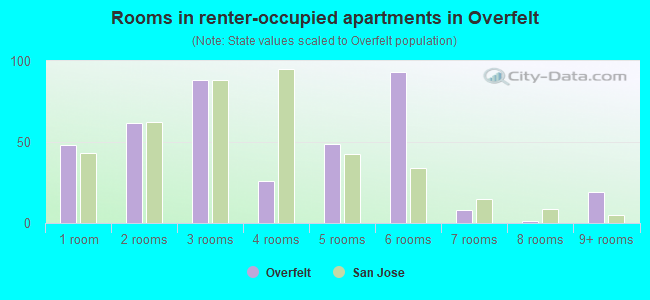
- Rooms in renter-occupied apartments in Overfelt
- 481 room
- 622 rooms
- 883 rooms
- 264 rooms
- 495 rooms
- 936 rooms
- 87 rooms
- 18 rooms
- 199+ rooms
Owner-occupied
Renter-occupied
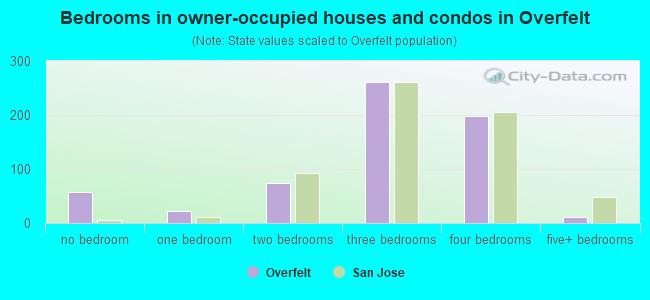
- Bedrooms in owner-occupied houses and condos in Overfelt
- 57no bedroom
- 221 bedroom
- 742 bedrooms
- 2613 bedrooms
- 1994 bedrooms
- 125+ bedrooms
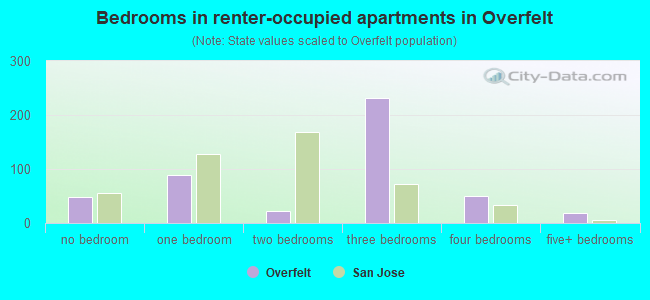
- Bedrooms in renter-occupied apartments in Overfelt
- 48no bedroom
- 891 bedroom
- 222 bedrooms
- 2323 bedrooms
- 504 bedrooms
- 185+ bedrooms
Average number of cars or other vehicles available in houses/condos:
Average number of cars or other vehicles available in apartments:
| This neighborhood: | 3.0 |
| San Jose: | 2.3 |
Average number of cars or other vehicles available in apartments:
| Here: | 2.8 |
| city: | 1.6 |
Percentage of units with a mortgage:
| Overfelt: | 60.6% |
| San Jose: | 66.9% |
Average estimated value of detached houses in 2022 (84.7% of all units):
| Overfelt: | $803,000 |
| San Jose: | $1,532,815 |
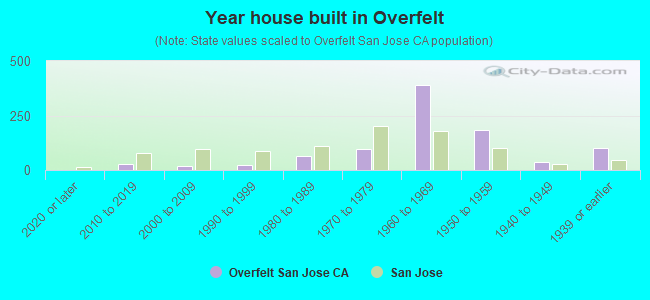
- Year house built in Overfelt
- 02020 or later
- 262010 to 2019
- 192000 to 2009
- 251990 to 1999
- 661980 to 1989
- 961970 to 1979
- 3901960 to 1969
- 1851950 to 1959
- 371940 to 1949
- 1001939 or earlier
City-data.com crime index for city in 2020 (higher means more crime):
| City: | 268.4 |
| U.S. average: | 219.5 |
Travel time to work (commute)
![Travel time to work (commute)]()
- 995 to 9 minutes
- 12310 to 14 minutes
- 33315 to 19 minutes
- 39220 to 24 minutes
- 14425 to 29 minutes
- 37930 to 34 minutes
- 5335 to 39 minutes
- 6040 to 44 minutes
- 15845 to 59 minutes
- 6260 to 89 minutes
- 2390 or more minutes

Means of transportation to work
![Means of transportation to work]()
- 74.0%1,319Drove a car alone
- 15.9%284Carpooled
- 3.1%55Bus
- 0.1%2Long-distance train or commuter rail
- 6.4%115Motorcycle
- 1.3%24Bicycle
- 4.0%72Other means
- 4.4%78Worked at home

Time leaving home to go to work
![Time leaving home to go to work]()
- 15612:00 a.m. to 4:59 a.m.
- 925:00 a.m. to 5:29 a.m.
- 555:30 a.m. to 5:59 a.m.
- 2216:00 a.m. to 6:29 a.m.
- 1236:30 a.m. to 6:59 a.m.
- 2927:00 a.m. to 7:29 a.m.
- 1307:30 a.m. to 7:59 a.m.
- 2188:00 a.m. to 8:29 a.m.
- 728:30 a.m. to 8:59 a.m.
- 1409:00 a.m. to 9:59 a.m.
- 8110:00 a.m. to 10:59 a.m.
- 3611:00 a.m. to 11:59 a.m.
- 12412:00 p.m. to 3:59 p.m.
- 594:00 p.m. to 11:59 p.m.

Occupations of males:
- Percentage of males in management occupations (except farmers):
Here: 8.3% city: 13.0%
- Percentage of males in computer and mathematical occupations:
Here: 2.5% city: 13.6%
- Percentage of males in architecture and engineering occupations:
Here: 4.0% city: 10.2%
- Percentage of males in education, training, and library occupations:
Here: 1.4% city: 2.8%
- Percentage of males in arts, design, entertainment, sports, and media occupations:
Here: 1.3% city: 1.8%
- Percentage of males in service occupations:
Here: 11.1% city: 12.7%
- Percentage of males in sales and office occupations:
Here: 17.6% city: 12.8%
- Percentage of males in construction, extraction, and maintenance occupations:
Here: 8.3% city: 7.8%
- Percentage of males in production occupations:
Here: 13.5% city: 5.5%
- Percentage of males in transportation occupations:
Here: 11.9% city: 3.6%
- Percentage of males in material moving occupations:
Here: 7.9% city: 3.1%
Occupations of females:
- Percentage of females in management occupations (except farmers):
Here: 8.5% city: 11.0%
- Percentage of females in business and financial operations occupations:
Here: 5.1% city: 8.6%
- Percentage of females in computer and mathematical occupations:
Here: 1.5% city: 5.4%
- Percentage of females in architecture and engineering occupations:
Here: 1.0% city: 2.8%
- Percentage of females in community and social services occupations:
Here: 1.5% city: 1.8%
- Percentage of females in education, training, and library occupations:
Here: 7.0% city: 8.1%
- Percentage of females in arts, design, entertainment, sports, and media occupations:
Here: 1.9% city: 2.0%
- Percentage of females in healthcare practitioners and technical occupations:
Here: 5.4% city: 6.8%
- Percentage of females in service occupations:
Here: 32.2% city: 21.7%
- Percentage of females in sales and office occupations:
Here: 23.7% city: 22.0%
- Percentage of females in farming, fishing, and forestry occupations:
Here: 1.4% city: 0.2%
- Percentage of females in production occupations:
Here: 7.3% city: 4.0%
- Percentage of females in transportation occupations:
Here: 2.3% city: 0.7%
- Percentage of females in material moving occupations:
Here: 1.3% city: 1.5%
Percentage of people 16-64 in Armed Forces:
| Overfelt: | 0.1% |
| San Jose: | 0.0% |
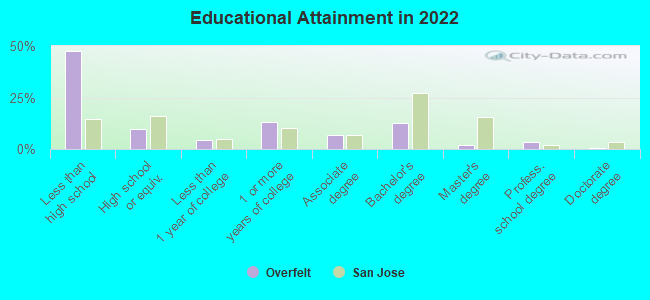
Education in this neighborhood (subdivision or community):
- Percentage of people 3 years and older in K-12 schools:
Overfelt: 20.2% San Jose: 16.1%
- Percentage of people 3 years and older in undergraduate colleges:
Overfelt: 9.9% San Jose: 6.5%
- Percentage of people 3 years and older in grad. or professional schools:
Overfelt: 4.6% San Jose: 2.0%
- Percentage of students K-12 enrolled in private schools:
Overfelt: 32.7% San Jose: 14.9%
Percentage of population below poverty level:
| Overfelt: | 8.4% |
| San Jose: | 9.0% |
Median year owner moved in (as recorded in 2022):
| Overfelt: | 2004 |
| San Jose: | 2008 |
Percentage of married-couple families with both working:
| Overfelt: | 82.5% |
| San Jose: | 72.5% |
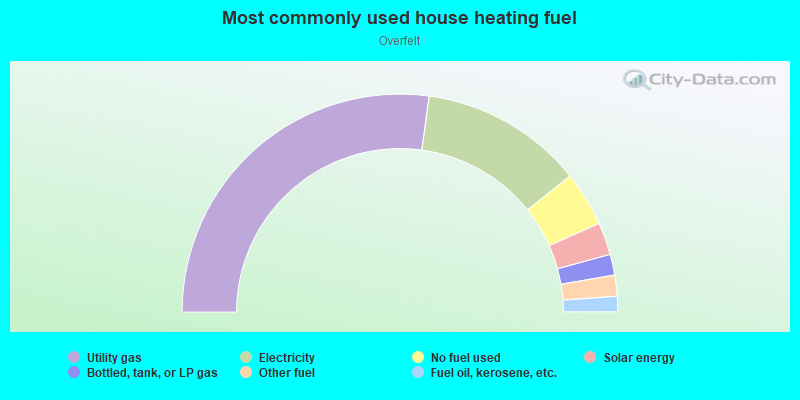
- 54.3%Utility gas
- 24.2%Electricity
- 8.2%No fuel used
- 4.8%Solar energy
- 3.1%Bottled, tank, or LP gas
- 3.1%Other fuel
- 2.3%Fuel oil, kerosene, etc.
Roads and streets:
Orlando Dr
Length: 0.79 miles
Directions: E-W, SE-NW
Address range: 1800 to 2399
Directions: E-W, SE-NW
Address range: 1800 to 2399
Ocala Ave
Length: 0.62 miles
Direction: SW-NE
Address range: 1726 to 2199
Direction: SW-NE
Address range: 1726 to 2199
Waverly Ave
Length: 0.62 miles
Direction: SW-NE
Address range: 1750 to 2299
Direction: SW-NE
Address range: 1750 to 2299
Cunningham Ave
Length: 0.57 miles
Direction: SW-NE
Address range: 1778 to 2199
Direction: SW-NE
Address range: 1778 to 2199
Huran Dr
Length: 0.51 miles
Direction: SE-NW
Address range: 2000 to 2353
Direction: SE-NW
Address range: 2000 to 2353
Santiago Ave
Length: 0.49 miles
Directions: E-W, N-S, SE-NW, SW-NE
Address range: 1901 to 2149
Directions: E-W, N-S, SE-NW, SW-NE
Address range: 1901 to 2149
Clarice Dr
Length: 0.40 miles
Directions: E-W, SW-NE
Address range: 1700 to 2099
Directions: E-W, SW-NE
Address range: 1700 to 2099
Winterpark Way
Length: 0.28 miles
Direction: SE-NW
Address range: 1800 to 1999
Direction: SE-NW
Address range: 1800 to 1999
Bermuda Way
Length: 0.28 miles
Direction: SE-NW
Address range: 1800 to 1999
Direction: SE-NW
Address range: 1800 to 1999
Daytona Dr
Length: 0.27 miles
Directions: N-S, SE-NW, SW-NE
Address range: 1800 to 1999
Directions: N-S, SE-NW, SW-NE
Address range: 1800 to 1999
Harbor View Ave
Length: 0.26 miles
Direction: SW-NE
Address range: 1800 to 2099
Direction: SW-NE
Address range: 1800 to 2099
Nassau Dr
Length: 0.25 miles
Direction: SE-NW
Address range: 2000 to 2199
Direction: SE-NW
Address range: 2000 to 2199
Mondigo Ave
Length: 0.25 miles
Direction: SE-NW
Address range: 2000 to 2199
Direction: SE-NW
Address range: 2000 to 2199
Mendota Way
Length: 0.25 miles
Direction: SE-NW
Address range: 2000 to 2199
Direction: SE-NW
Address range: 2000 to 2199
Jamaica Way
Length: 0.25 miles
Directions: E-W, SE-NW, SW-NE
Address range: 2000 to 2199
Directions: E-W, SE-NW, SW-NE
Address range: 2000 to 2199
Inman Way
Length: 0.24 miles
Directions: N-S, SE-NW, SW-NE
Address range: 2000 to 2199
Directions: N-S, SE-NW, SW-NE
Address range: 2000 to 2199
Interbay Dr
Length: 0.24 miles
Directions: N-S, SE-NW, SW-NE
Address range: 2000 to 2199
Directions: N-S, SE-NW, SW-NE
Address range: 2000 to 2199
Bay Haven Dr
Length: 0.21 miles
Directions: N-S, SE-NW, SW-NE
Address range: 2026 to 2199
Directions: N-S, SE-NW, SW-NE
Address range: 2026 to 2199
Palmira Way
Length: 0.20 miles
Directions: E-W, SE-NW
Address range: 2258 to 2333
Directions: E-W, SE-NW
Address range: 2258 to 2333
Ceylon Ave
Length: 0.18 miles
Direction: SW-NE
Address range: 1900 to 1999
Direction: SW-NE
Address range: 1900 to 1999
Tymn Way
Length: 0.13 miles
Directions: E-W, SE-NW
Address range: 1901 to 1999
Directions: E-W, SE-NW
Address range: 1901 to 1999
Annona Ave
Length: 0.11 miles
Direction: SE-NW
Address range: 2200 to 2299
Direction: SE-NW
Address range: 2200 to 2299
Tehama Ave
Length: 0.09 miles
Directions: E-W, SW-NE
Address range: 2100 to 2199
Directions: E-W, SW-NE
Address range: 2100 to 2199
Quimby Rd
Length: 0.08 miles
Directions: E-W, N-S, SE-NW, SW-NE
Address range: 1702 to 1795
Directions: E-W, N-S, SE-NW, SW-NE
Address range: 1702 to 1795
Palmira Dr
Length: 0.06 miles
Directions: E-W, SW-NE
Directions: E-W, SW-NE
Coyne Ct
Length: 0.05 miles
Direction: SW-NE
Address range: 2100 to 2199
Direction: SW-NE
Address range: 2100 to 2199
Ceylon Ct
Length: 0.03 miles
Direction: SE-NW
Address range: 2100 to 2199
Direction: SE-NW
Address range: 2100 to 2199
Caracas Ct
Length: 0.03 miles
Direction: SE-NW
Address range: 2100 to 2199
Direction: SE-NW
Address range: 2100 to 2199